2871
Osprey: Open-Source Processing, Reconstruction & Estimation of Magnetic Resonance Spectroscopy Data1Russell H. Morgan Department of Radiology and Radiological Science, The Johns Hopkins University School of Medicine, Baltimore, MD, United States, 2F. M. Kirby Research Center for Functional Brain Imaging, Kennedy Krieger Institute, Baltimore, MD, United States
Synopsis
Magnetic resonance spectroscopy (MRS) offers a wide range of methods to study in vivo metabolism. As a result of this diversity, data acquisition and analysis are far from standardized, and researchers frequently develop customized and therefore highly heterogeneous pipelines, often interfacing with commercial or closed-source external fitting software. Here, we present “Osprey”, an all-in-one software package that incorporates all steps of state-of-the-art pre-processing, linear-combination modeling, tissue correction, quantification, and visualization of MRS data from the human brain. Osprey provides a modular, fully open-source framework, allowing the community to rapidly incorporate future methodological developments, accelerate their adaptation, and foster standardization.
Introduction
Magnetic resonance spectroscopy (MRS) has long been used to study in vivo brain biochemistry. Modern MRS data analysis requires elaborate preprocessing, interfacing with external fitting software, and appropriate tissue and relaxation corrections of quantitative results exported from the external software. Well-resourced labs frequently rely on in-house code implementations for such tasks, but a widely used standardized pipeline is currently not available. Additionally, the default linear-combination modeling software is an expensive, closed-source, commercial product with limited on-going development. As a result, the entry threshold for new labs looking to apply MRS is high, the methods applied are heterogeneous and often poorly described in the literature, and the future is uncertain.Here we describe a new MATLAB-based toolbox “Osprey” which streamlines all steps of state-of-the-art pre-processing, linear-combination modeling, tissue correction, quantification, and visualization of MRS data into a single environment. The Osprey framework is designed in a modular way to flexibly adopt new methods and encourage community contribution.
Methods
The Osprey workflow consists of seven separate modules: Job, Load, Process, Fit, Coreg, Seg, and Quantify. After defining an analysis Job by specifying metabolite and water reference data, structural images, and fit settings, Load stores the raw data in an Osprey data structure. Process performs coil-combination1, alignment of individual averages2, eddy-current correction, water removal, baseline correction, correct frequency referencing, and alignment of J-difference-edited sub-spectra. Fit models the processed spectra in the frequency domain (concatenating the real and imaginary parts) through constrained non-linear least-squares optimization. Sequence-specific basis sets include spatially resolved density-matrix-simulated metabolite basis functions (computed with FID-A3) and macromolecule/lipid basis functions as specified in Tarquin4 and LCModel5. The model includes global (zero- and first-order phase, Gaussian line-broadening, cubic B-spline baseline) and basis-function-specific parameters (amplitude, Lorentzian line-broadening, frequency shift); the linearly occurring amplitude parameters are computed at each iteration with a non-negative least-squares solver. Constraints on non-linear parameters and weak soft constraints on macromolecule/lipid amplitudes are defined as in Tarquin to stabilize the solution. Coreg creates a binary MRS voxel mask and co-registers it to a structural image. Seg invokes the SPM12 segmentation function6 to derive fractional tissue volumes for gray matter, white matter, and CSF. Quantify calculates various quantitative outputs: ratios /tCr; CSF-corrected; tissue-and-relaxation-corrected7 using published metabolite and water relaxation parameters; and alpha-corrected8 (for GABA-edited data only).The Osprey job system supports batch processing of multiple datasets. Osprey automatically recognizes most common file formats (sdat/spar, data/list, rda, Siemens TWIX, DICOM, GE-P). Currently, single-voxel conventional and J-difference-edited (MEGA, HERMES, HERCULES) data from many sequence implementations are supported. Basis sets and support for other sequences will be continuously added.
To allow familiar external data modelling, Osprey can export pre-processed data in formats readable by LCModel, Tarquin, and jMRUI9. Quantitative results can be exported in CSV format for analysis in statistical software.
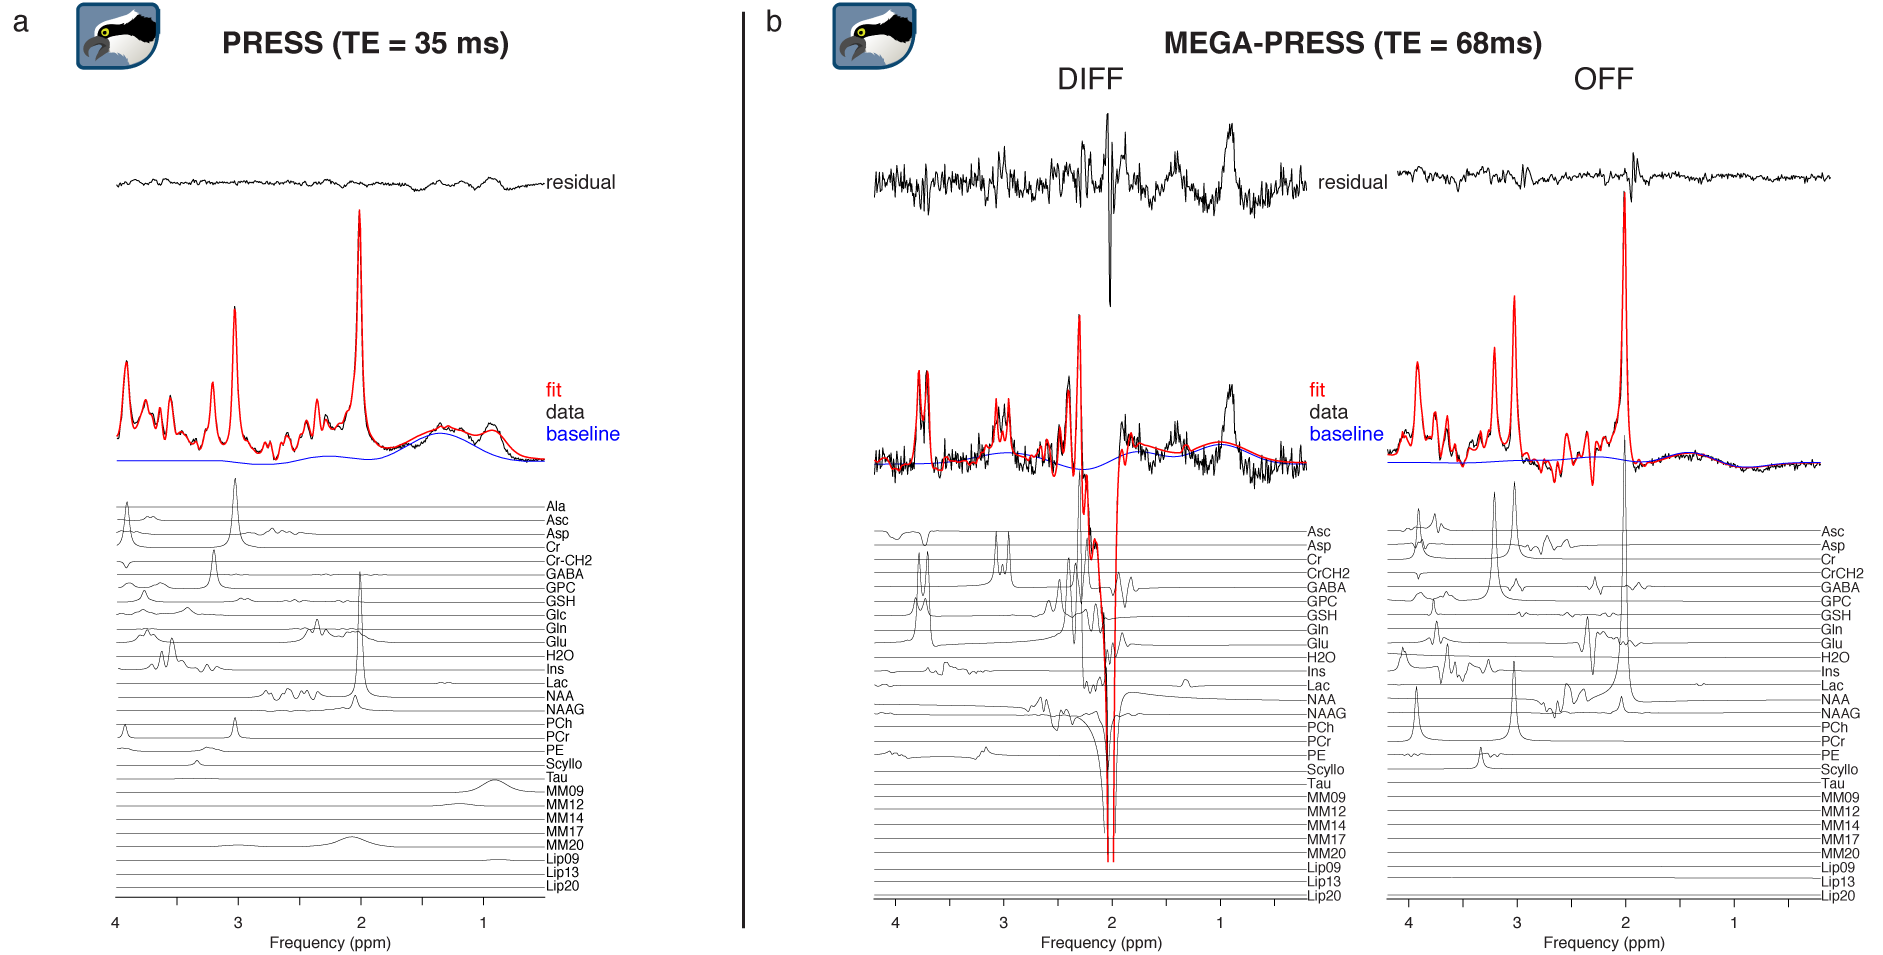
For demonstration purposes of this brief abstract, a sample of 12 PRESS (Philips, TE = 35 ms) and 12 GABA-edited MEGA-PRESS (Philips, TE = 68 ms) datasets from the “Big GABA10” repository (https://www.nitrc.org/projects/biggaba/) was loaded, processed, fit, and quantified (with respect to total creatine) with Osprey.
Results
Representative linear-combination modeling results of a PRESS dataset and a GABA-edited MEGA-PRESS dataset are shown in Figure 1a and 1b. The fits approximate the data reasonably well with a flat baseline.Figure 2 shows quantitative results of the sample for PRESS (Fig. 2a) and MEGA-PRESS (Fig. 2b). Mean tCr ratios agree with expected values (PRESS: tNAA/tCr = 1.29, tCho/tCr = 0.14, Glx/tCr = 1.66, Ins/tCr = 0.84; MEGA-PRESS: GABA/tCr = 0.13, Glx/tCr = 1.46). Low coefficients of variation indicate a robust modelling process.
Discussion
Since MRS is a quantitative technique, the results of MRS experiments depend substantially on the way that data are processed, modelled, and evaluated. While widely used de-facto-standardized processing and analysis toolboxes have been developed for many other quantitative MRI modalities, no such framework currently exists for MRS. As a result, most researchers have developed their own legacy code to prepare their data for third-party quantification software.This practice is problematic for a number of reasons: a) methodological heterogeneity and opacity diminish comparability and reproducibility of quantitative MRS studies; b) benchmarking and subsequent adaptation of methodological progress is considerably slowed down; c) researchers new to the field experience a high-level entry threshold; d) strong dependency on engagement, support, and funding situation of third-party software developers leaves the community vulnerable.
The new toolkit "Osprey" has been designed to address the lack of a freely available state-of-the-art software that unifies all steps of modern MRS data analysis in a common framework. Osprey bundles robust, peer-reviewed data processing methods into a modular workflow that is easily augmented by community developers. Notably, the quantification model is fully accessible, modifiable, and exchangeable, allowing researchers to study the factors influencing results of linear-combination modeling, and to implement new methods seamlessly.
The Osprey source code (in MATLAB) is publicly available at https://github.com/schorschinho/osprey/. It is continuously developed to add new functions and support for other MRS sequences.
Conclusion
Osprey offers an all-inclusive framework for pre-processing, linear-combination modeling, and quantification of MRS data. Osprey’s modular open-source design makes it highly flexible and expandable through community engagement, allowing improved methods to be rapidly adopted and benchmarked.Acknowledgements
This work was supported by NIH grants K99 AG062230, R01 EB016089, R01 EB023963, and P41 EB015909.References
1. Hall, E. L., Stephenson, M. C., Price, D. & Morris, P. G. Methodology for improved detection of low concentration metabolites in MRS: Optimised combination of signals from multi-element coil arrays. NeuroImage 86, 35–42 (2014).
2. Near, J. et al. Frequency and phase drift correction of magnetic resonance spectroscopy data by spectral registration in the time domain. Magn Reson Med (2014) doi:10.1002/mrm.25094.
3. Simpson, R., Devenyi, G. A., Jezzard, P., Hennessy, T. J. & Near, J. Advanced processing and simulation of MRS data using the FID appliance (FID-A)-An open source, MATLAB-based toolkit. Magnetic Resonance in Medicine 77, 23–33 (2017).
4. Wilson, M., Reynolds, G., Kauppinen, R. A., Arvanitis, T. N. & Peet, A. C. A constrained least-squares approach to the automated quantitation of in vivo 1 H magnetic resonance spectroscopy data. Magnetic Resonance in Medicine 65, 1–12 (2011).
5. Provencher, S. W. Estimation of metabolite concentrations from localized in vivo proton NMR spectra. Magnetic resonance in medicine 30, 672–9 (1993).
6. Ashburner, J. & Friston, K. J. Unified segmentation. NeuroImage 26, 839–851 (2005).
7. Gasparovic, C. et al. Use of tissue water as a concentration reference for proton spectroscopic imaging. Magnetic Resonance in Medicine 55, 1219–1226 (2006).
8. Harris, A. D., Puts, N. A. J. & Edden, R. A. E. Tissue correction for GABA-edited MRS: Considerations of voxel composition, tissue segmentation, and tissue relaxations. Journal of Magnetic Resonance Imaging 42, (2015).
9. Stefan, D. et al. Quantitation of magnetic resonance spectroscopy signals: the jMRUI software package. Measurement Science and Technology 20, 104035 (2009).
10. Mikkelsen, M. et al. Big GABA: Edited MR spectroscopy at 24 research sites. NeuroImage 159, (2017).
Figures