2869
Frequency and Phase Correction of J-Difference Edited Spectra using Deep Learning1Russell H. Morgan Department of Radiology and Radiological Science, Johns Hopkins University School of Medicine, Baltimore, MD, United States, 2F. M. Kirby Research Center for Functional Brain Imaging, Kennedy Krieger Institute, Baltimore, MD, United States, 3Department of Electrical and Computer Engineering, Johns Hopkins University, Baltimore, MD, United States
Synopsis
Frequency-and-phase correction is an important step in the processing of single-voxel magnetic resonance spectroscopy data, and is required for J-difference editing, which relies on subtraction to reveal a low-SNR signal. We investigated an approach for frequency-and-phase correction using deep learning. Our networks were trained using simulated spectra manipulated with different frequency-and-phase offsets. During validation, the network returned spectra that were corrected to within 1.76 ± 1.19 degrees of phase and 0.09 ± 0.05 Hz of frequency, giving a difference spectrum very similar to the true unmanipulated spectrum. Frequency-and-phase correction is a promising application for deep learning in in vivo MRS.
Introduction
Frequency-and-phase correction (FPC) is a necessary step in the processing of single-voxel magnetic resonance spectroscopy (MRS) data in order to reliably quantify the targeted metabolites1. FPC is especially important when performing J-difference editing, which relies on subtraction between two signal-intense spectra (OFF and ON) in order to reveal the much smaller signal (e.g. of GABA), in the resulting difference spectrum2. If the OFF and ON spectra are poorly aligned in terms of phase and frequency, the resulting difference spectra will be impacted by subtraction artifacts and resulting quantification biases.Deep learning (DL) is a popular category of machine learning algorithms that uses several layers in order to extract information from the data. Once the structure of a multi-layer network is defined, various weights and biases need to be calibrated using training data before the trained network can be applied. DL algorithms have shown promising results in various applications but have not previously been applied to post-processing edited MRS data.Current approaches for FPC, such as spectral registration3, are generally successful, but can fail in cases of low SNR, variable water suppression, and lipid contamination (particularly with variable phase of excitation at voxel edges). Since DL has been shown to be very flexible and effective in low-SNR applications, the aim here was to develop and investigate an approach for DL-based FPC of edited MRS data.
Methods
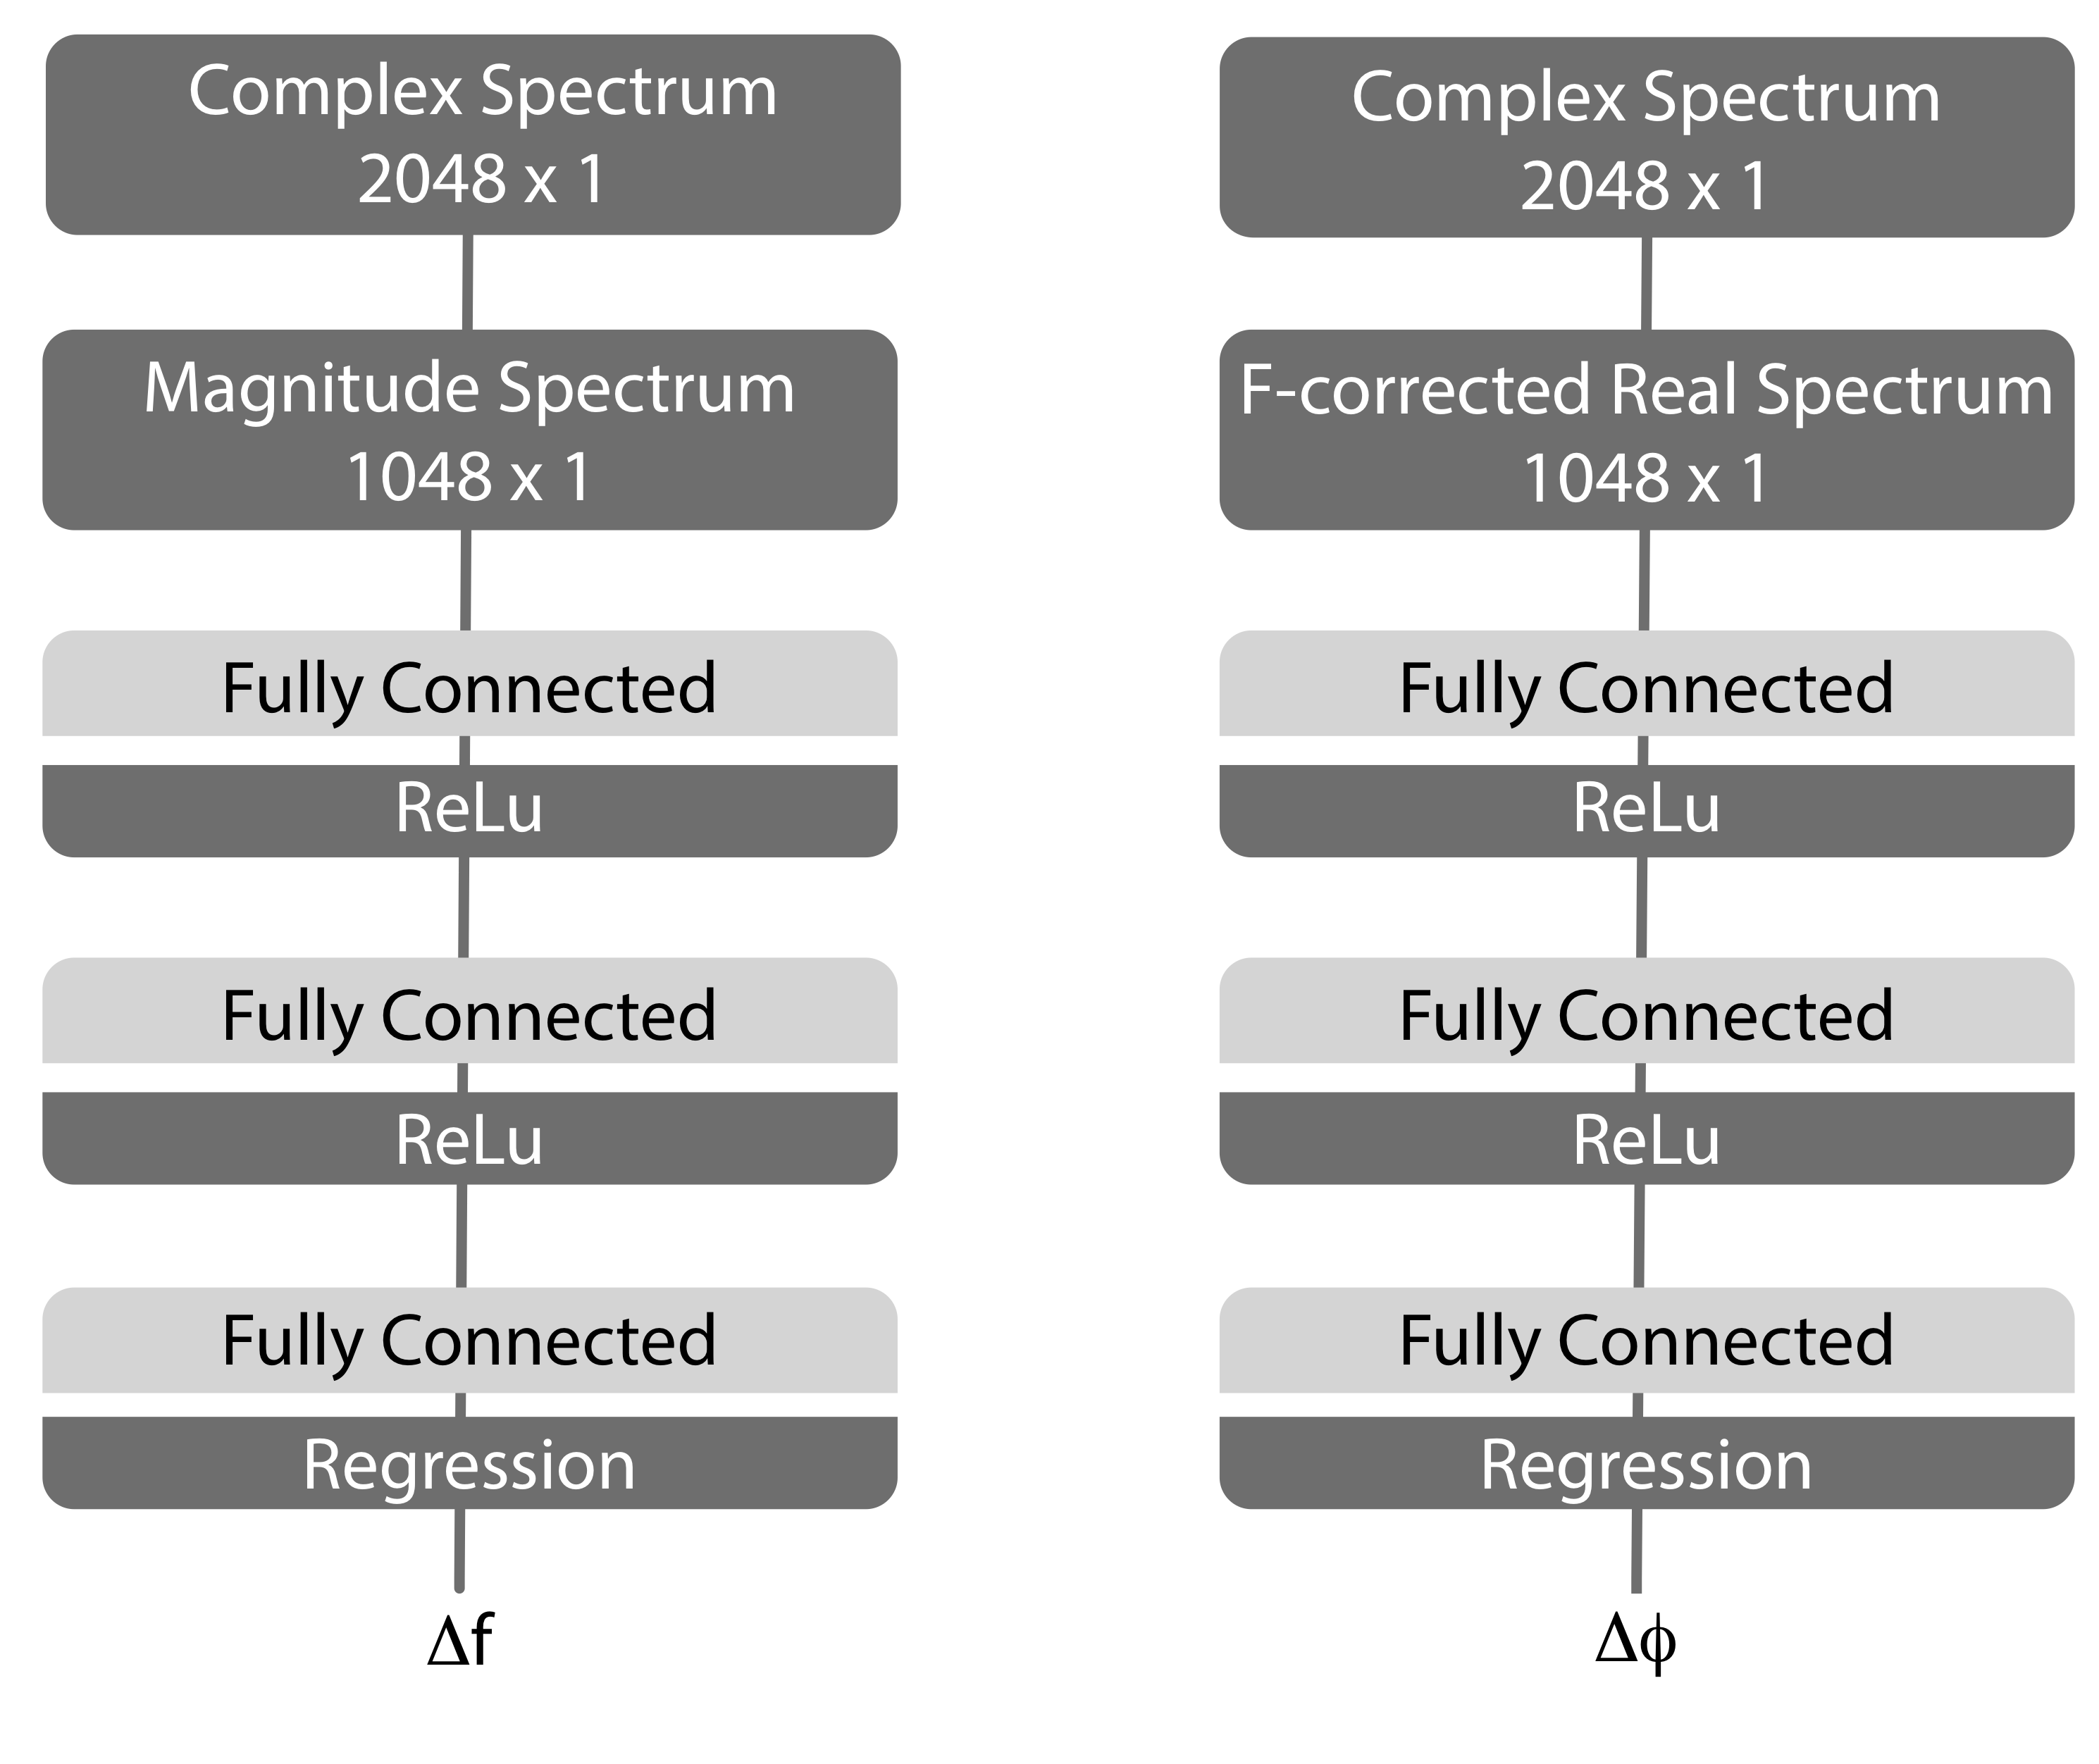
DL-based FPC was performed using a sequential approach (frequency alignment then phase correction) with separate networks for ON- and OFF-edited spectra, for a total of four networks to train. These four networks had the same basic structure (Figure 1) and were implemented in MATLAB. Each network consisted of two fully connected layers (1024 nodes) that each was followed by a rectified linear unit (ReLu) layer with the purpose of introducing non-linearity in the network. The last ReLu layer was followed by a third fully connected layer (1 node) and a linear output layer that gave the predicted frequency or phase offset parameter as a single continuous variable.The training data consisted of 20000 simulated (FID-A Toolbox4) low-noise ON/OFF spectra that were manipulated with randomized frequency and phase offsets. When training the networks for prediction of the frequency offset, the resulting magnitude spectra were used as input where the applied frequency and phase offsets were within the intervals [-20, 20] Hz and [-180, 180] degrees, respectively. When training the networks for prediction of the phase offset, the resulting real spectra were used as input where the spectra solely had been manipulated with phase offsets within the interval [-180, 180] degrees. Following training, 320 simulated low-noise ON/OFF spectra with randomized frequency and phase offsets in the intervals [-20, 20] Hz and [-90, 90] degrees, respectively, were used for validation.
The mean difference spectrum was computed by subtracting the averaged OFF spectrum from the averaged ON spectrum. The intraclass correlation (ICC) was used for the purpose of determining how similar the resulting difference spectrum is compared to a true difference spectrum computed without any phase or frequency offsets. Finally, the absolute errors between the actual and predicted offsets were computed to determine network performance.
Results
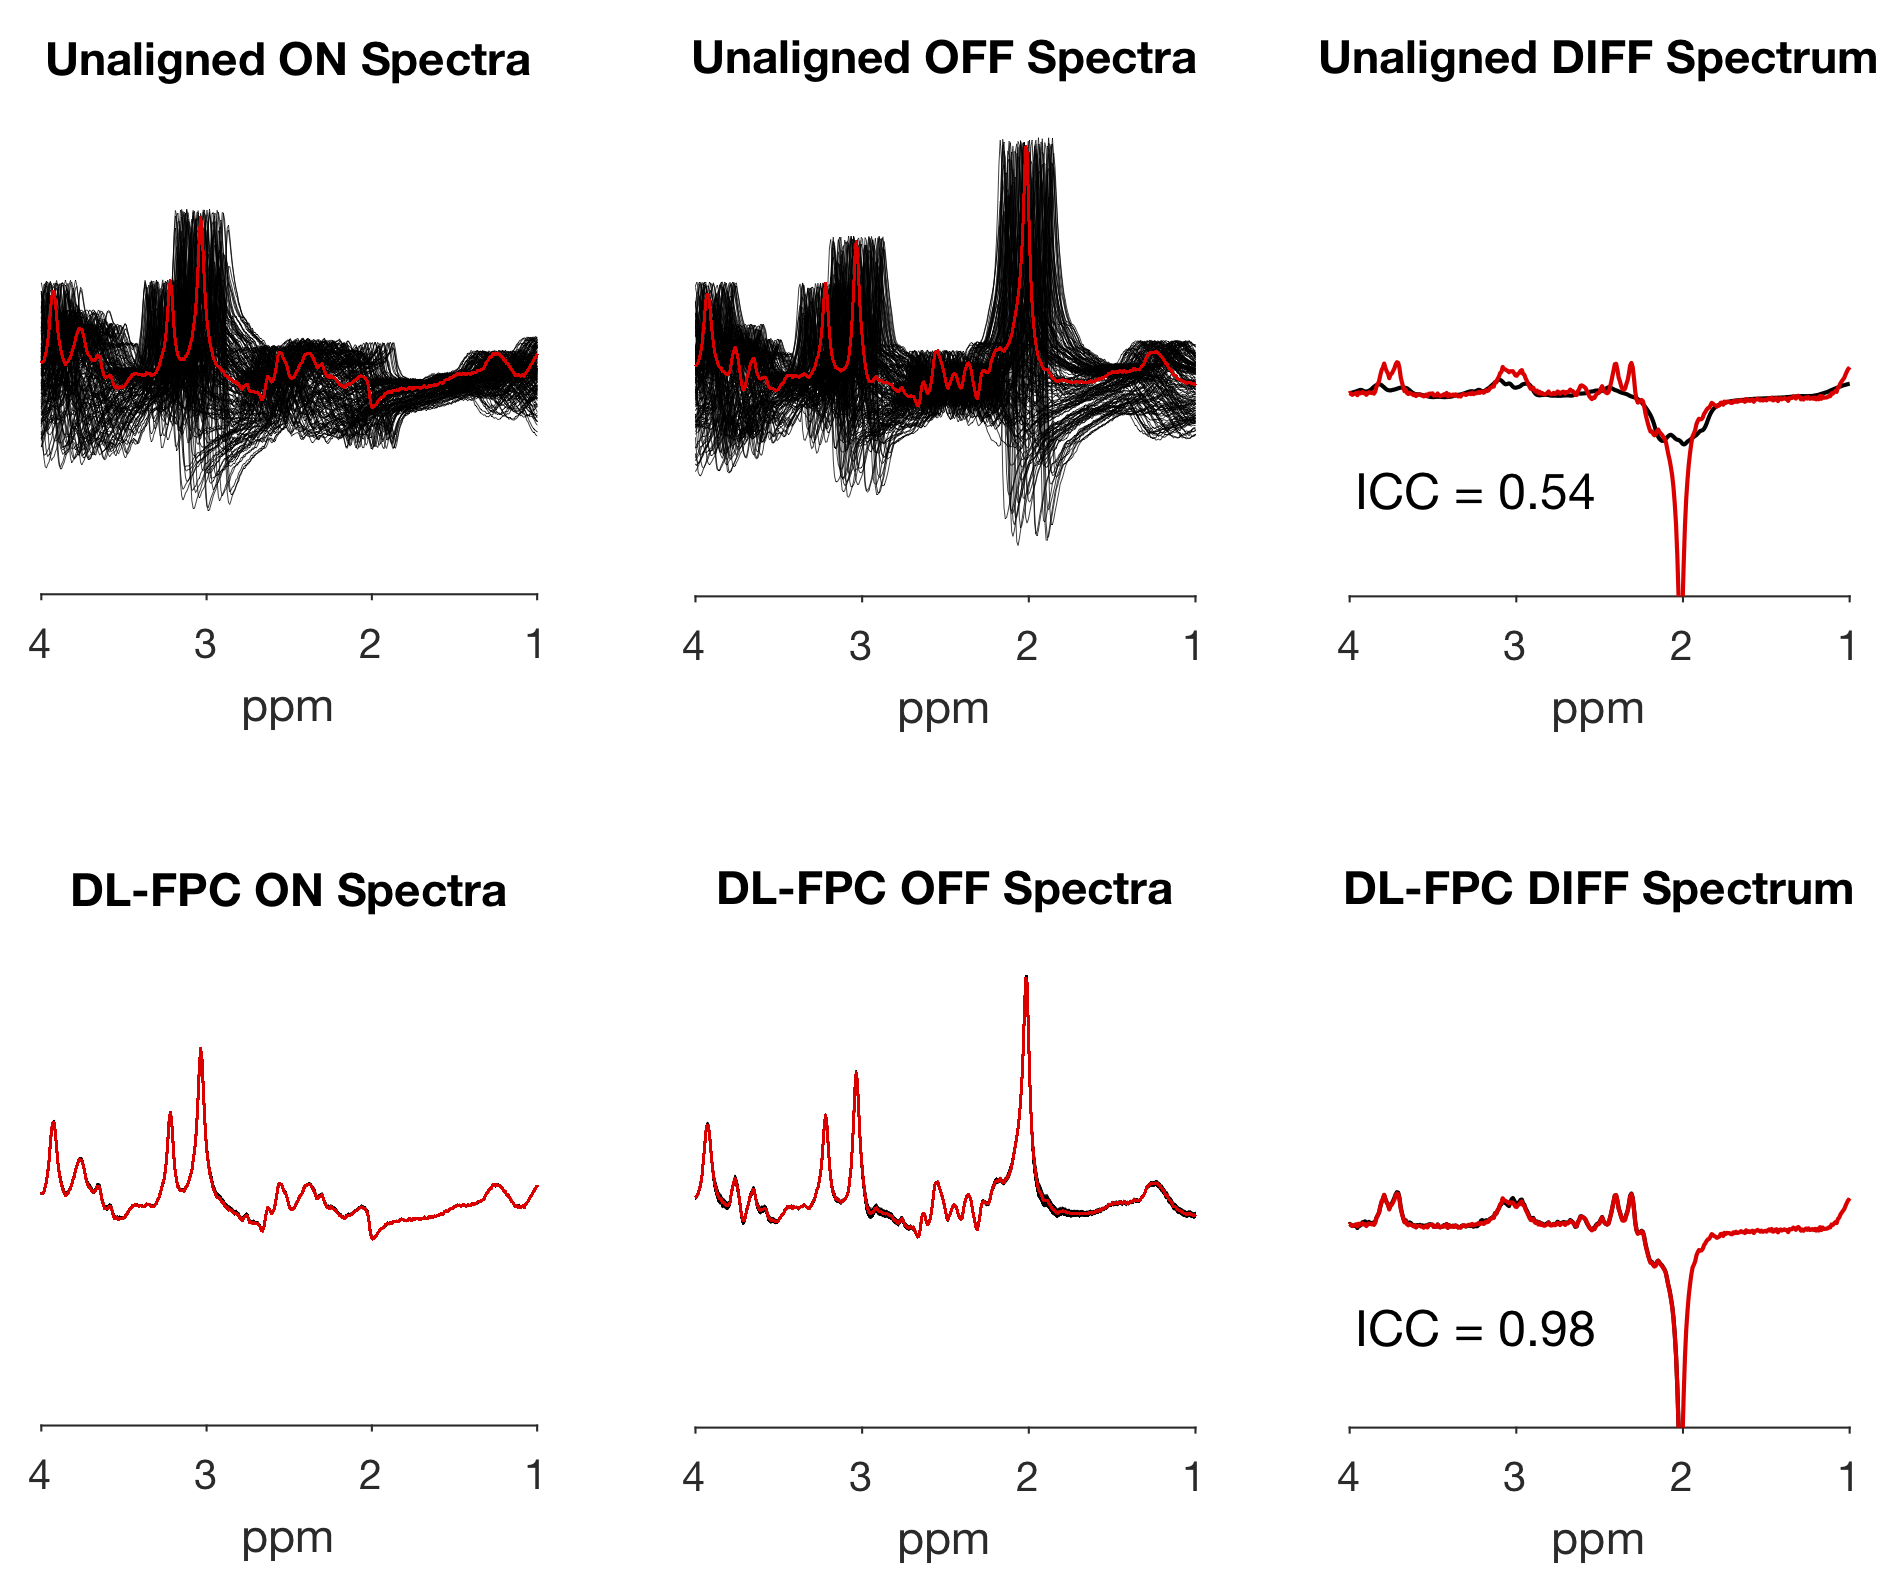
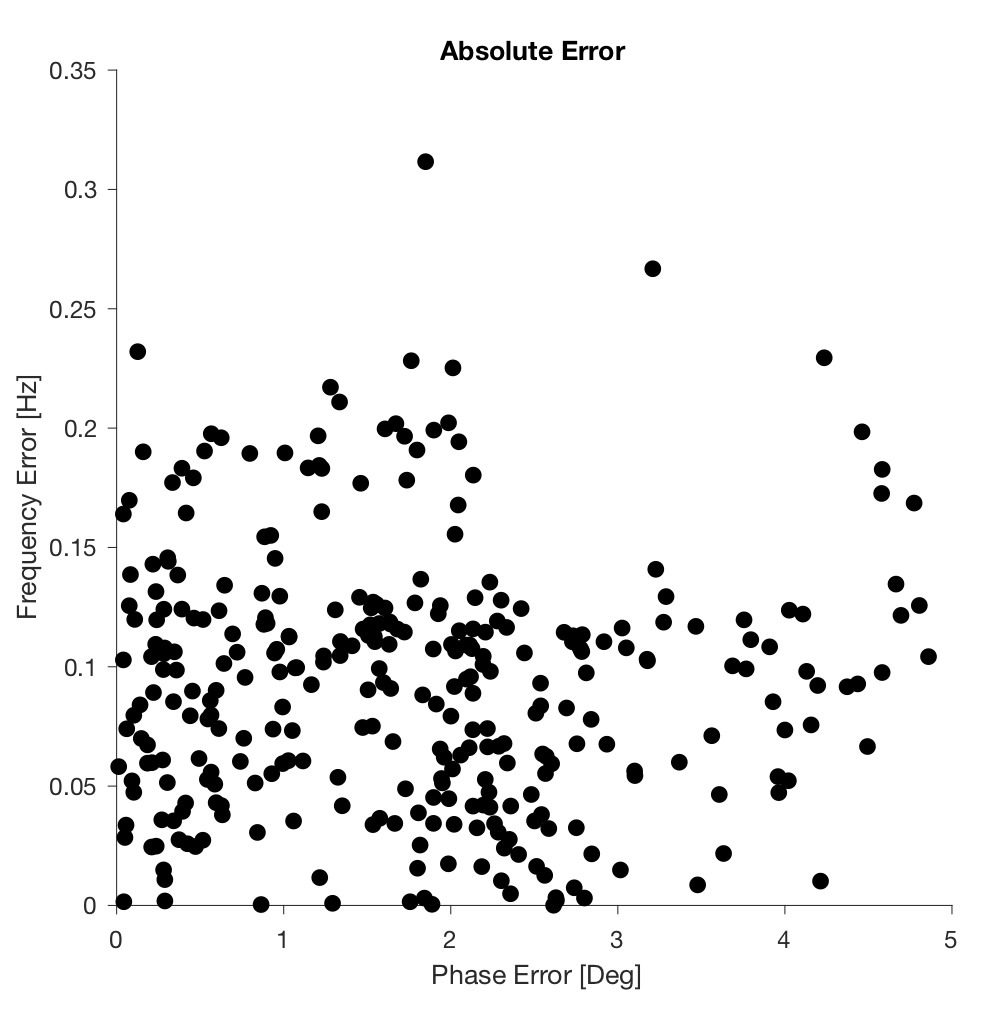
Each network was very fast to train (about 2.5 min each) and performing the DL-based FPC on each validation spectrum took ~50 ms, which was comparable to spectral registration (~45 ms). Figure 2 shows all the validation spectra, both before and after alignment using DL-based FPC. Compared to the true spectra (shown in red) that were not subjected to any phase or frequency manipulation, it can be seen that the DL-based FPC performs well the alignment of the ON/OFF spectra. The DL-based FPC aligned difference spectrum was much more similar to the true simulated difference spectrum (ICC=0.98) than was the unaligned difference spectrum (ICC=0.54). However, small subtraction artifacts from choline and creatine were still present in the resulting difference spectrum. Figure 3 shows the absolute errors computed between the actual offsets and the offsets predicted by the networks. The networks predicted offsets to be within 1.76±1.19 degrees of phase and 0.09±0.05 Hz of frequency.Discussion
The DL-based FPC performed well, yielding a difference spectrum that was extremely similar to the true unmanipulated difference spectrum. One advantage of our sequential FPC approach was the separation of frequency and phase corrections, by using magnitude spectra to estimate the frequency offset. One potential issue is that the phase offset estimation can be biased by an insufficient frequency correction since this second network was trained assuming perfect prior frequency alignment. This potential issue may have caused the small subtraction artifacts still present in the resulting difference spectrum. In future work, we will train the networks with more diverse training data (e.g. with variable water suppression), and with in vivo edited data from the BIG GABA study5. Since we do not know the true frequency and phase offsets for in vivo data, we have to compare the results to another method for FPC such as spectral registration.Conclusion
Our DL-based FPC approach showed good results for simulated J-difference edited data. This is a promising result for future investigations of using DL-based FPC for in vivo edited MRS-data.Acknowledgements
This work was supported by NIH grants R01 EB016089, R01 EB023693, and P41 EB015909.References
1. Wilson M, Andronesi O, Barker PB, et al. Methodological consensus on clinical proton MRS of the brain: Review and recommendations. Magn. Reson. Med. 2019;82:527–550 doi: 10.1002/mrm.27742.
2. Evans CJ, Puts NAJ, Robson SE, et al. Subtraction artifacts and frequency (mis-)alignment in J-difference GABA editing. J. Magn. Reson. Imaging 2013;38:970–975 doi: 10.1002/jmri.23923.
3. Near J, Edden R, Evans CJ, Paquin R, Harris A, Jezzard P. Frequency and phase drift correction of magnetic resonance spectroscopy data by spectral registration in the time domain. Magn. Reson. Med. 2015;73:44–50 doi: 10.1002/mrm.25094.
4. Simpson R, Devenyi GA, Jezzard P, et al. Advanced processing and simulation of MRS data using the FID appliance (FID-A)—an open source, MATLAB-based toolkit. Magn. Reson. Med. 2017;77:23–33.
5. Mikkelsen M, Barker PB, Bhattacharyya PK, et al. Big GABA: edited MR spectroscopy at 24 research sites. Neuroimage, 159 (2017), pp. 32-45, 10.1016/j.neuroimage.2017.07.021
Figures