2868
Using Simultaneous Multi-echo Fitting to Accelerate Magnetic Resonance Spectroscopic Relaxometry1Radiology / Center for Magnetic Resonance Research, University of Minnesota-Twin Cities, Minneapolis, MN, United States
Synopsis
Measurements of metabolite T2 relaxation constants can be valuable biomarkers of aging and disease. The conventional method for measuring multiple metabolite T2s is to independently fit spectra from a multi-TE and then separately fit the amplitudes to an exponential decay to estimate T2. In this work we implement a simultaneous fitting approach to fit all of the multi-TE spectra at the same time by incorporating the transverse relaxation in the model. This approach greatly reduces the degrees of freedom and enable T2 estimation in noisy data, which may be used to shorten acquisition times and/or measure smaller regions.
Introduction
The T2 relaxation constants for several neuronal metabolites have been proposed as potential markers of aging (1,2) and psychiatric disease (3). The conventional approach for estimating multiple metabolite T2s is to acquire a series of spectra at multiple echo times (multi-TE spectra), fit each spectrum independently to estimate metabolite amplitudes, and subsequently fit the amplitude-TE curve with an exponential decay to estimate all T2 constants. This approach, here termed sequential fitting, is readily performed using standard MRS processing software. An alternate approach is to simultaneously fit the amplitudes and T2 relaxation constants for each metabolite from the multi-TE spectra. This approach has the advantage of fewer free parameters because the assumption of mono-exponential relaxation is integrated in the model, which can improve parameter estimation in noisy data (2,4–7).In this work we compare the performance of these two approaches for estimating metabolite T2s from multi-TE spectra acquired from three brain regions in healthy young participants by assessing inter-subject variability and sensitivity for detecting expected regional differences, and evaluating the impact of accelerating these acquisitions by retrospectively discarding data.
Methods
Twenty-nine healthy, young (age 18-22 years) human participants were scanned under an IRB-approved protocol. Data were acquired using a 3 T Siemens Prisma system using a 32-channel receive-only head coil. Using standard T1- weighted imaging as guidance, ~15 mL volumes of interest (VOI) were placed in the occipital cingulate cortex (OCC), posterior cingulate cortex (PCC), and prefrontal cortex (PFC). In each region, spectra were acquired using LASER localization (8) with 5.12 ms GOIA-HS4 refocusing pulses (9), VAPOR water suppression (10), TR = 3 s, 6 kHz spectral width, and 2048 complex points. Spectra were acquired with TE = 35, 140, 230, 290, 330, and 400 ms, with 8, 16, 32, 32, 64, 64 averages respectfully, for a total acquisition time of 10.8 min/region (11). Non-suppressed water spectra were acquired at the same TEs for eddy current correction.All analyses were performed in Matlab, and fitting performed with the lsqnonlin function. Spectra were processed automatically using eddy current correction, zero-filling to 4096 points, and shot-by-shot phase and frequency correction prior to averaging. Basis sets for 19 metabolites were simulated for each TE. Separate basis spectra were simulated for the 3.03 and 3.9 ppm resonances of Cr and PCr, and also the singlet and multiplet resonances of NAA (sNAA and mNAA), as these moieties have been previously shown to have significantly different T2s (11). Additionally, a measured macromolecule (MM) spectrum (TR/TI=2500/740 ms, 128 averages) was included in the TE=35 ms basis set. Spectral lineshape was modeled with a global Voigt function (12).
The sequential approach first fit each TE spectrum independently, then extracted the amplitudes for sNAA, mNAA, tCho, Glu, Ins, tCr30, tCr39 for fitting with a mono-exponential decay curve to estimate T2. Considering all 6 TEs there were 148 free parameters in the spectral fits, and 21 free parameters in the T2 fits, giving 169 degrees of freedom for T2 estimation. The simultaneous fit used the same basis set, processing, and fitting algorithm but modeled each resonance with a 2-parameter mono-exponential decay, and included a resonance-specific T2 homogeneous broadening term. The total degrees of freedom in the simultaneous model were 50. To assess robustness to noise, averages were retrospectively discarded to simulate accelerations of 2x, 4x, and 8x, and all processing was repeated.
Results
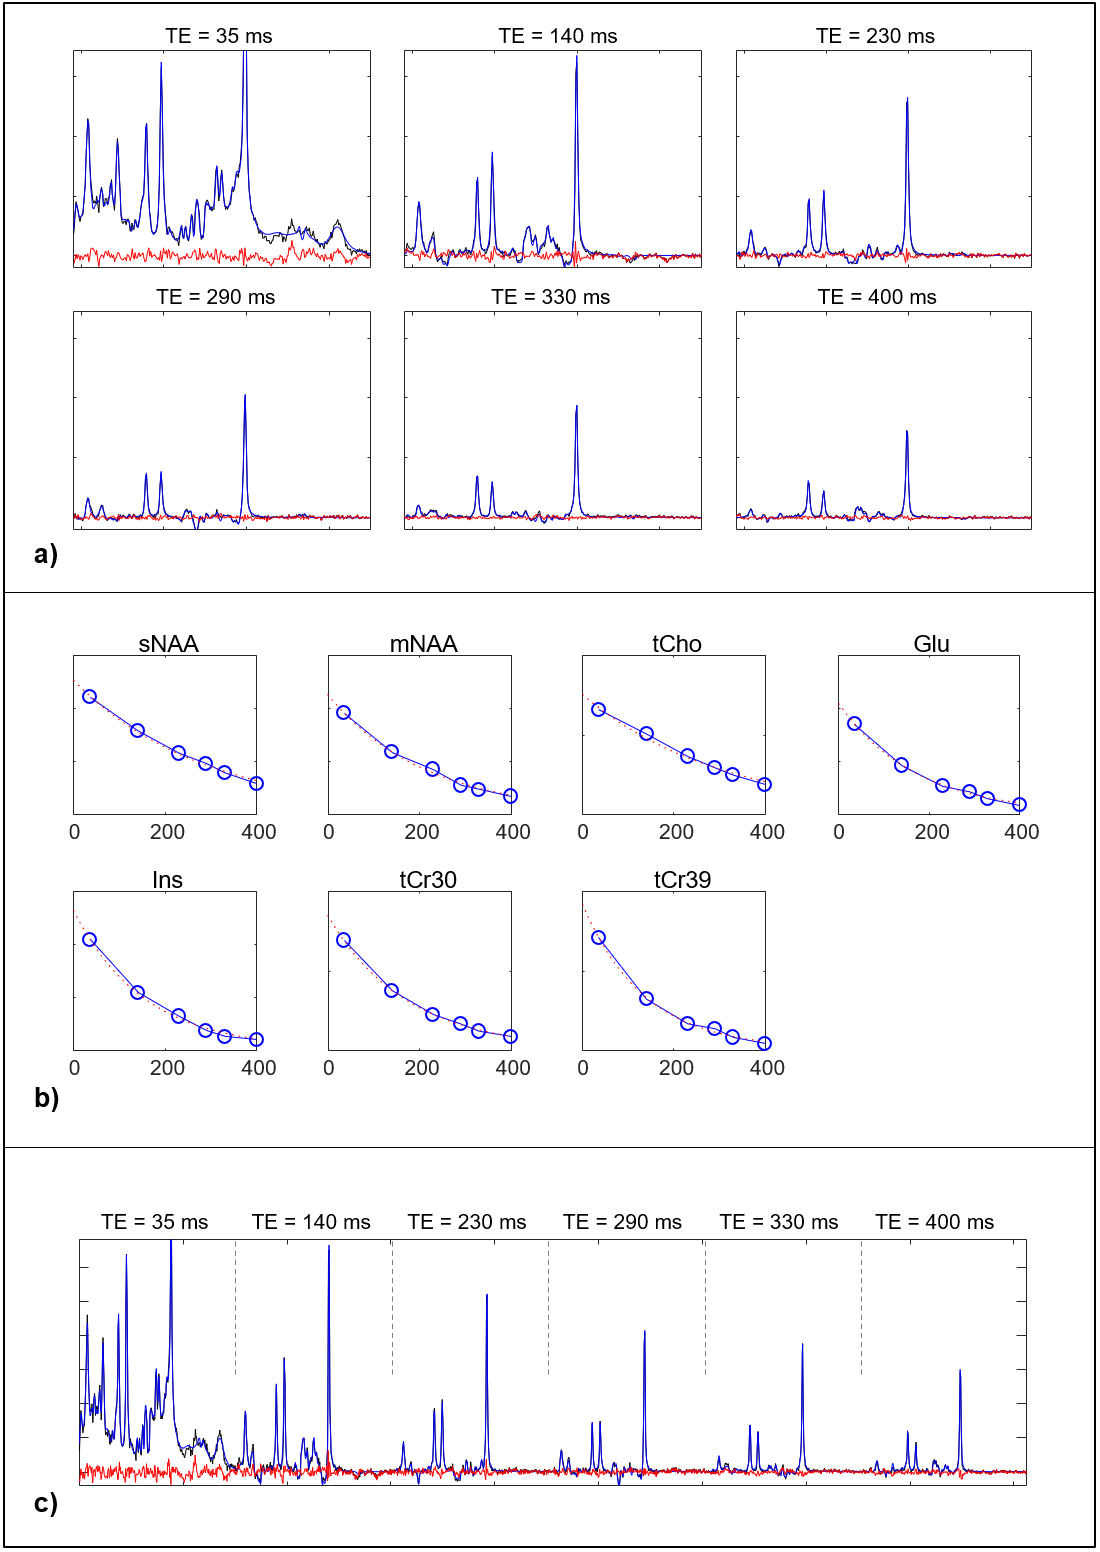
Figure 1 shows an example dataset. Both methods fit the data with similar residuals. The spectral fit coefficient of determination (R2) measured across all spectra, subjects, and regions was very high with both fitting methods (R2 = 0.992 simultaneous, 0.993 sequential), indicating that both methods describe the data well.Figure 2 compares T2 values of 7 resonances measured in the PFC along with the inter-subject standard deviation. Simultaneous fitting showed smaller within-region intersubject variation for tCho, mNAA, sNAA, tCr30, tCr39 in all regions; sequential fitting had smaller intersubject variation for Glu, while the findings for Ins varied across regions.
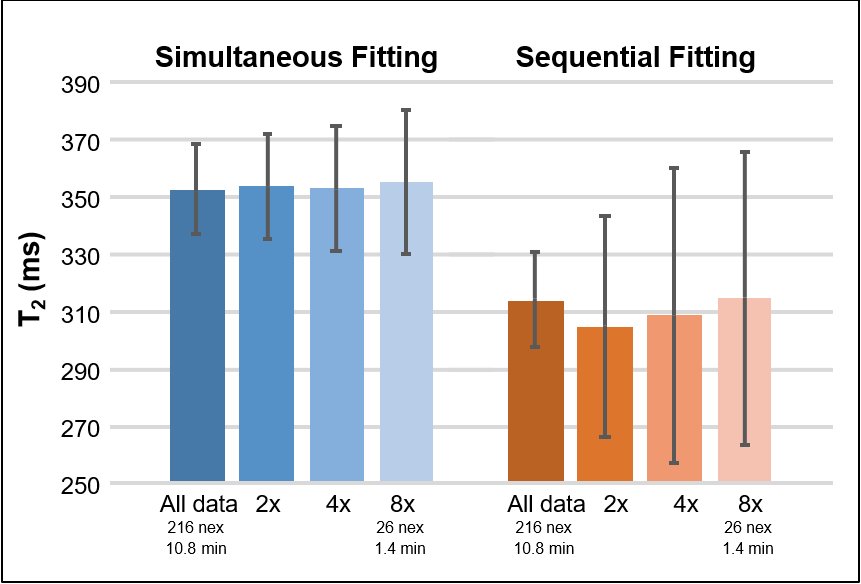
Figure 3 shows the effect of acceleration on the intersubject variability of the T2 for the sNAA in the PFC, indicating that the simultaneous fitting is more robust to lower signal-to-noise levels (SNR). Similar trends were observed with other resonances and regions.
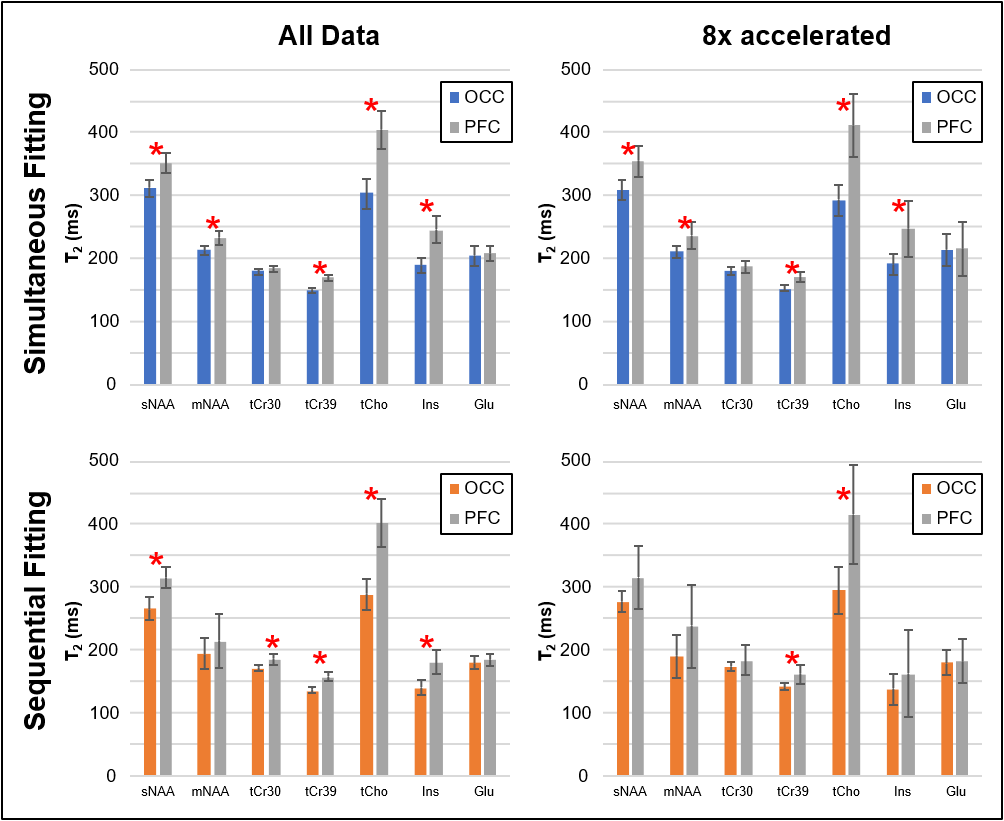
The ability to detect regional differences is compared in Figure 4, which indicates which metabolite T2s were significantly different between OCC and PFC. Table 1 further details the regional detection ability for variable levels of acceleration. Due to its robustness to low SNR, the simultaneous fitting method retains its sensitivity consistently with accelerations up to 8x.
Discussion
This work demonstrates how simultaneous fitting of multiple spectra allows for better representation of prior knowledge, leading to improved precision and better performance in noisier data. For the example of the NAA singlet T2, previously shown to vary in aging and by brain region (2,3,11), it is possible to accelerate 8x with little impact on measurement precision.Conclusion
Simultaneous fitting of multi-TE spectra to estimate metabolite T2s provides improved noise sensitivity over the conventional sequential fitting approach, which may be used to shorten acquisition times and potentially measure smaller regions.Acknowledgements
Funding provided by NIH grants R21AG045606, P41 EB027061, S10OD017974References
1. Marjańska M, Emir UE, Deelchand DK, Terpstra M. Faster metabolite (1)H transverse relaxation in the elder human brain. PLoS ONE 2013;8:e77572 doi: 10.1371/journal.pone.0077572.
2. Kreis R, Slotboom J, Hofmann L, Boesch C. Integrated data acquisition and processing to determine metabolite contents, relaxation times, and macromolecule baseline in single examinations of individual subjects. Magnetic Resonance in Medicine 2005;54:761–768 doi: 10.1002/mrm.20673.
3. Ongür D, Prescot AP, Jensen JE, et al. T2 relaxation time abnormalities in bipolar disorder and schizophrenia. Magn Reson Med 2010;63:1–8 doi: 10.1002/mrm.22148.
4. Chong DGQ, Kreis R, Bolliger CS, Boesch C, Slotboom J. Two-dimensional linear-combination model fitting of magnetic resonance spectra to define the macromolecule baseline using FiTAID, a Fitting Tool for Arrays of Interrelated Datasets. Magn Reson Mater Phy 2011;24:147–164 doi: 10.1007/s10334-011-0246-y.
5. Adalid V, Döring A, Kyathanahally SP, Bolliger CS, Boesch C, Kreis R. Fitting interrelated datasets: metabolite diffusion and general lineshapes. MAGMA 2017;30:429–448 doi: 10.1007/s10334-017-0618-z.
6. Wyss PO, Bianchini C, Scheidegger M, et al. In vivo estimation of transverse relaxation time constant (T 2 ) of 17 human brain metabolites at 3T: T 2 of 17 Human Brain Metabolites at 3T. Magn. Reson. Med. 2018;80:452–461 doi: 10.1002/mrm.27067.
7. Fichtner ND, Henning A, Zoelch N, Boesch C, Kreis R. Elucidation of the downfield spectrum of human brain at 7 T using multiple inversion recovery delays and echo times: Elucidation of the Downfield Spectrum of Human Brain at 7 T. Magn. Reson. Med. 2017;78:11–19 doi: 10.1002/mrm.26343.
8. Garwood M, DelaBarre L. The return of the frequency sweep: designing adiabatic pulses for contemporary NMR. J Magn Reson 2001;153:155–177.
9. Tannús A, Garwood M. Adiabatic pulses. NMR Biomed 1997;10:423–434 doi: 10.1002/(sici)1099-1492(199712)10:8<423::aid-nbm488>3.0.co;2-x.
10. Tkác I, Starcuk Z, Choi IY, Gruetter R. In vivo 1H NMR spectroscopy of rat brain at 1 ms echo time. Magn Reson Med 1999;41:649–656 doi: 10.1002/(sici)1522-2594(199904)41:4<649::aid-mrm2>3.0.co;2-g.
11. Deelchand DK, Auerbach EJ, Kobayashi N, Marjańska M. Transverse relaxation time constants of the five major metabolites in human brain measured in vivo using LASER and PRESS at 3 T: T 2 of Human Brain Metabolites at 3 T. Magn. Reson. Med. 2018;79:1260–1265 doi: 10.1002/mrm.26826.
12. Marshall I, Higinbotham J, Bruce S, Freise A. Use of Voigt lineshape for quantification of in vivo 1H spectra. Magn Reson Med 1997;37:651–657 doi: 10.1002/mrm.1910370504.
Figures