2867
Phased-array combination of 2D MRS for lipid composition quantification in patients with breast cancer1Institute of Medical Sciences, School of Medicine, University of Aberdeen, Aberdeen, United Kingdom, 2Department of Clinical Radiology, Aberdeen Royal Infirmary, Aberdeen, United Kingdom, 3Department of Radiology, Royal Marsden Hospital, London, United Kingdom, 4Breast Unit, Aberdeen Royal Infirmary, Aberdeen, United Kingdom, 5Department of Oncology, Aberdeen Royal Infirmary, Aberdeen, United Kingdom
Synopsis
Signal combination algorithms, designed for 1D MRS, were adapted for lipid composition spectra acquired using 2D MRS of double quantum filtered correlation spectroscopy (DQF-COSY). The algorithms of adaptively optimised combination (AOC), noise decorrelated combination (nd-comb), and whitened singular value decomposition (WSVD) were evaluated on lipid composition spectra from healthy volunteers and patients with breast cancer (tumour and peritumoural adipose tissue). WSVD provided maximal SNR uniformly across all spectral peaks. WSVD, through the elimination of additional acquired reference spectrum, shortens acquisition in patients to less than 11 min instead of 17 min while maintaining sensitivity.
Introduction
Lipid composition in breast cancer, a central marker of disease progression1, can be non-invasively quantified using 2D MRS method of double quantum filtered correlation spectroscopy (DQF-COSY)2. However, the signal retention of only 25%3 and depleted lipids within tumour4,5, contribute to low signal to noise ratio (SNR). Since 2D MRS demands a long scan time, SNR improvement approaches beyond signal averaging is required for clinically viable applications. We therefore examined current combination algorithms, with a focus on noise decorrelated algorithms, on 2D spectra acquired using DQF-COSY MRS in breast cancer.Methods
Fifteen healthy female volunteers (mean age, 66 years; age range 58-76 years) participated in the study. Fifteen patients (mean age, 63 years; age range 53-71 years, seven grade II and eight grade III) and a further ten patients (mean age, 52 years; age range 36-63 years, one grade II and nine grade III) with invasive carcinoma were enrolled into the study to acquire lipid composition spectra from peritumoural adipose tissue and tumour respectively. The study was approved by the NHS Research Ethics Committee, and written informed consent was obtained from each participant prior to the study.Data Acquisition: MRS data were acquired on a 3 T MRI scanner (Achieva TX, Philips Healthcare, Best, Netherlands) using a 16-phased array breast coil. 2D spectra of lipid composition were acquired using single voxel DQF-COSY with TR of 552 ms, initial TE of 25 ms, t1 increment of 1 ms, 256 increments, 256 sampling points, 2 repeats per increment, spectral bandwidth of 1000 Hz, and encoding gradients of 30/40/100 ms mT/m. Reference spectra without water suppression were acquired using single voxel PRESS sequence with TR/TE of 1250/144 ms, 1024 data points, and spectral bandwidth of 2000 Hz. Data were collected from both breasts in volunteers with a voxel size of 2×2×2 cm3 containing mainly the adipose tissue. In patients, for spectra from tumour, the voxel was positioned snug-fit to the tumour and for spectra from peritumoural adipose tissue, the voxel was positioned at 1 cm from the tumour and was set to 2×2×2 cm3.
Data Processing: All the algorithms were developed in MATLAB (MathWorks, Natick, MA, USA). The raw data were averaged across repeated acquisitions before signal combination using adaptively optimised combination (AOC)6, noise decorrelated combination (nd-comb)7, whitened singular value decomposition (WSVD)8, S/N2, S/N, Signal, and Equal Weighting9. The averaged signal, organised as a 2D map based on t1 and t2 time domain axis for each coil element, was subsequently apodised using squared sine bell along both time domain axes and zero filled to 512 × 512 points. External (denoted by subscript “e”) and internal (denoted by subscript “i”) weighting coefficients were determined from the maximum peak of the reference spectrum and the maximum peak in frequency domain from first increment of DQF-COSY respectively. The weighting coefficient derived for a coil element was applied to the apodised and zero filled signals at the corresponding coil element. The combined 2D time domain signal was the summation across all the coil elements, and the combined 2D spectrum was subsequently derived using 2D Fast Fourier transform. The SNR of diagonal and cross spectral peaks was computed as the peak height divided by the standard deviation of the real part of the noise in a free peak region10. The SNR of the entire combined 2D spectrum was defined as the SNR of the dominant peak at (1.3,1.3) ppm. The SNR improvement of a spectral peak for an algorithm was computed as the percentage increase with reference to Equal Weighting. The non-uniformity of SNR improvement across the 2D spectrum was subsequently derived as the coefficient of variance (standard deviation divided by the mean) of the SNR improvement across all the spectral peaks. The SNR improvement of the entire spectrum was calculated as the percentage increase with reference to Signal Weighting.
Results
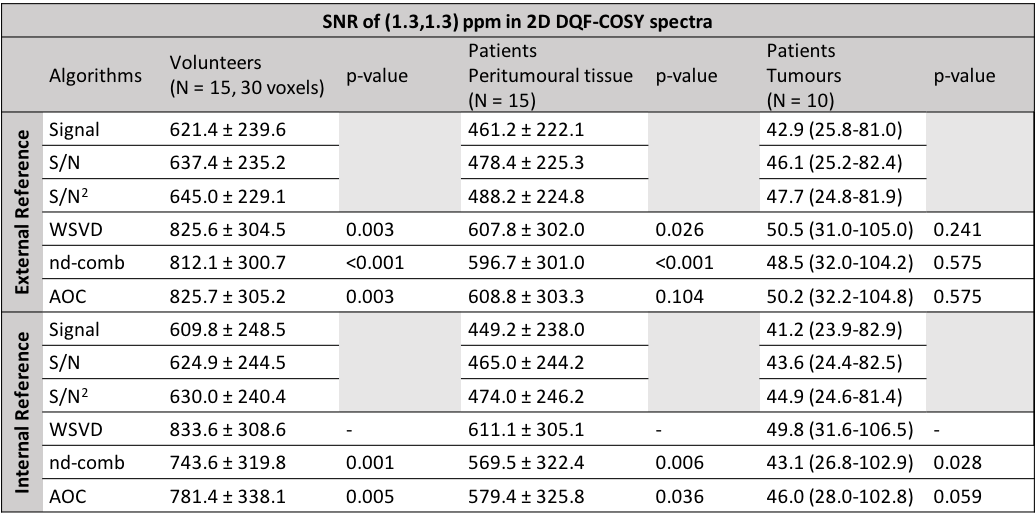
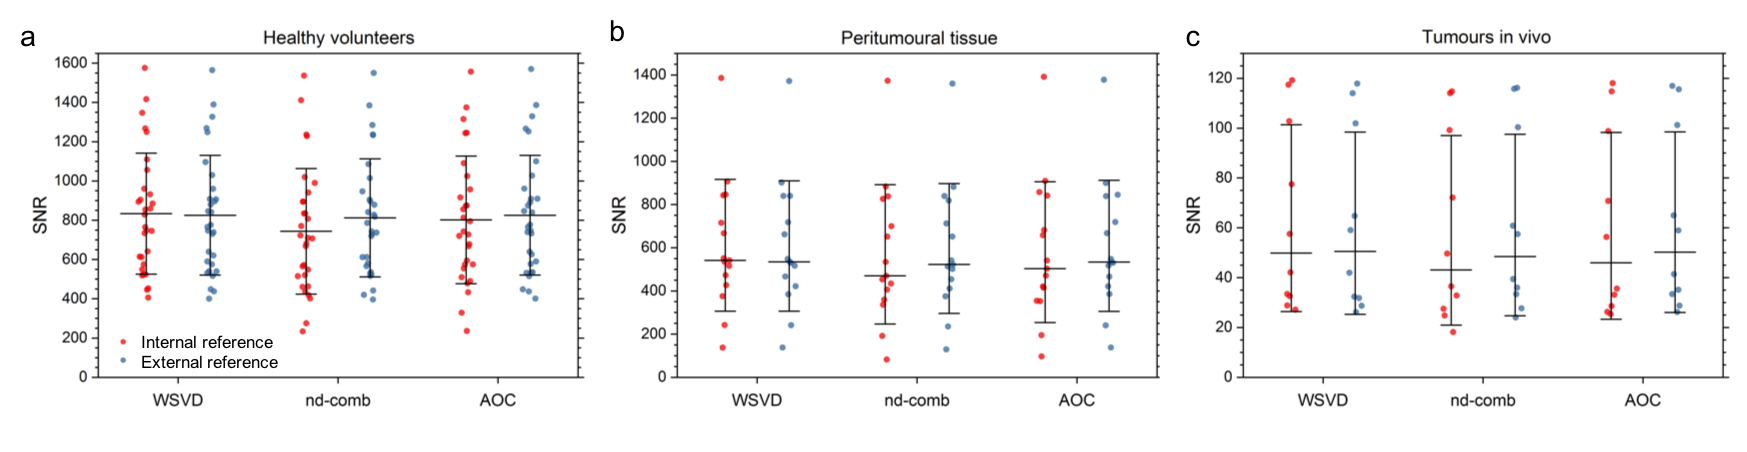
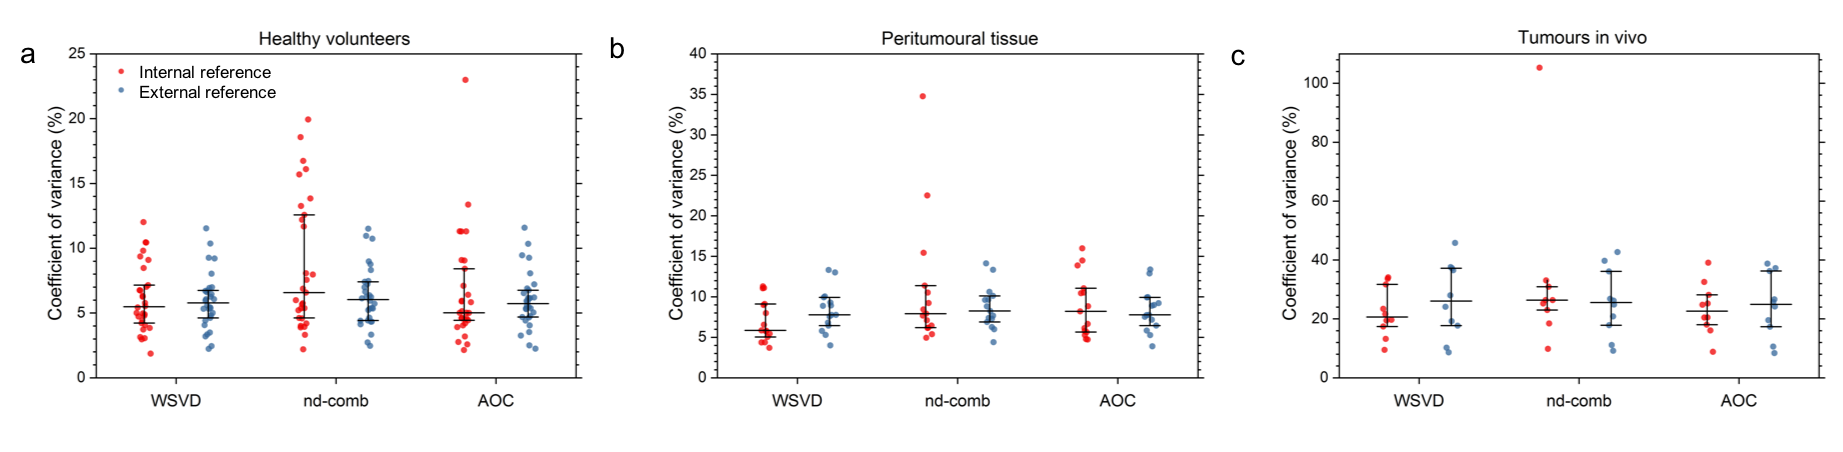
WSVDi yielded comparable SNR to algorithms with external reference (WSVDe, AOCe, nd-combe) and higher SNR than AOCi and nd-combi in volunteers, peritumoural adipose tissue and tumours in vivo (Table 1, Figure 1). WSVDi had low non-uniformity of 5.4% in volunteers, 5.8% in peritumoural tissue, and 20.7% in tumours (Figure 2). WSVDi improved the SNR by 41.9 ± 31.7% in volunteers, 44.3 ± 38.2 % in peritumoural tissue and 18.4% (9.4-44.5%) in tumours, in comparison to Signal Weighting algorithm (internal reference), enabling the acquisition shorter than 11 min instead of 17 min with the additional acceleration from the removal of reference acquisition.Discussion
WSVDi provided maximal SNR in patients with low non-uniformity. Furthermore, WSVDi utilises the lipid composition spectrum as a reference, eliminating the need of additional acquisition of external reference spectrum, typically 2 min including scanner preparation time and data processing time.Conclusion
WSVDi, is the optimal approach for processing lipid composition spectra acquired using 2D MRS on phased array coils from the breast. WSVDi not only provides maximal SNR improvement without the need of additional reference spectra, but also delivers consistent improvement across lipids with high uniformity. With improved SNR, high sensitivity is maintained at a reduced acquisition time, a step change on the routine clinical assessment of lipid composition.Acknowledgements
The author would like to thank Dr Matthew Clemence (Philips Healthcare Clinical Science, UK) for clinical scientist support, Ms Bolanle Brikinns, Ms Louisa Pirie, Ms Linda Lett, and Ms Kate Shaw for patient recruitment support, Ms Dawn Younie for logistic support, Mr Roger Bourne and Ms Mairi Fuller for providing access to the patients as well as Mrs Beverly MacLennan, Mrs Nichola Crouch, Mr Mike Hendry, and Ms Laura Reid for radiographer support.References
1. Schmitz, J. E., Kettunen, M. I., Hu, D.-E. & Brindle, K. M. 1H MRS-visible lipids accumulate during apoptosis of lymphoma cells in vitro and in vivo. Magn. Reson. Med.54,43–50 (2005).
2. He, Q. et al.In vivo MR spectroscopic imaging of polyunsaturated fatty acids (PUFA) in healthy and cancerous breast tissues by selective multiple-quantum coherence transfer (Sel-MQC): A preliminary study. Magn. Reson. Med.58,1079–1085 (2007).
3. Hartz, J. W., Morton, R. E., Waite, M. M. & Morris, H. P. Correlation of fatty acyl composition of mitochondrial and microsomal phospholipid with growth rate of rat hepatomas. Lab. Invest.46,73–78 (1982).
4. Roemer, P. B., Edelstein, W. A., Hayes, C. E., Souza, S. P. & Mueller, O. M. The NMR phased array. Magn. Reson. Med.16,192–225 (1990).
5. Hall, E. L., Stephenson, M. C., Price, D. & Morris, P. G. Methodology for improved detection of low concentration metabolites in MRS: Optimised combination of signals from multi-element coil arrays. NeuroImage86,35–42 (2014).
6. Fang, L., Wu, M., Ke, H., Kumar, A. & Yang, S. Adaptively optimized combination (AOC) of magnetic resonance spectroscopy data from phased array coils. Magn. Reson. Med.75,2235–2244 (2015).
7. Martini, N. et al.Noise correlations and SNR in phased-array MRS. NMR Biomed.23,66–73 (2010).
8. Rodgers, C. T. & Robson, M. D. Receive array magnetic resonance spectroscopy: Whitened singular value decomposition (WSVD) gives optimal Bayesian solution. Magn. Reson. Med.63,881–891 (2010).
9. Vanhamme, L., van den Boogaart A & Van Huffel S. Improved method for accurate and efficient quantification of MRS data with use of prior knowledge. J. Magn. Reson.129,35–43 (1997).
10. Naressi, A. Java-based graphical user interface for the MRUI quantitation package. Magnetic Resonance Materials in Biology, Physics, and Medicine12,141–152 (2001).
Figures