2866
Metabolite-cycled echo-planar spectroscopic imaging of the human heart1Institute for Biomedical Engineering, University and ETH Zurich, Zurich, Switzerland
Synopsis
Cardiac triglyceride levels can be assessed using proton MR spectroscopy. While metabolite cycling has already been applied to cardiac proton MRS, the combination of metabolite cycling and spectroscopic imaging for cardiac applications remains to be demonstrated. In this work metabolite-cycled echo-planar spectroscopic imaging is proposed to asses triglyceride-to-water (TG/W) ratios in different regions of the human heart. Results were compared to conventional single-voxel measurements in the interventricular septum. Although SNR is limited for metabolite-cycled EPSI, the method allows for detection of regional TG/W and therefore holds promise to provide insights into regional TG variations.
Introduction
Proton MR spectroscopy has been shown to be a valuable tool to study cardiac triglyceride (TG) levels1. While single voxel spectroscopy only provides information from a single volume of the interventricular septum, spectroscopic imaging could provide insights into regional TG variations, as it is required in e.g. myocardial ischemia, infarction and other heterogenous cardiac diseases. In contrast to conventional water-suppressed spectroscopic approaches, metabolite cycling2 allows to perform phase and frequency correction on the high-SNR water signal, which can be especially beneficial in small voxels3.The aim of the present work was to implement and compare metabolite-cycled echo-planar spectroscopic imaging (EPSI) relative to single voxel measurements for assessing triglyceride-to-water (TG/W) ratios in the human heart.
Methods
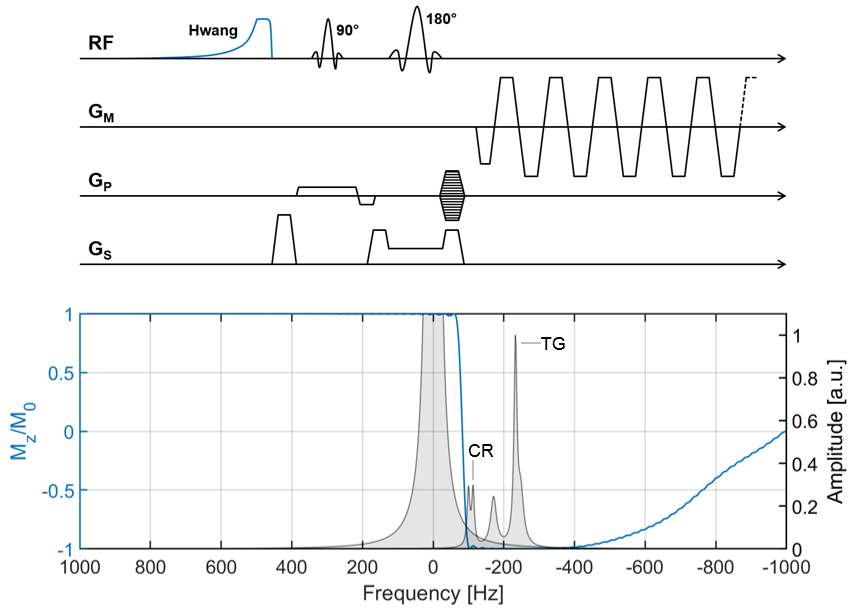
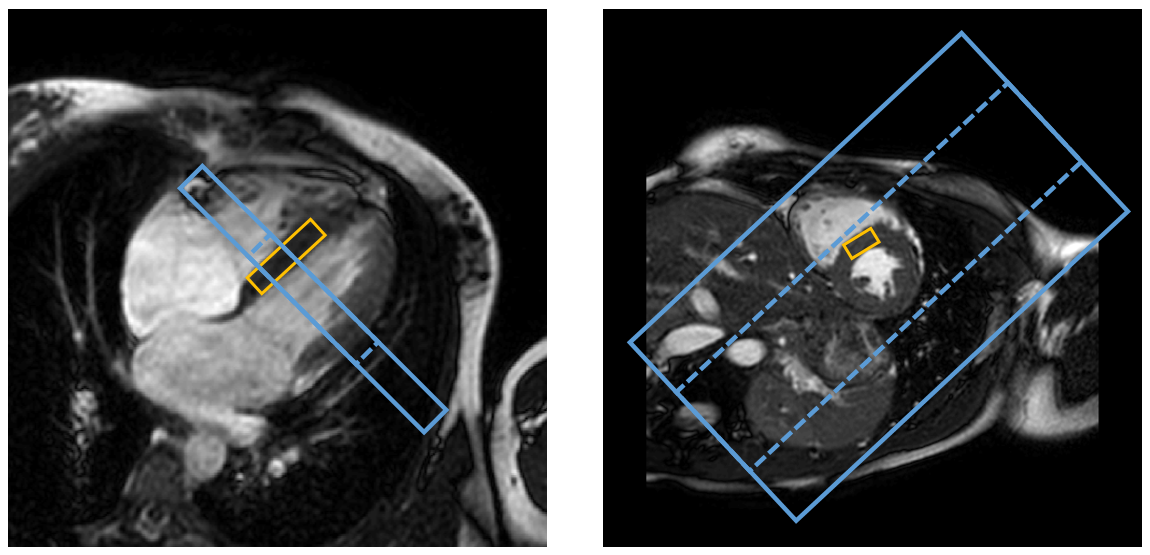
Measurements were performed on 5 volunteers (age = 25.6 ± 6.0 years; 3 male) using a 1.5T Achieva scanner (Philips Healthcare, Best, the Netherlands) with a 5-channel cardiac receiver array. Metabolite cycling was implemented by adding an optimized Hwang pulse4–6 in front of a local-look EPSI sequence7 (Figure 1). Frequency modulation and -offset of the Hwang pulse were inverted for half of the total number of averages acquired per scan. Data was acquired in an equatorial slice in short-axis view (Figure 2). Parameters for EPSI were as follows: NSA = 8, FOV = 300×150 mm2, voxel size = 3×3×15 mm3, TR = 1 heartbeat, TE = 12 ms, spectral BW = 1064 Hz, spectral resolution = 4.2 Hz.For comparison, single voxel spectra were acquired in the interventricular septum (Figure 2) using a PRESS sequence with reduced spoiler areas8 and the following sequence parameters: NSA = 96 (water-suppressed) + 16 (water), voxel size = 10×20×40 mm3, TR = 2 s, TE = 22 ms and CHESS based water suppression (BW = 100 Hz). Both EPSI and PRESS measurements were ECG-triggered to end systole and a navigator positioned on the liver was employed for respiratory gating (window = 4 mm).
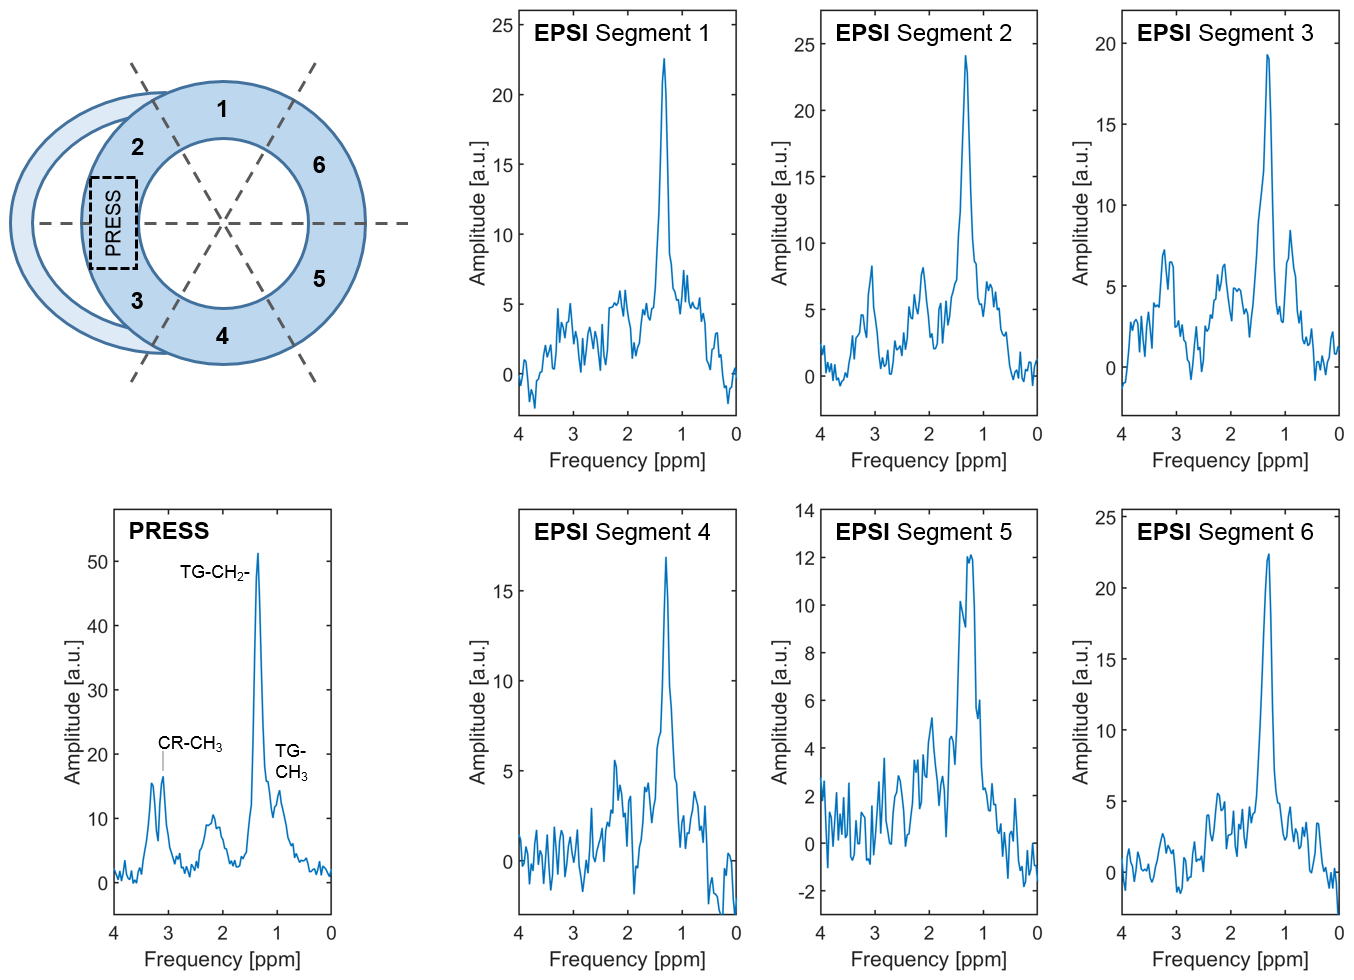
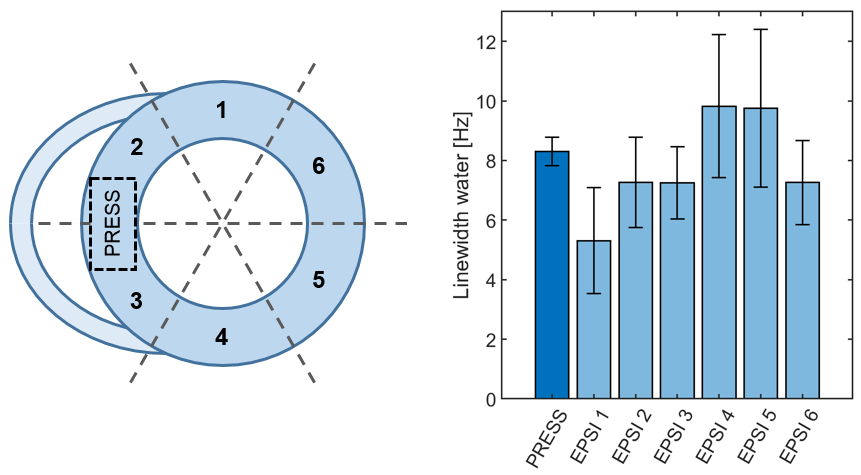
EPSI data was reconstructed in Matlab (Mathworks, Natick, MA) using a customized reconstruction pipeline. Complex coil maps were calculated for coil combination and spectral ghosts caused by delays between even and odd readout gradients were minimized. B0 correction was performed for every voxel in every single average individually; the position of the water peak was detected and accordingly shifted in the frequency domain. A Hamming filter was applied to the k-space data in the spatial dimensions to reduce side lobes of the point spread function. Phase correction was applied on the water peak of every voxel in every single average; upfield- and downfield-cycled averages were averaged separately subsequently. Water spectra were calculated by addition of the mean upfield- and downfield-cycled spectra; subtraction was performed to obtain metabolites. For analysis, the heart was divided into six segments (Figure 3). Care was taken not to include epicardial fat when drawing the epicardial contours. Finally, all spectra within each of the segments were averaged.
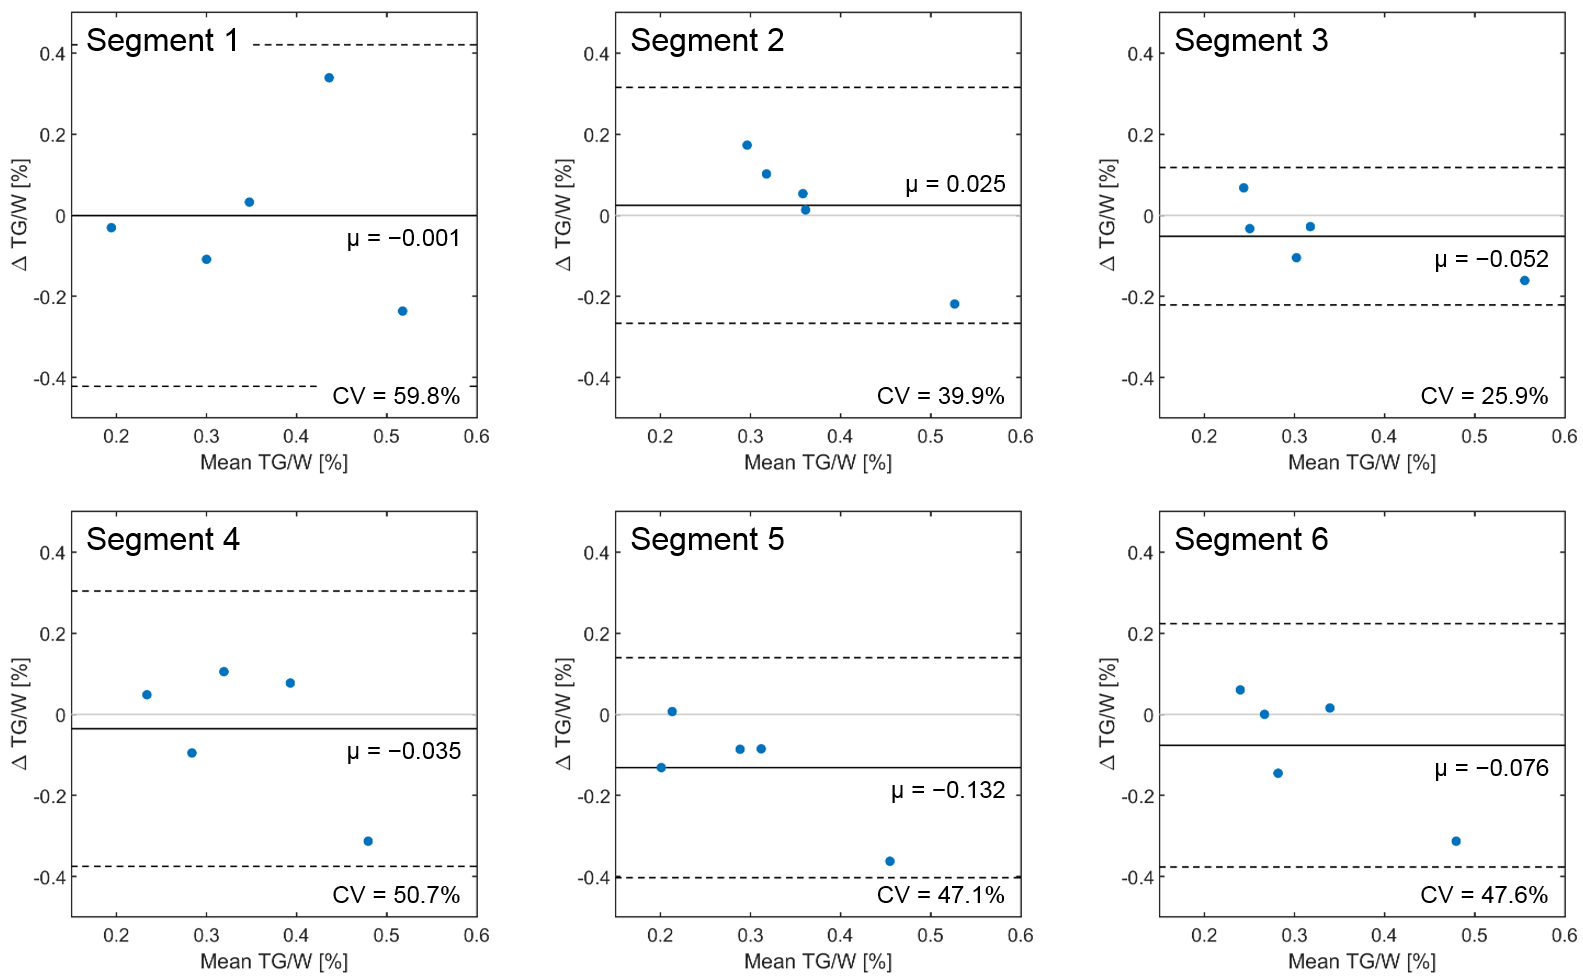
PRESS data was reconstructed as described in (6). Both EPSI and PRESS spectra were fitted in the time-domain using AMARES (jMRUI)9 assuming Lorentzian line shapes. TG/W ratios were calculated and T1 and T2 correction applied. Bland-Altman analyses were performed for comparison of EPSI and PRESS.
Results
Exemplary spectra of all six EPSI segments together with a PRESS spectrum for comparison are shown in Figure 3. Although SNR is significantly lower for EPSI compared to PRESS, myocardial TG can be detected in all EPSI regions. Data quality is best in segments 2 and 3 given the proximity of these sectors to the surface coil array. Segments 4 and 5 suffer from reduced coil sensitivity and increased field inhomogeneity due to the presence of the posterior vein of the left ventricle. Bland-Altman analyses of TG/W ratios are shown in Figure 4 comparing individual EPSI segments to PRESS data. The coefficient of variation was found to be smallest for segments 2 and 3. Figure 5 shows mean and standard deviation for the linewidth of the water peak for all EPSI segments and PRESS.Discussion
Metabolite-cycled EPSI has a number of advantages over water-suppressed EPSI7. Total scan time is shorter as no additional reference scan is required. In water-suppressed EPSI a B0-map is calculated based on the reference water scan and a B0 correction based on this map is applied to all water-suppressed averages. Using metabolite-cycled EPSI, the B0 shift can be calculated for every single average individually, which leads to improved B0 correction. Finally, phasing in metabolite-cycled EPSI can be performed on the high-SNR water signal as opposed to the low-SNR TG signal in water-suppressed EPSI. Limitations of metabolite-cycled EPSI include potential contamination of target segments from adjacent epicardial fat. Accordingly, segments were chosen carefully to avoid tissue interfaces and partial volume voxels as confirmed by Bland-Altman analyses which did not show an overestimation of TG/W for any of the EPSI segments.While these preliminary results show that TG/W can be detected using metabolite-cycled EPSI, SNR remains limited in order to reliably assign resonances other than TG. To this end, assignment of creatine was not possible in all segments.
Conclusion
Metabolite-cycled echo-planar spectroscopic imaging allows detecting triglyceride-to-water ratios in different regions of the in-vivo human heart.Acknowledgements
No acknowledgement found.References
1. Bottomley PA, Weiss RG. Non-invasive magnetic-resonance detection of creatine depletion in non-viable infarcted myocardium. Lancet 1998;351:714–718.
2. Dreher W, Leibfritz D. New method for the simultaneous detection of metabolites and water in localized in vivo 1H nuclear magnetic resonance spectroscopy. Magn. Reson. Med. 2005;54:190–5.
3. Fillmer A, Hock A, Cameron D, Henning A. Non-water-suppressed 1H MR spectroscopy with orientational prior knowledge shows potential for separating intra- and extramyocellular lipid signals in human myocardium. Sci. Rep. 2017;7:16898.
4. Hwang T-L, van Zijl PCM, Garwood M. Asymmetric adiabatic pulses for NH selection. J. Magn. Reson. 1999;138:173–177.
5. MacMillan EL, Chong DGQ, Dreher W, Henning A, Boesch C, Kreis R. Magnetization exchange with water and T1 relaxation of the downfield resonances in human brain spectra at 3.0 T. Magn. Reson. Med. 2011;65:1239–1246.
6. Peereboom SM, Gastl M, Fuetterer M, Kozerke S. Navigator‐free metabolite‐cycled proton spectroscopy of the heart. Magn. Reson. Med. 2019;00:1–11.
7. Weiss K, Martini N, Boesiger P, Kozerke S. Metabolic MR imaging of regional triglyceride and creatine content in the human heart. Magn. Reson. Med. 2012;68:1696–1704.
8. Weiss K, Summermatter S, Stoeck CT, Kozerke S. Compensation of signal loss due to cardiac motion in point-resolved spectroscopy of the heart. Magn. Reson. Med. 2014;72:1201–1207.
9. Vanhamme L, van den Boogaart A, Van Huffel S. Improved method for accurate and efficient quantification of MRS data with use of prior knowledge. J. Magn. Reson. 1997;129:35–43.
Figures