2865
Radial Flyback Echo-Planar Spectroscopic Imaging with Golden Angle Sampling and Total Variation-based Compressed Sensing Reconstruction1Radiological Sciences, University of California, Los Angeles, Los Angeles, CA, United States
Synopsis
In this pilot study, we implement a radial echo-planar spectroscopic imaging (rEPSI) sequence and compare its performance to the Cartesian (EPSI) sequence under multiple rates of retrospective undersampling, for the case of 2D acquisitions in which a single phase-encoded direction is undersampled for EPSI, and a reduced number of radial profiles using golden angle view ordering are reconstructed for rEPSI. Fully sampled data from a healthy volunteer brain and from a brain phantom are acquired. The retrospectively undersampled data is reconstructed using compressed sensing with Total Variation regularization, and the performance of both methods are compared.
Introduction
Magnetic resonance spectroscopic imaging (MRSI) is a powerful tool for measuring biochemical concentrations and spatial distribution of various metabolites. However, long acquisitions times hinder the practical use of conventional MRSI techniques. Echo-planar trajectories, in which one spatial and one spectral dimension are sampled simultaneously, have been implemented to reduce acquisition time by an order of magnitude1.Other echo-planar-based approaches utilizing non-Cartesian sampling, such as concentric circular rings, rosettes, and spirals, have also been applied for efficient and fast MRSI2,3,4. Recently, radial sampling techniques have gained more widespread use for MRI applications, due to their increased motion robustness, inherent SNR advantage, and potential for high acceleration5,6,7. In this pilot study, we implement a radial echo-planar spectroscopic imaging (rEPSI) sequence and compare its performance to the Cartesian (EPSI) sequence under multiple rates of retrospective undersampling, in the case of 2D acquisitions in which a single phase-encoded direction is undersampled for EPSI, and a reduced number of radial profiles from golden angle sampling8 is used for rEPSI. A flyback trajectory approach, as opposed to alternating bi-polar readout gradients, is implemented for both sequences due to its increased spectral width, simpler post-processing, less T2*-weighting, and relative insensitivity to timing errors9. Fully sampled data from a healthy volunteer brain and from a brain phantom are acquired. The 2D retrospectively undersampled data for both EPSI and rEPSI are reconstructed using compressed sensing with Total Variation regularization, and we compare the performance of both methods.Methods
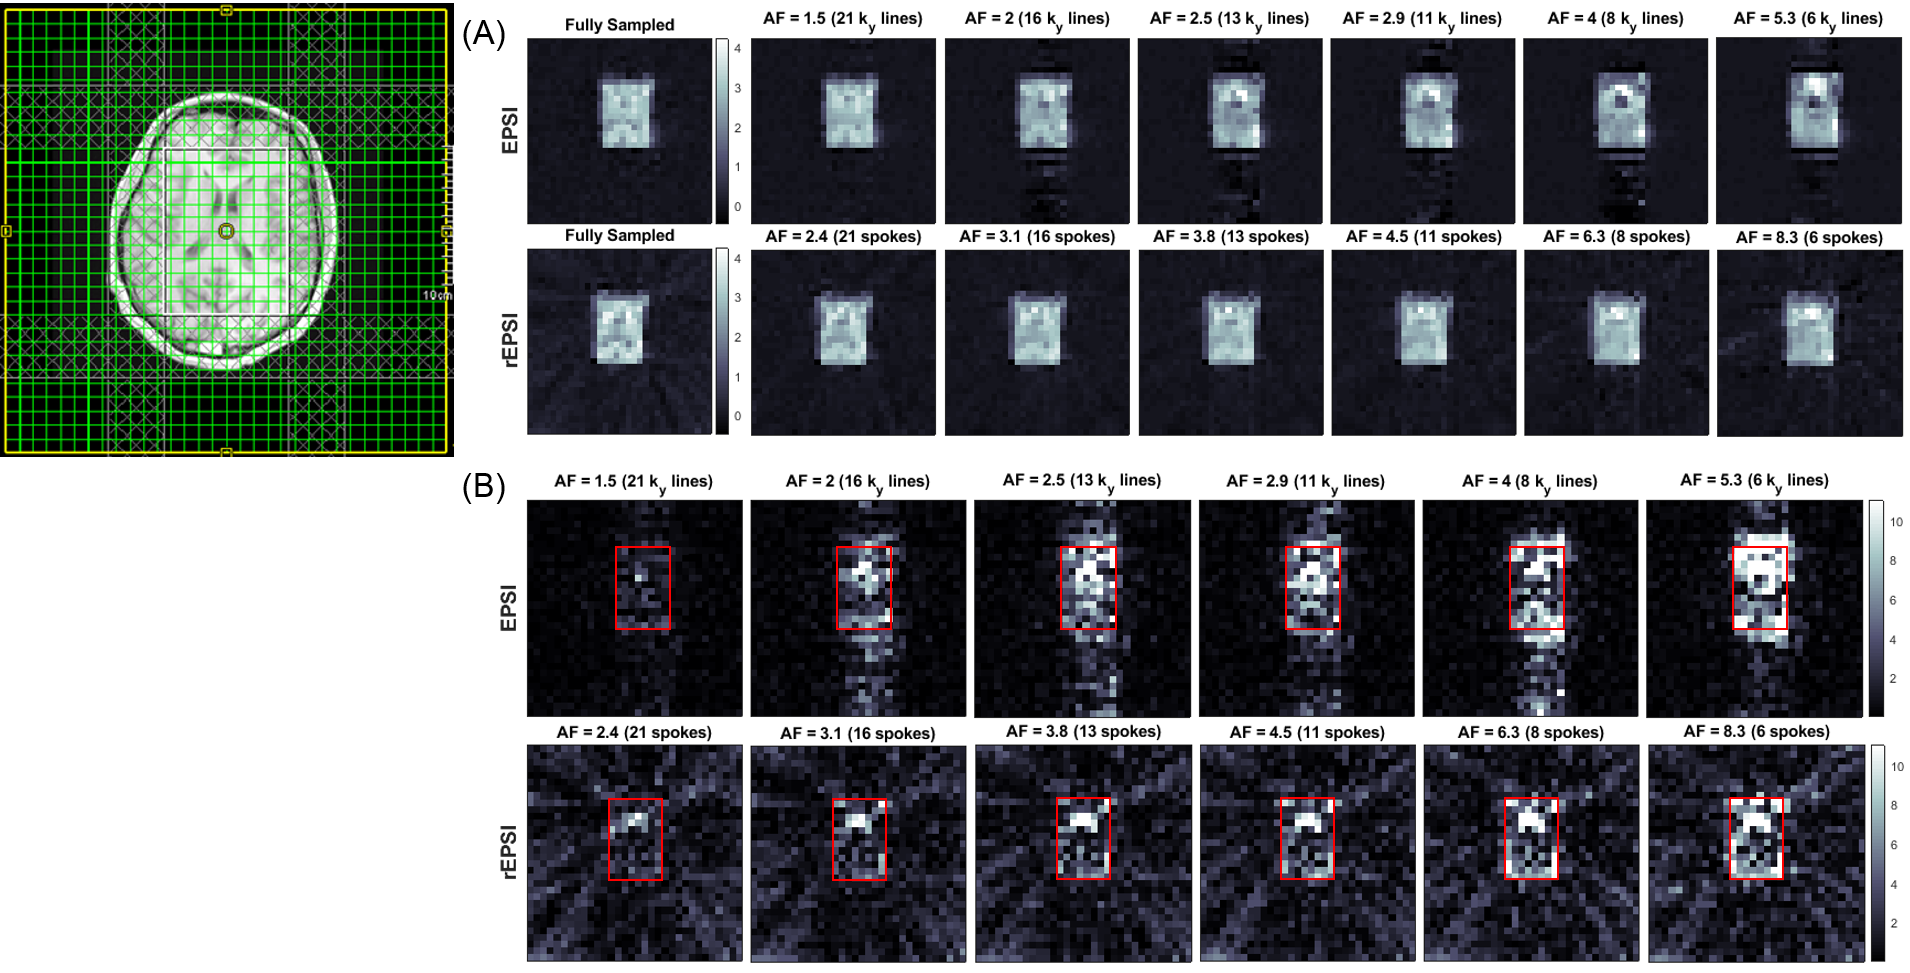
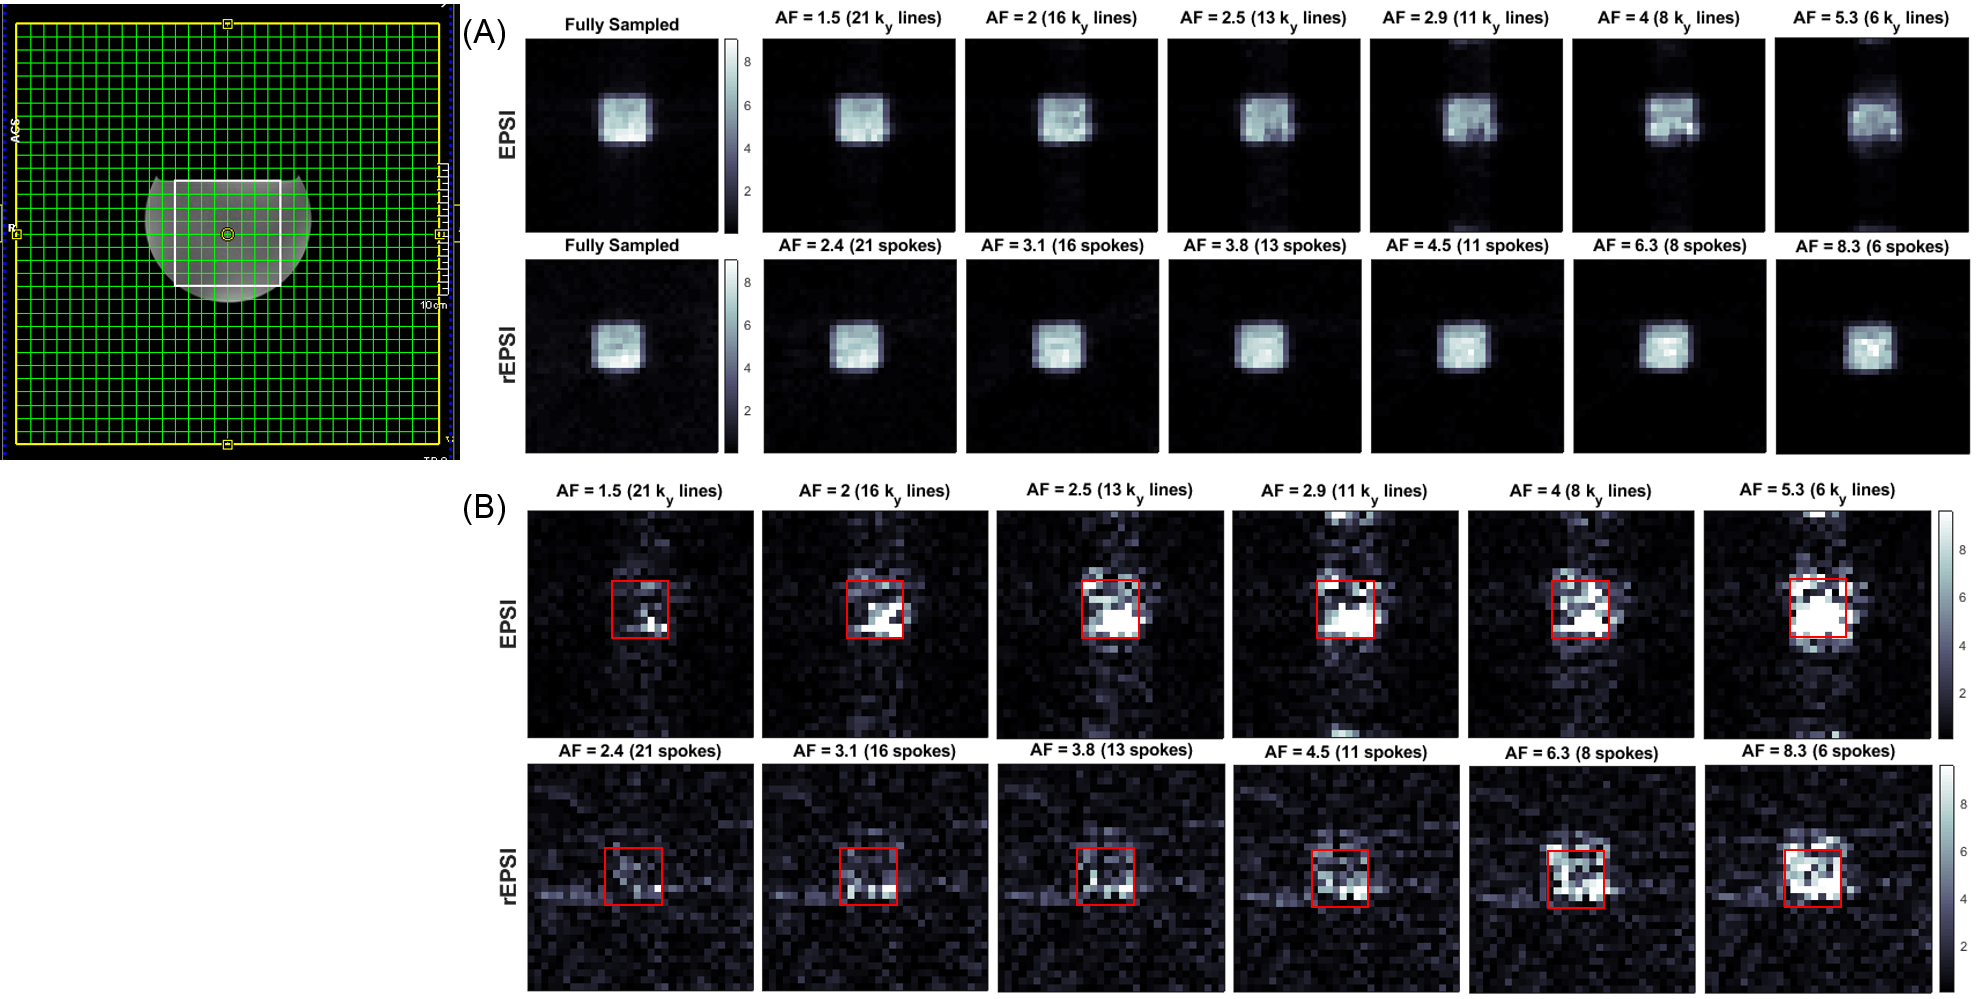
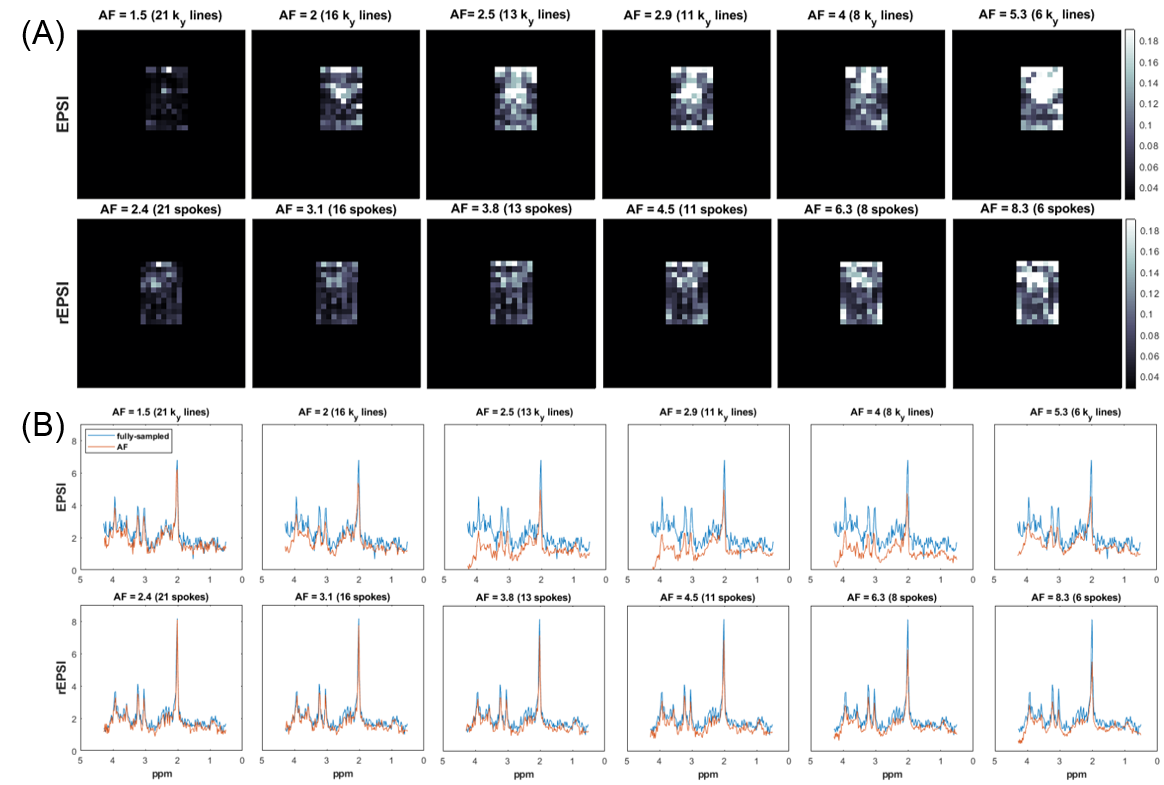
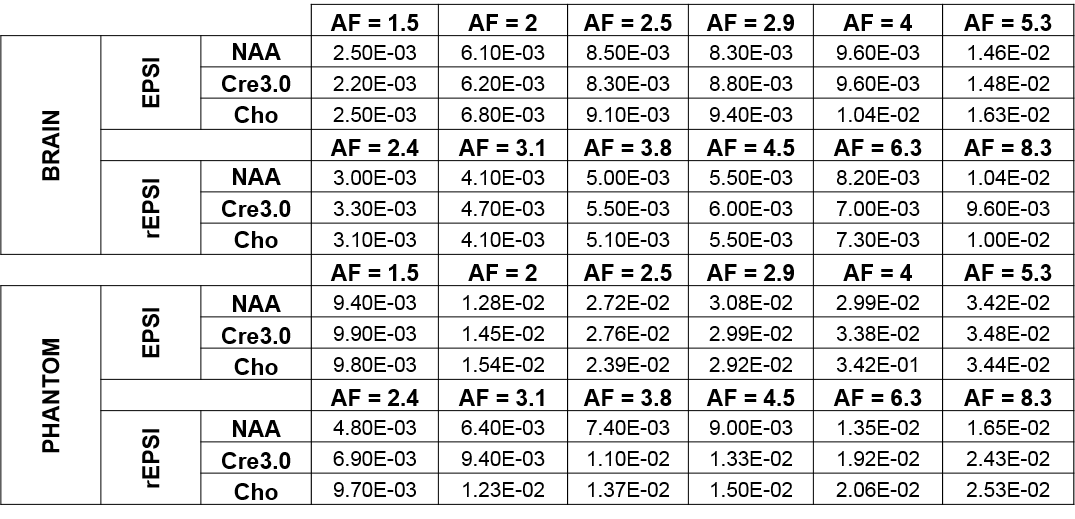
The flyback EPSI and rEPSI (Figure 1) sequences were implemented on a 3T clinical scanner. One healthy 26 year-old healthy volunteer was recruited with IRB approval for the acquisition of in vivo brain data. Data from a brain phantom containing metabolites at physiological concentrations was also acquired. Both data sets were acquired with a 32×32 matrix size, a 32×32×1.5 cm3 slab using volumetric semi-LASER localization, TE = 40 ms, TR = 1.5s, and a spectral width of 1351.35 Hz, with 512 t2 points. With 10 averages each, acquisition time for fully sampled water-suppressed data totaled 6.5 minutes for EPSI (32 ky phase-encoding steps) and 10 minutes for rEPSI (50 radial spokes). A separate water scan was also acquired for eddy-current phase correction. The radial spokes were acquired and undersampled using a golden-angle view ordering scheme. For EPSI undersampling masks in the ky direction were implemented using a Gaussian probability distribution with a fully-sampled central region of 4 ky lines. Acceleration factors (AF) for EPSI were 1.5, 2.0, 2.5, 2.9, 4, and 5.3, corresponding to 21, 16, 13, 11, 8, and 6 ky phase-encodes, respectively. For rEPSI, AF = 2.4, 3.1. 3.8, 4.5, 6.25, and 8.3, corresponding to 21, 16, 13, 11, 8, and 6 radial spokes, so that EPSI and rEPSI were compared on a time-equivalent basis, although higher AF’s are technically feasible for rEPSI. Total Variation (TV)-based compressed sensing reconstructed was implemented using the MFISTA10 framework to solve the following minimization problem: $$ \min_{u} \frac{1}{2} \| Fu - y \|_2^{2} + \lambda TV(u) $$where F is the Fourier transform, or non-uniform Fourier transform11 (NUFFT) for radial data, u is the spatial-spectral data, y is the undersampled data, and λ is a regularization parameter empirically chosen as 𝜎 · 10-1, where 𝜎 is an estimate of the noise standard deviation. Coil-by-coil reconstruction was performed with 80 outer iterations and 20 inner iterations of the TV proximal mapping. The fully-sampled and reconstructed data was used to compute spectral normalized root mean square error (nRMSE) maps, absolute difference images, and metabolite maps of N-acetylaspartate (NAA), Creatine 3.0 (Cre 3.0), and Choline (Cho), as a function of increasing acceleration factor.
Results
The NAA metabolite maps in Figure 2 and Figure 3 show that radial sampling results in greater reconstruction accuracy and is more robust to increasing undersampling rates. Even at a high acceleration of 8.3, rEPSI still outperforms EPSI in terms of the fidelity of the reconstructed map. The absolute difference maps of NAA display reduced differences within the VOI for rEPSI compared to EPSI. Reconstructed spectra from rEPSI also appear more consistent with the fully-sampled spectra (Figure 4), whereas spectra reconstructed from EPSI data loses SNR at a greater rate than those from the radially sampled data, in agreement with earlier results in radial MRI. In terms of imaging fidelity, the nRMSE of the NAA, Creatine 3.0, and Choline maps are lower than those from the EPSI acquisition (Table 5), particularly at high undersampling rates.Discussion and Conclusion
Radial EPSI is shown to be more robust to acceleration for undersampled 2D spatial acquisitions. For MRSI applications, in which the resolutions are relatively low, radial acquisitions can provide a good trade-off between acquisition speed and spectroscopic image quality. While 2D Cartesian EPSI undersampling is limited to one phase-encoding dimension, rEPSI offers greater flexibility by allowing undersampling across the entire k-space plane, while still preserving spectral and imaging quality. Streaking artifacts can be a limitation in rEPSI, but this is true outside the region of interest only, and this effect can be further reduced through more optimized reconstruction schemes. Furthermore, golden angle view ordering offers a further potential for motion-robust and temporally resolved spectroscopic imaging.Acknowledgements
Authors acknowledge grant support from DoD CDMRP Breakthrough I Award #W81XWH-16-1-0524.References
[1] Posse, S., et al., High speed 1H spectroscopic imaging in human brain by echo planar spatial-spectral encoding. Magnetic Resonance in Medicine. 1995; 33(1): 34-40.
[2] Furuyama, J.K., et al. Spectroscopic imaging using concentrically circular echo-planar trajectories in vivo. Magnetic Resonance in Medicine. 2012; 67(6): 1515-1522.
[3] Schirda, C.V., et al. Rosette spectroscopic imaging: optimal parameters for alias-free, high-sensitivity spectroscopic imaging. Journal of Magnetic Resonance Imaging. 2009; 29(6): 1375-1385.
[4] Adalsteinsson, E., et al. Volumetric spectroscopic imaging with spiral-based k-space trajectories. Magnetic Resonance in Medicine. 1998; 889-898.
[5] Ramirez, M.S., et al. Radial spectroscopic MRI of hyperpolarized [1-13C] pyruvate at 7T. Magnetic Resonance in Medicine. 2014; 72(4): 986-995.
[6] Block, K.T., et al. Undersampled radial MRI with multiple coils. Iterative reconstruction using a total variation constraint. Magnetic Resonance in Medicine. 2007; 57(6): 1086 – 1098.
[7]. Feng, L., et al. Golden-angle radial sparse parallel MRI: combination of compressed sensing, parallel imaging, and golden-angle radial sampling for fast and flexible dynamic volumetric MRI. Magnetic Resonance in Medicine. 2014; 72(3):707-717.
[8] Winkelmann, S., et al. An optimal radial profile order based on the Golden Ratio for time-resolved MRI. IEEE Transactions on Medical Imaging. 2006; 26(1): 68-76.
[9] Cunningham, C.H., et al. Design of flyback echo-planar readout gradients for magnetic resonance spectroscopic imaging. Magnetic Resonance in Medicine. 2005; 54(5): 1286 – 1289.
[10] Beck, A. and Teboulle, M. Fast gradient-based algorithms for contrained total variation image denoising and deblurring problems. IEEE Transactions on Image Processing. 2009; 18(11): 2419 – 2434.
[11] Fessler, J.A. and Sutton, B.P. Nonuniform fast Fourier transforms using min-max interpolation. IEEE Transactions on Signal Processing. 2003; 51(2): 560-574.
Figures