2862
Semi-LASER single-voxel spectroscopic sequence with minimal echo time of 20.1 ms: Application in the human brain at 3T1Biomedical Engineering, Columbia University, New York, NY, United States, 2Radiology, Columbia University, New York, NY, United States
Synopsis
The aim of this work was to develop an optimized sLASER sequence which is capable of acquiring artefact-free data with an echo time as short as 20.1 ms on a whole-body clinical 3 T MR system. This was achieved through the use of specialized pulses and optimizing the crusher scheme and phase cycling schemes. High quality spectra were obtained and quantified in 6 healthy volunteers, both in the prefrontal and the occipital cortex.
Introduction
Spatial localization in magnetic resonance spectroscopy (MRS) experiments results in a non-zero echo time (TE). Minimizing the TE is appealing as a zero TE spectrum has all metabolites in phase, as well as increased signal-to-noise ratio due to lessened T2 relaxation. It was recently recommended to use the shortest TE achievable for general-purpose MRS[1], and semi-Localization by Adiabatic SElective Refocusing[2], [3] (sLASER) was suggested to be the sequence of choice for the optimal data quality. Despite its potential, there are illustrations of sLASER acquisitions which suffer from spurious echoes[3]–[5]. Methods have been developed to alleviate these spurious echoes[6], [7], however the necessary duration of the crushers has not been investigated (hence minimizing the TE) regarding the manifestation of spurious echoes. The purpose of this work is to develop an optimized sLASER sequence with the shortest echo time demonstrated to date, TE = 20.1 ms, on a clinical 3T MR system providing spectra without obvious spurious echoes.Methods
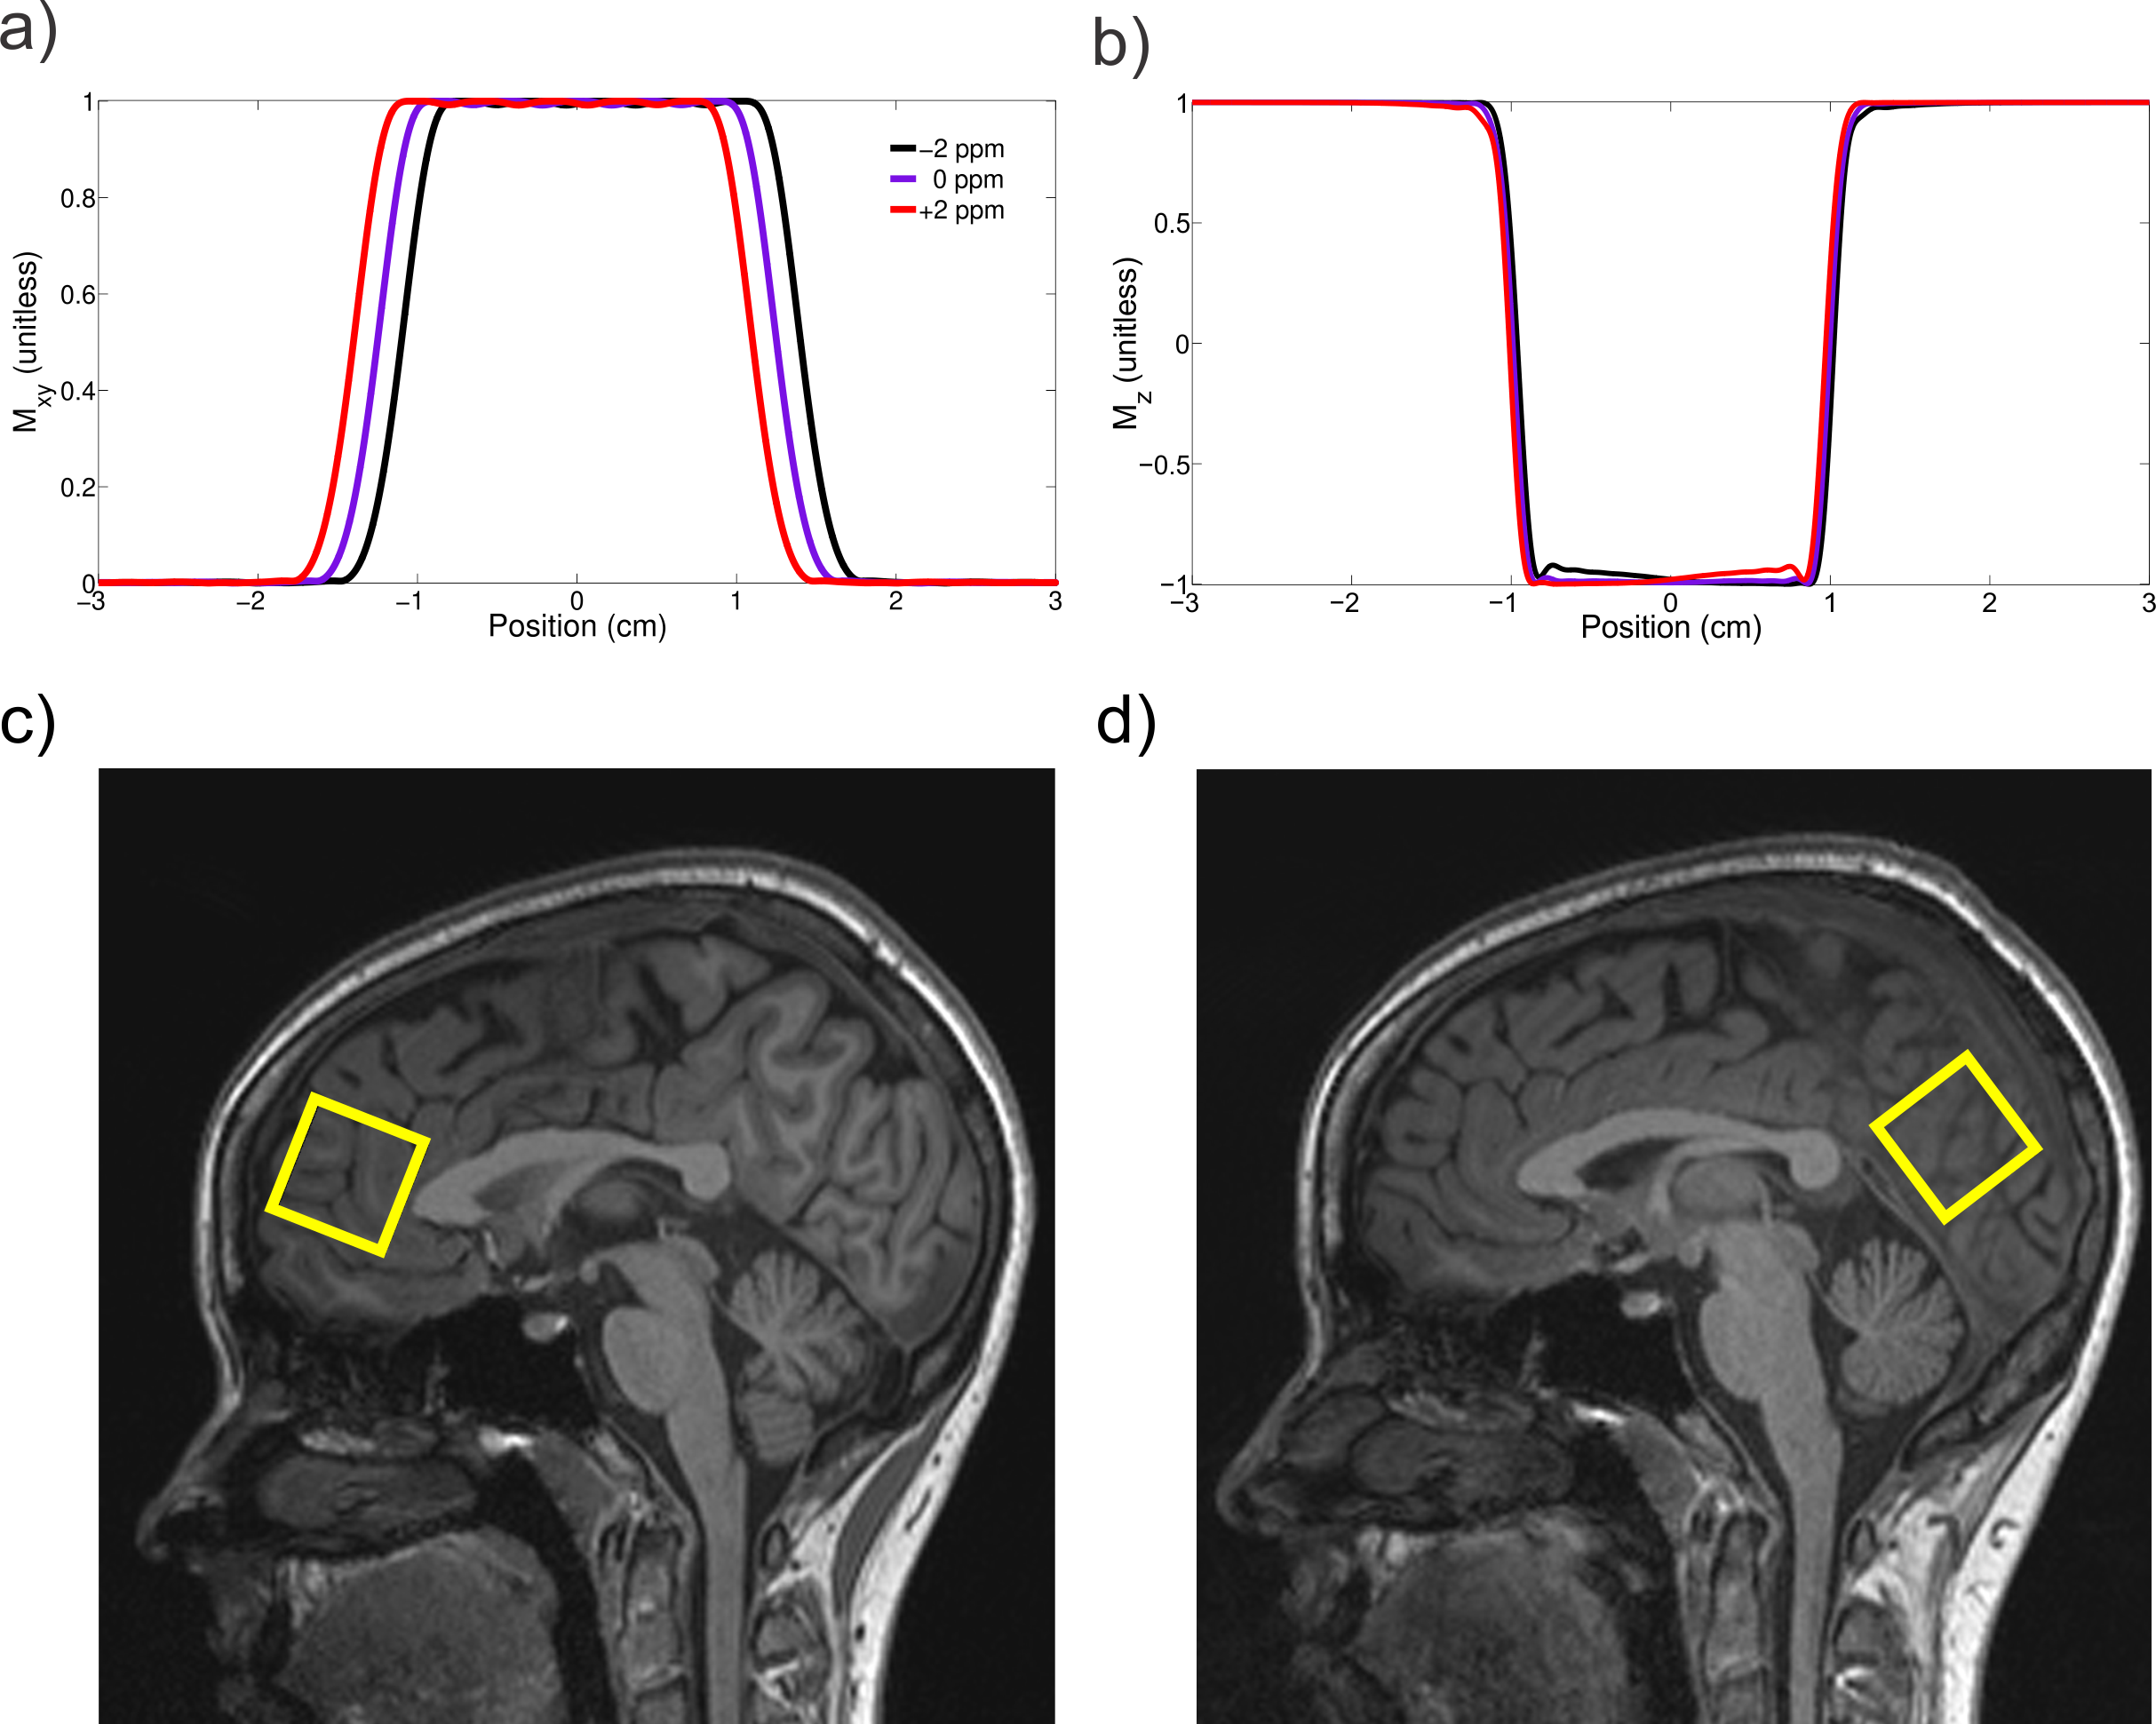
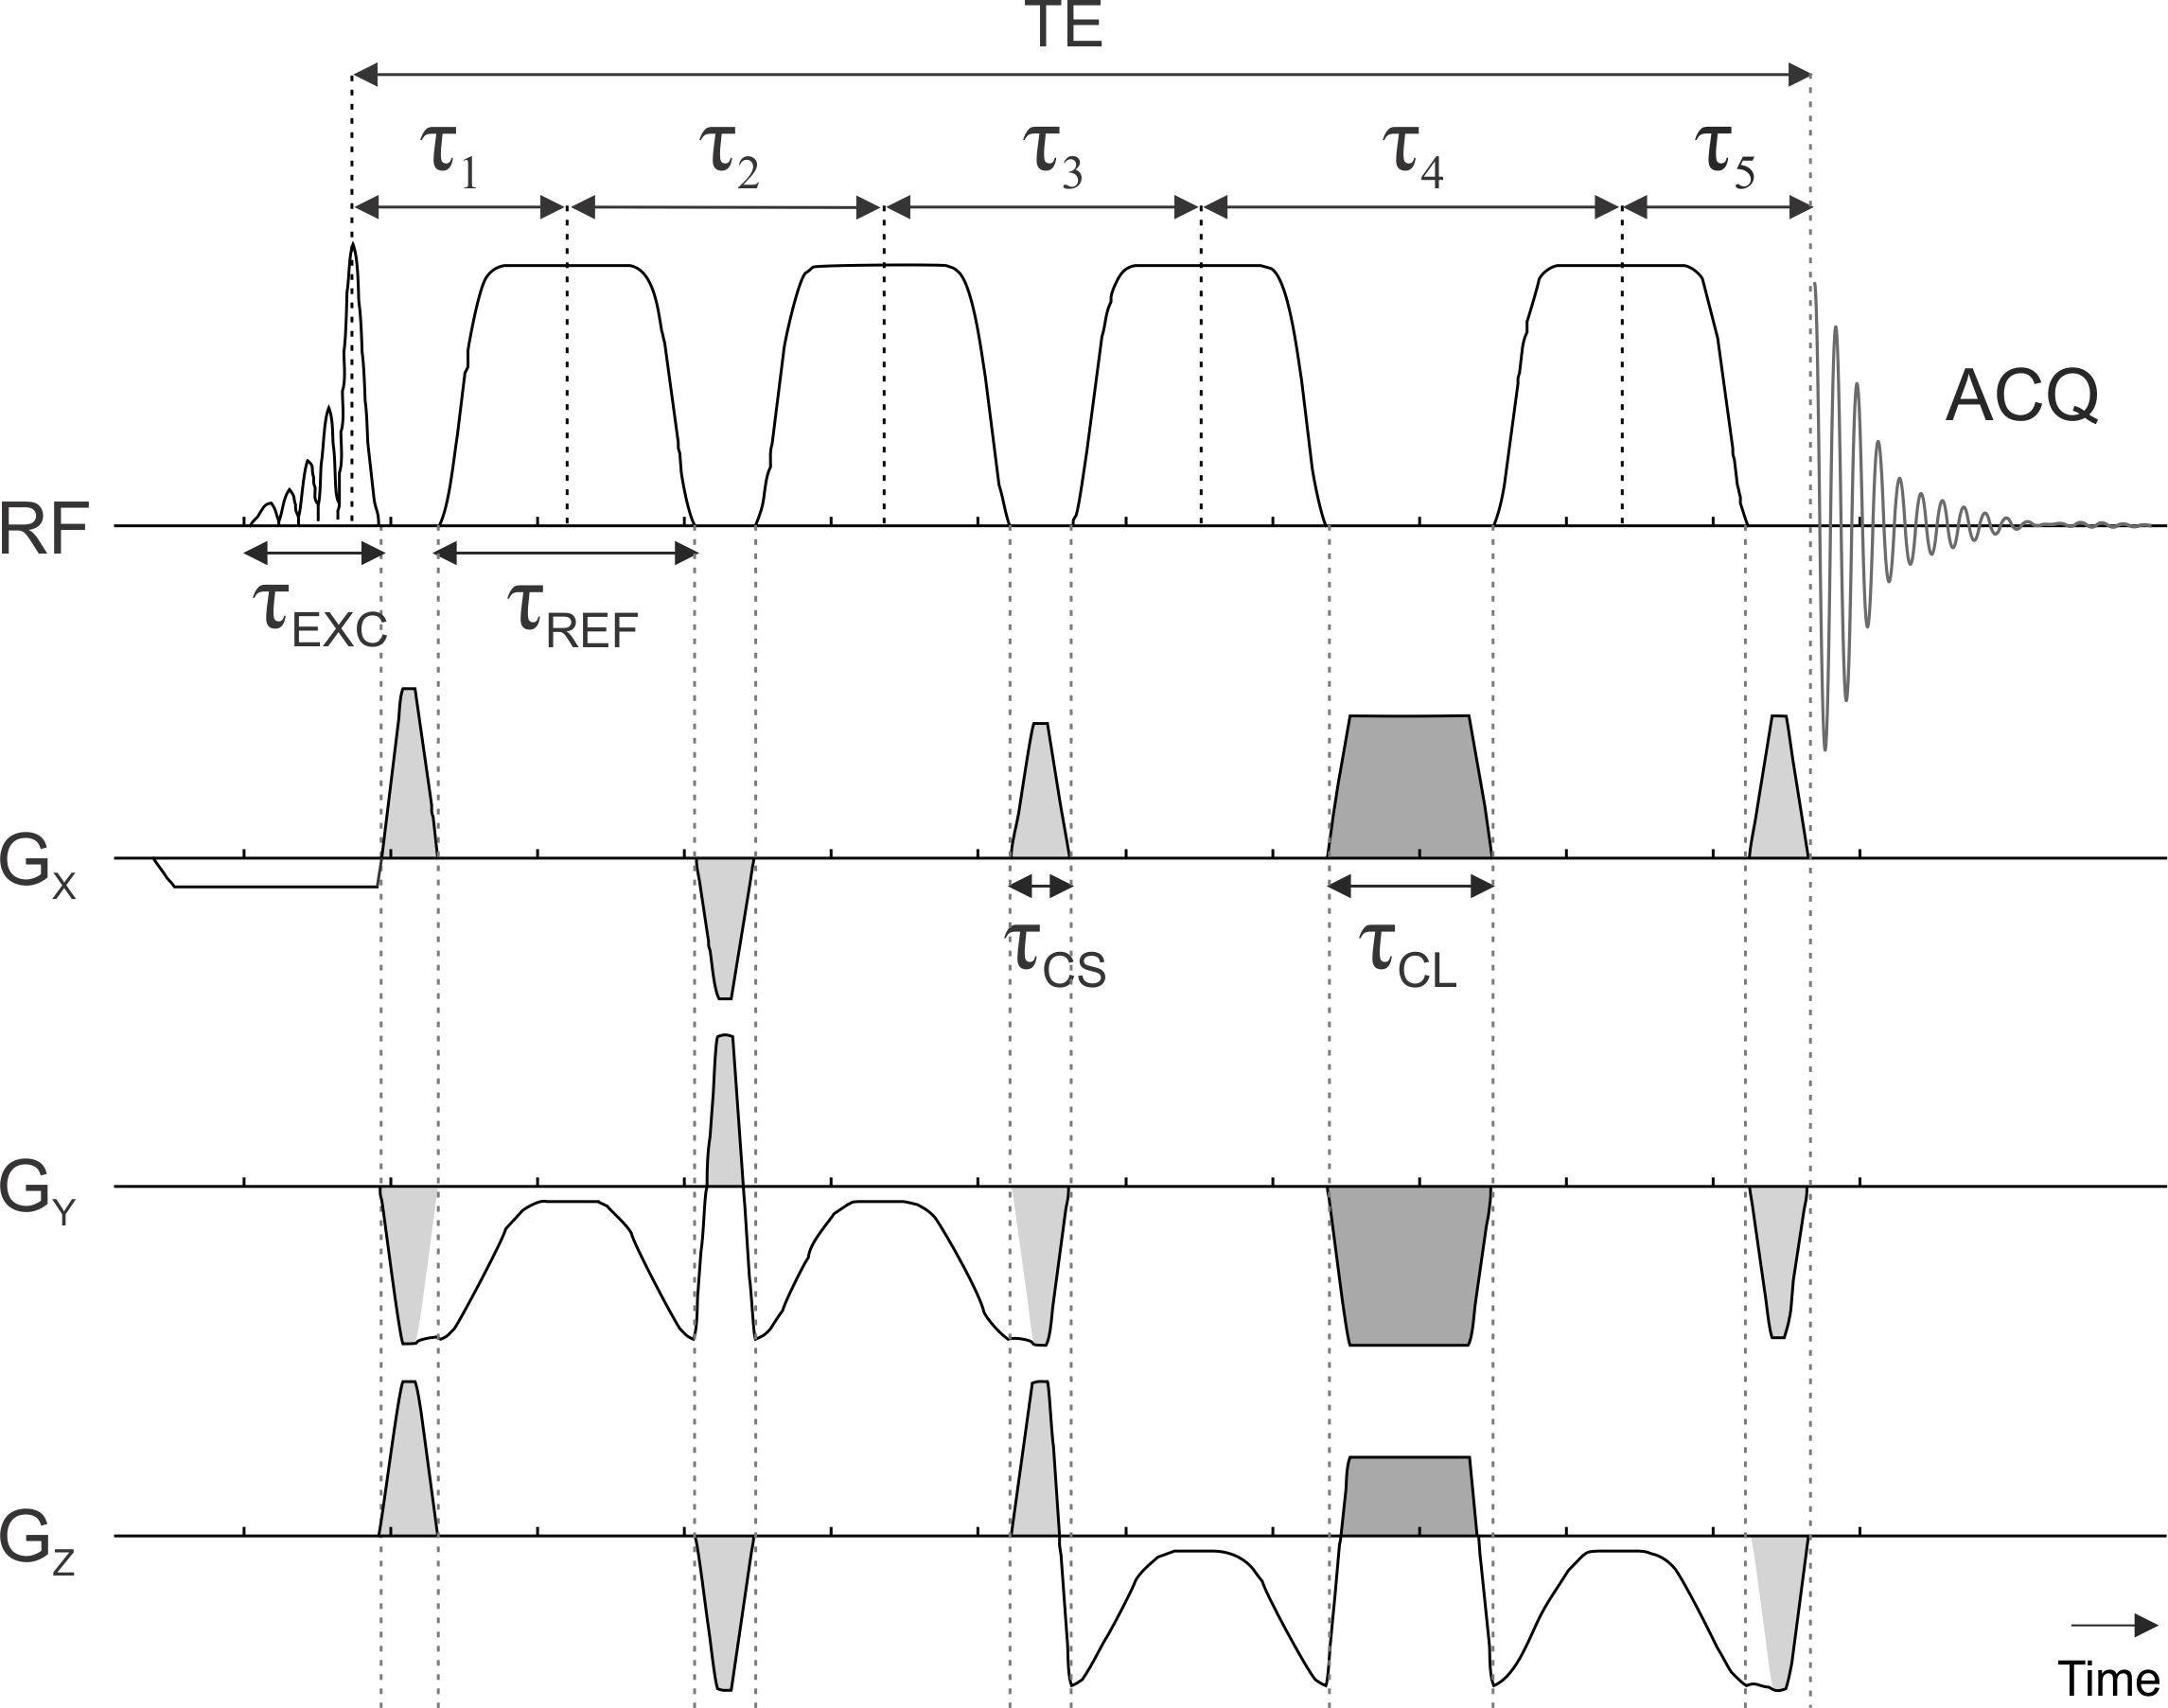
An sLASER sequence was developed for a Prisma 3T MR system (Siemens, Erlangen, Germany) that uses a minimum phase Shinnar-Le Roux[8], [9] excitation pulse with duration of 1.8 ms, 4.4 kHz bandwidth, asymmetry factor 0.22, and a maximum amplitude of 23.2 T (Figure 1 a). It has previously been demonstrated that gradient modulated constant adiabaticity[10] (GOIA) pulses provide the most precise spatial localization[11], as such refocusing pulses were chosen to be 3.5 ms duration 20 kHz bandwidth GOIA combination of WURST-16 for RF field and WURST-4 for the gradient modulation pulses, GOIA-W(16,4), (Figure 1 b) with a maximum amplitude of 21.4 T. All crushers had a plateau duration of 200 us, with a ramp time of 300 us and a maximum amplitude of 22 mT/m. The crusher scheme and 16-step cogwheel phase cycling scheme[12] were optimized using DOTCOPS software[6], [7] (Figure 2). Both excitation and refocusing pulses were centered at 3.0 ppm to minimize chemical shift displacement artefact. The VAPOR delays and flip angles were identical to its original implementation[13], and employed 10% cutoff Gaussian RF pulses with a duration of 17.9 ms. After each water suppression pulse a single gradient on each of the three spatial axes was played out with a duration of 10.0 ms, ramp time of 0.5 ms and maximum amplitude of 22 mT/m. The VAPOR crusher scheme was designed using a modified version of DOTCOPS[7] which optimally eliminated all coherence pathways. To quantify the water suppression efficiency the residual water amplitude was divided by that of the unsuppressed water[14].A total of 6 subjects were scanned (3 females) at Columbia’s Zuckerman Mind Brain Behavior Institute MR facility. All subjects provided free and informed consent and all studies were approved by the Institutional Review Board at Columbia University. Isotropic voxels of 16 mL were placed in the anterior cingulate cortex and in the occipital lobe (Figure 1 c, d). Optimal B0 1st and 2nd spherical harmonic shimming was performed with the in-house software B0DETOX[15]. Eddy current correction[16] and coil combination was applied using a water reference in INSPECTOR[17], [18]. Linear combination modeling quantification was performed with INSPECTOR using a basis set simulated with MARSS[19] that contained 17 typical metabolites and 11 macromolecule resonances. Absolute quantification was performed using water as an internal reference and Statistical Parameter Mapping[20] (SPM) to segment the anatomical images into gray matter, white matter and CSF. Corrections were made for the T1 and T2 of both metabolites and water.
Results and Discussion
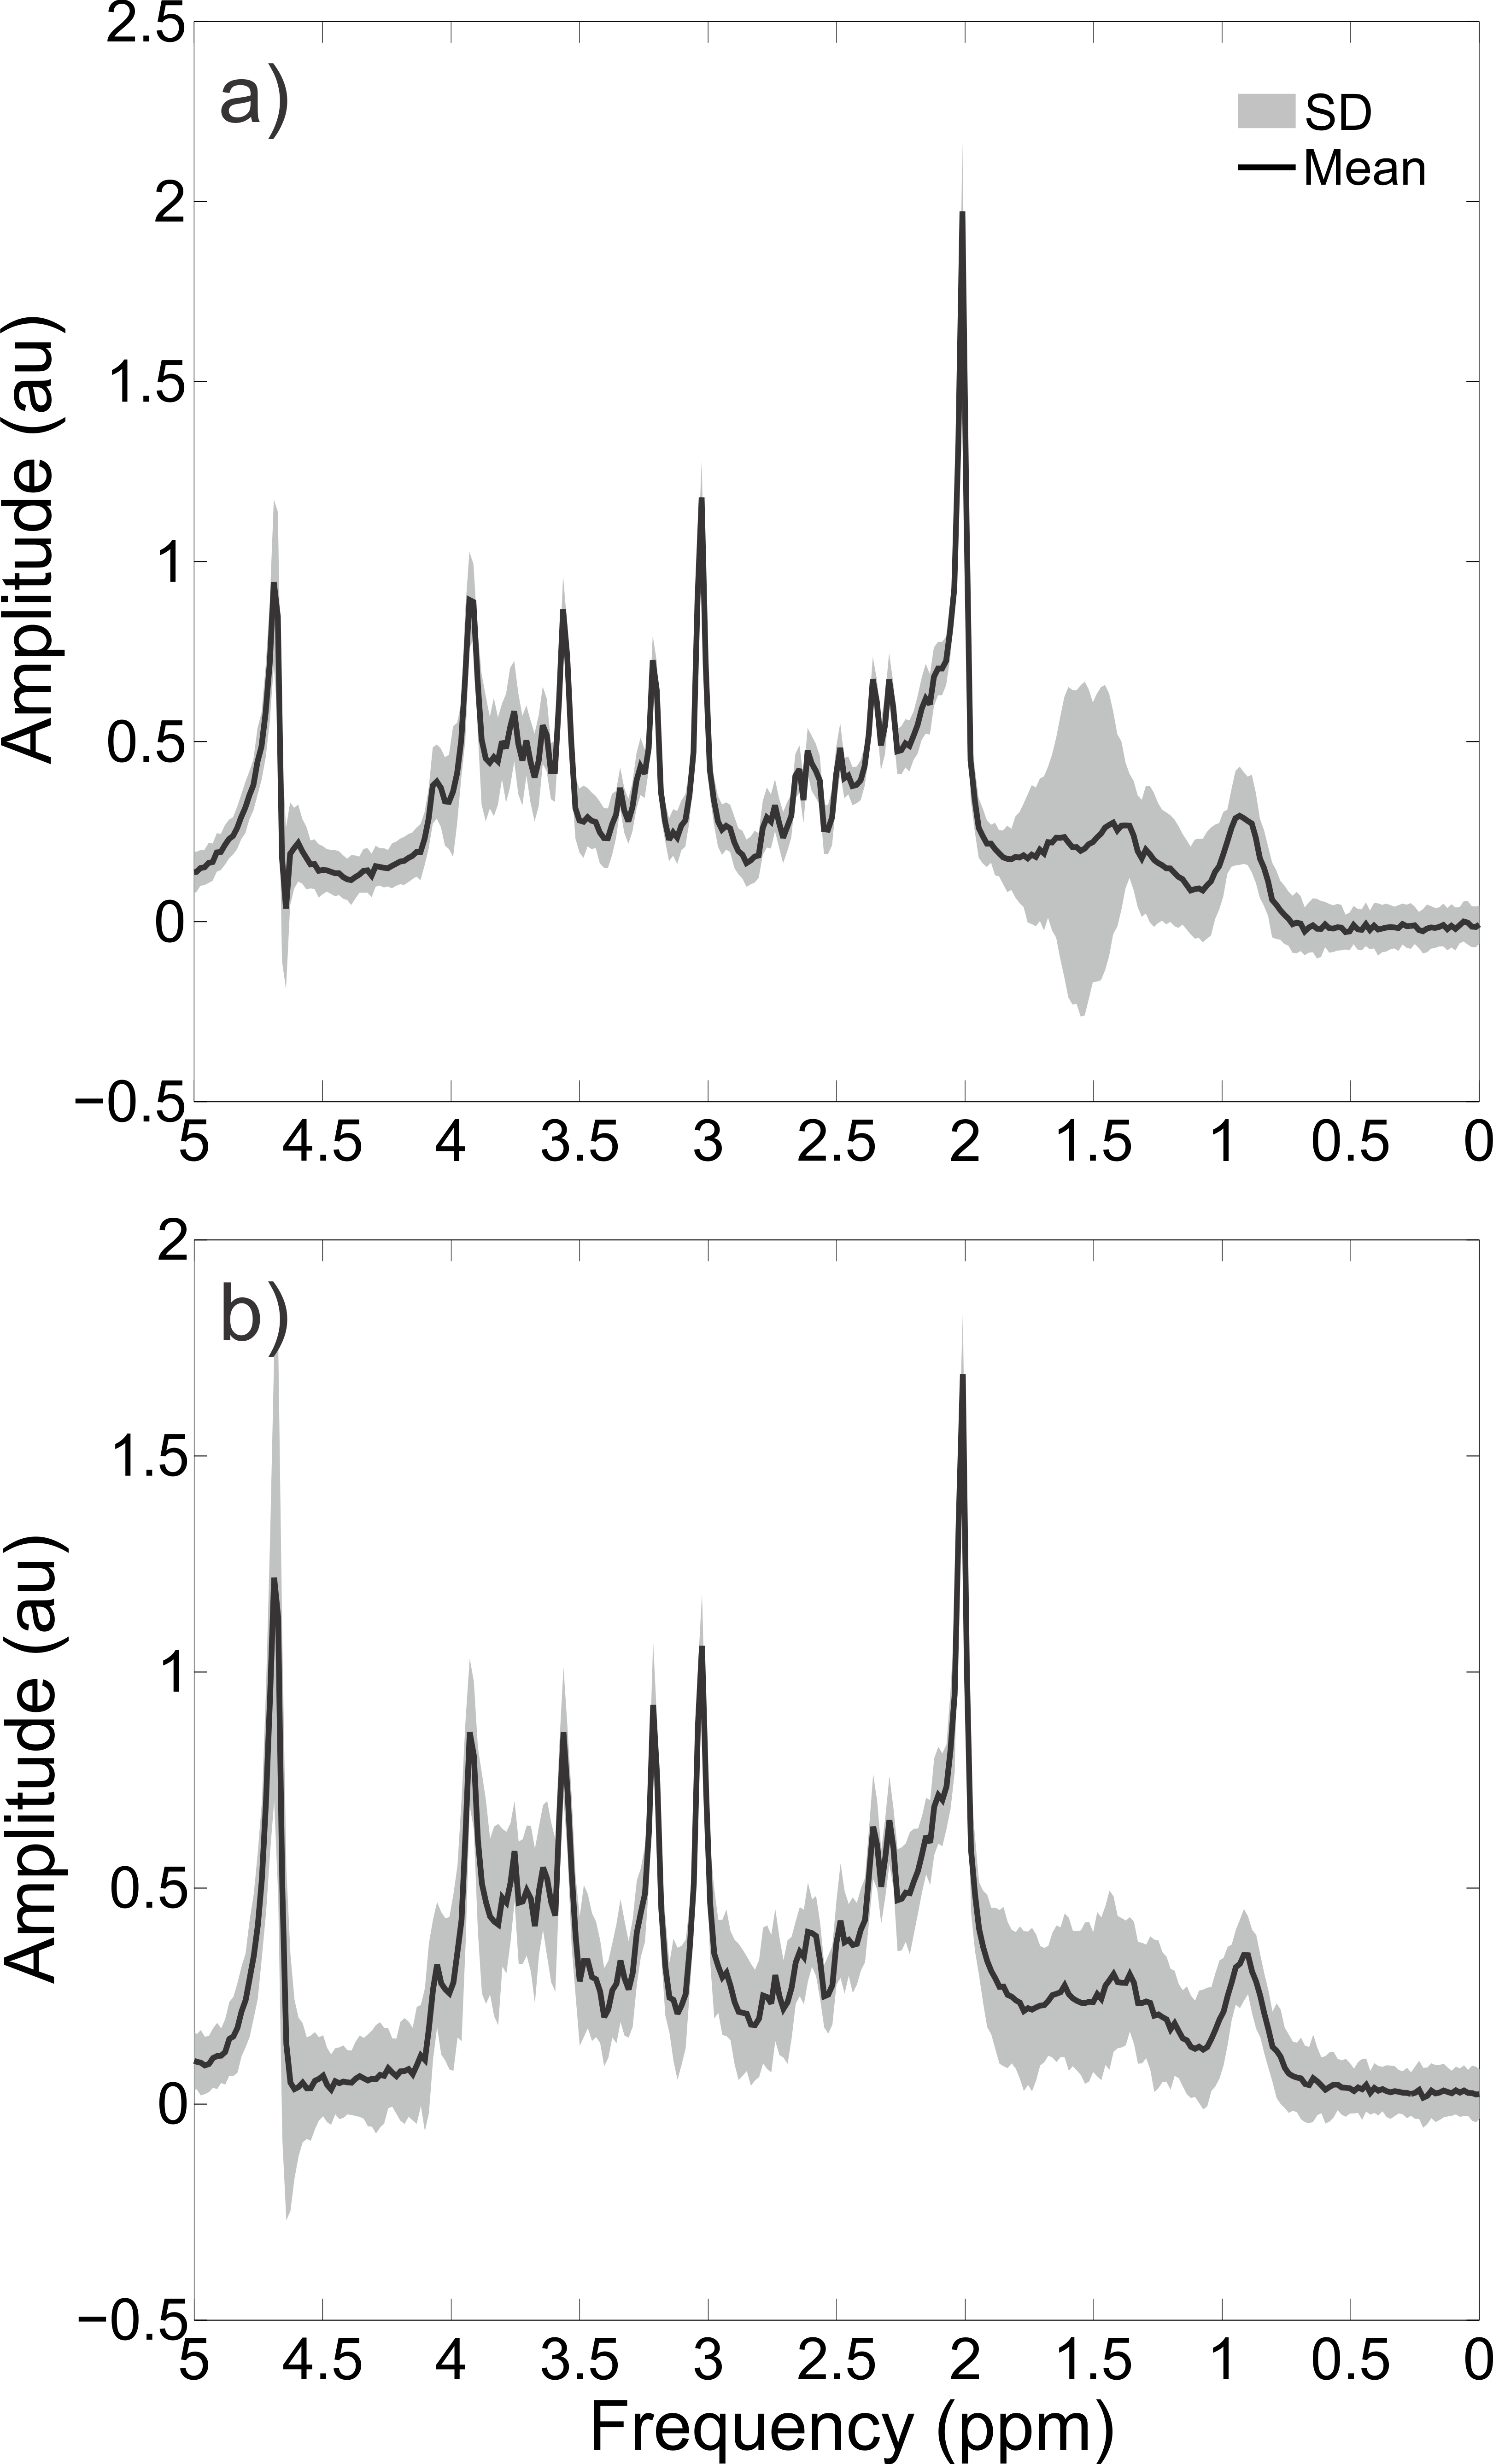
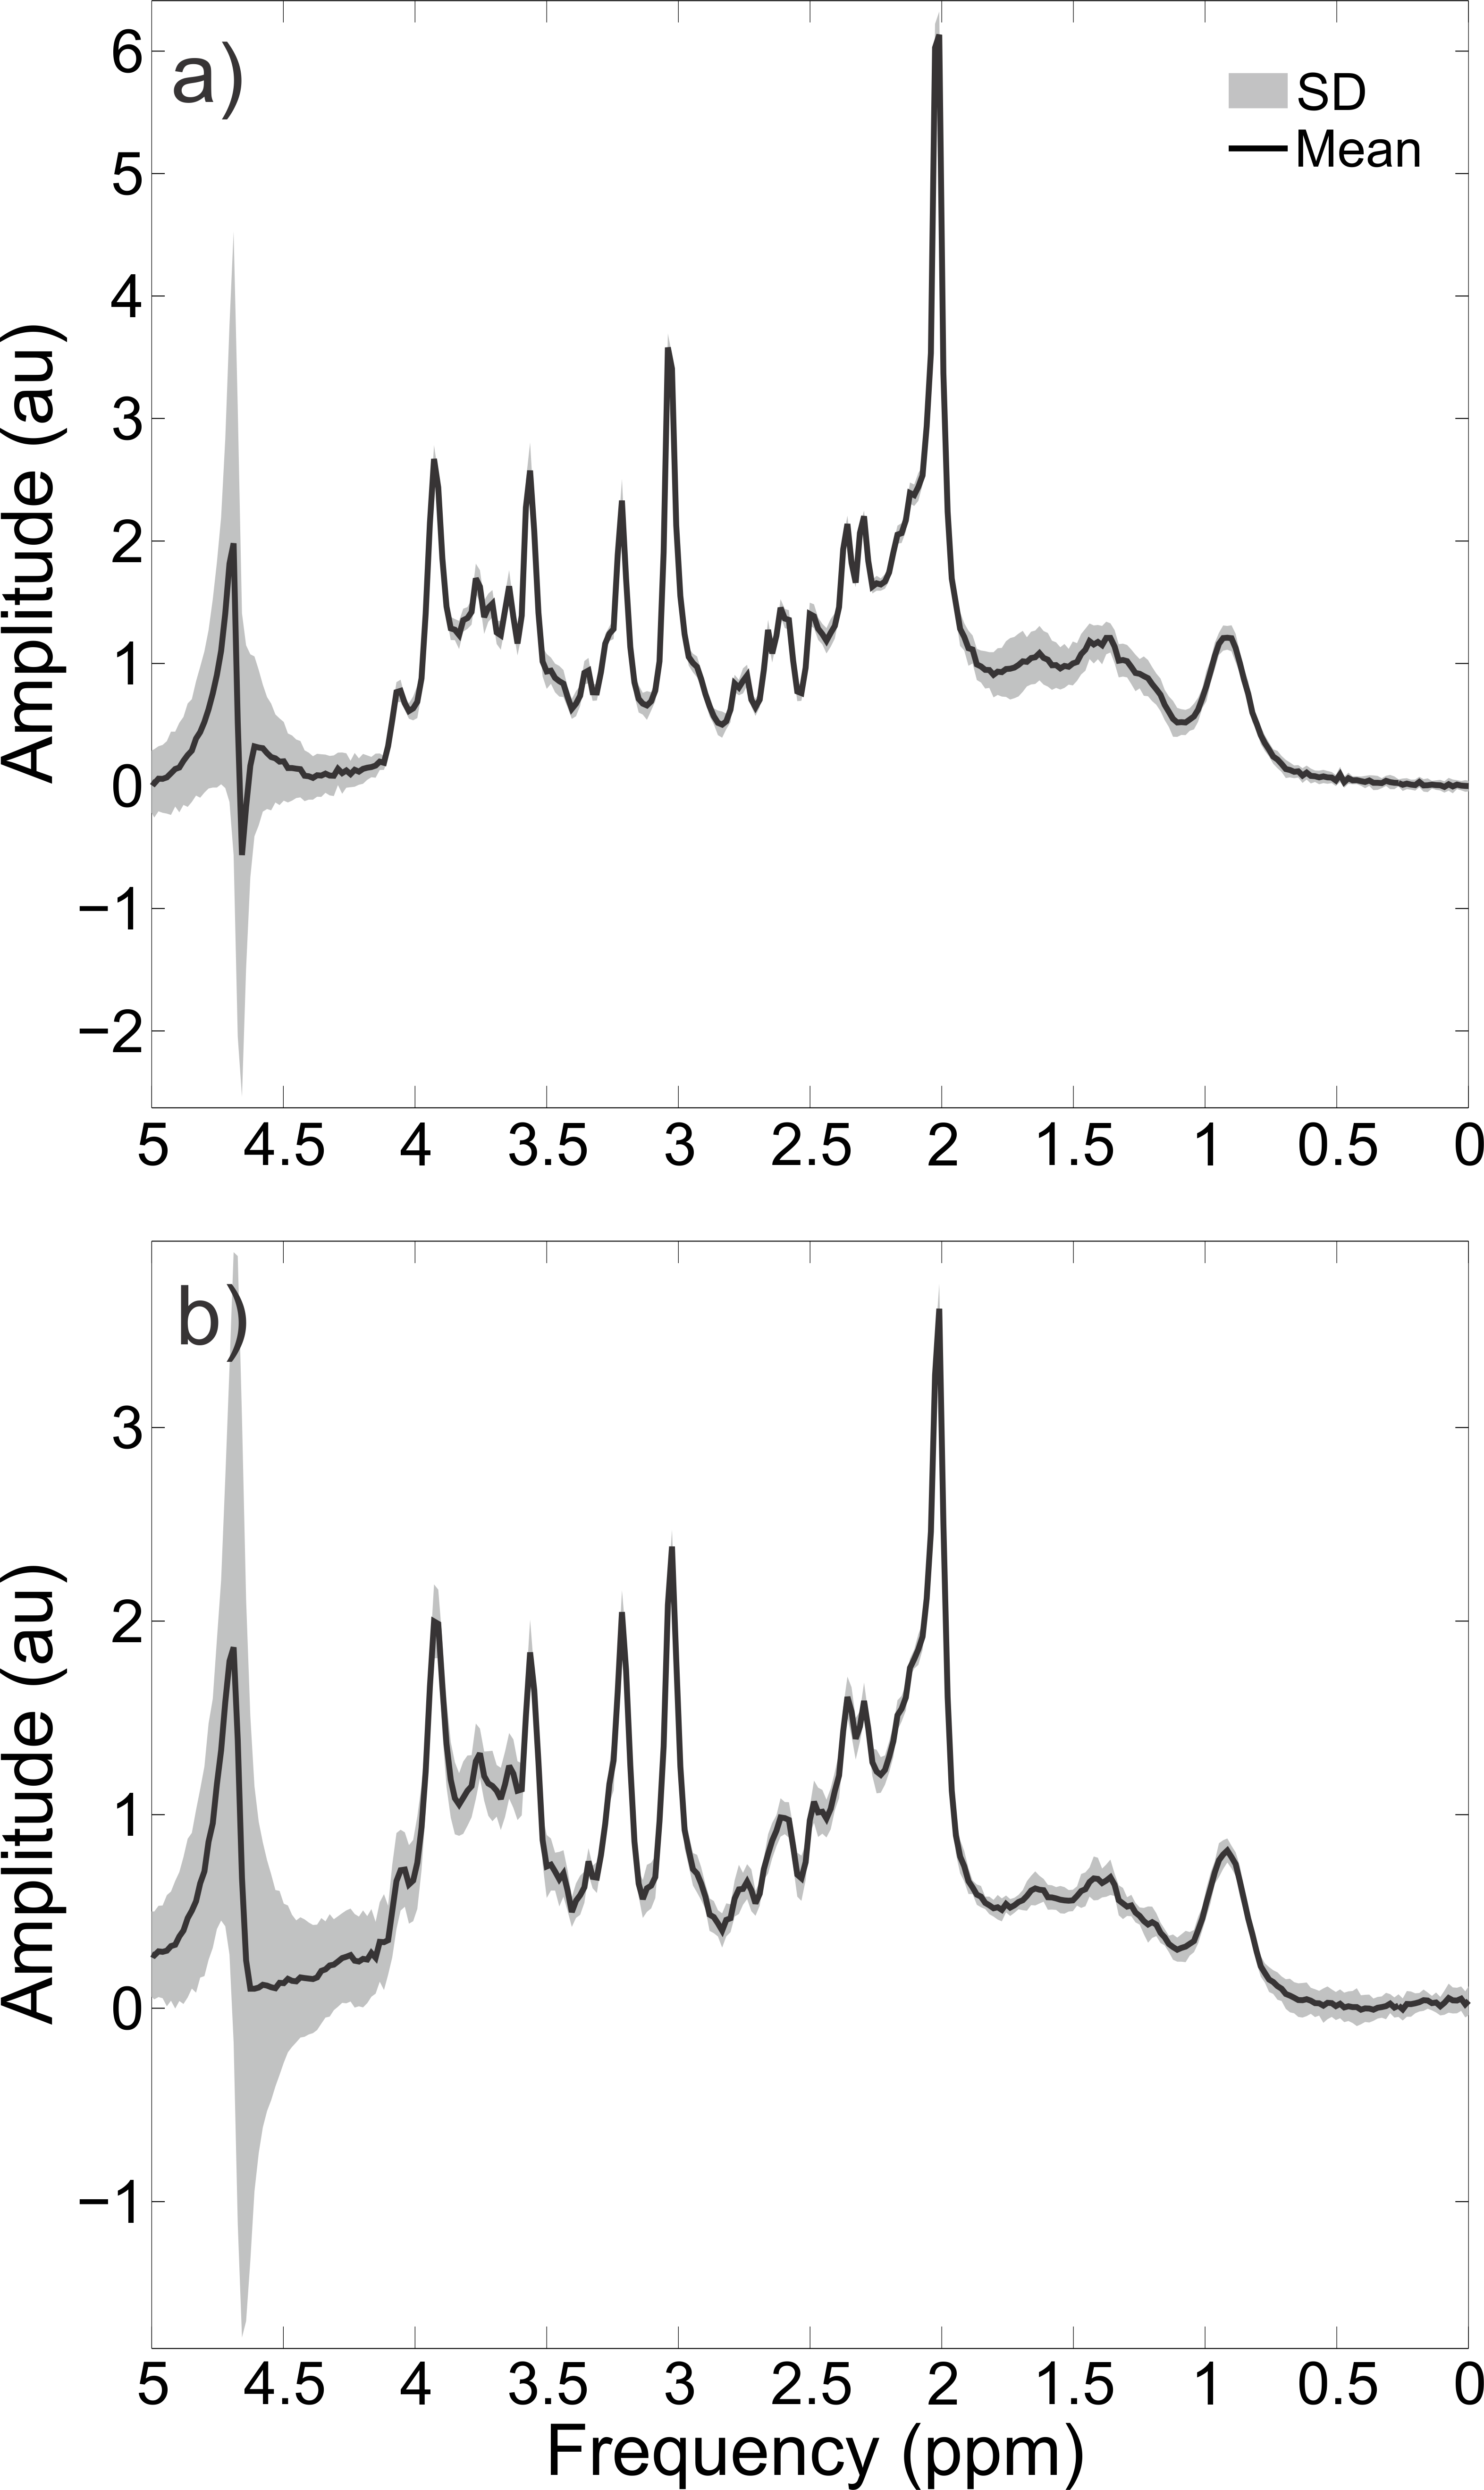
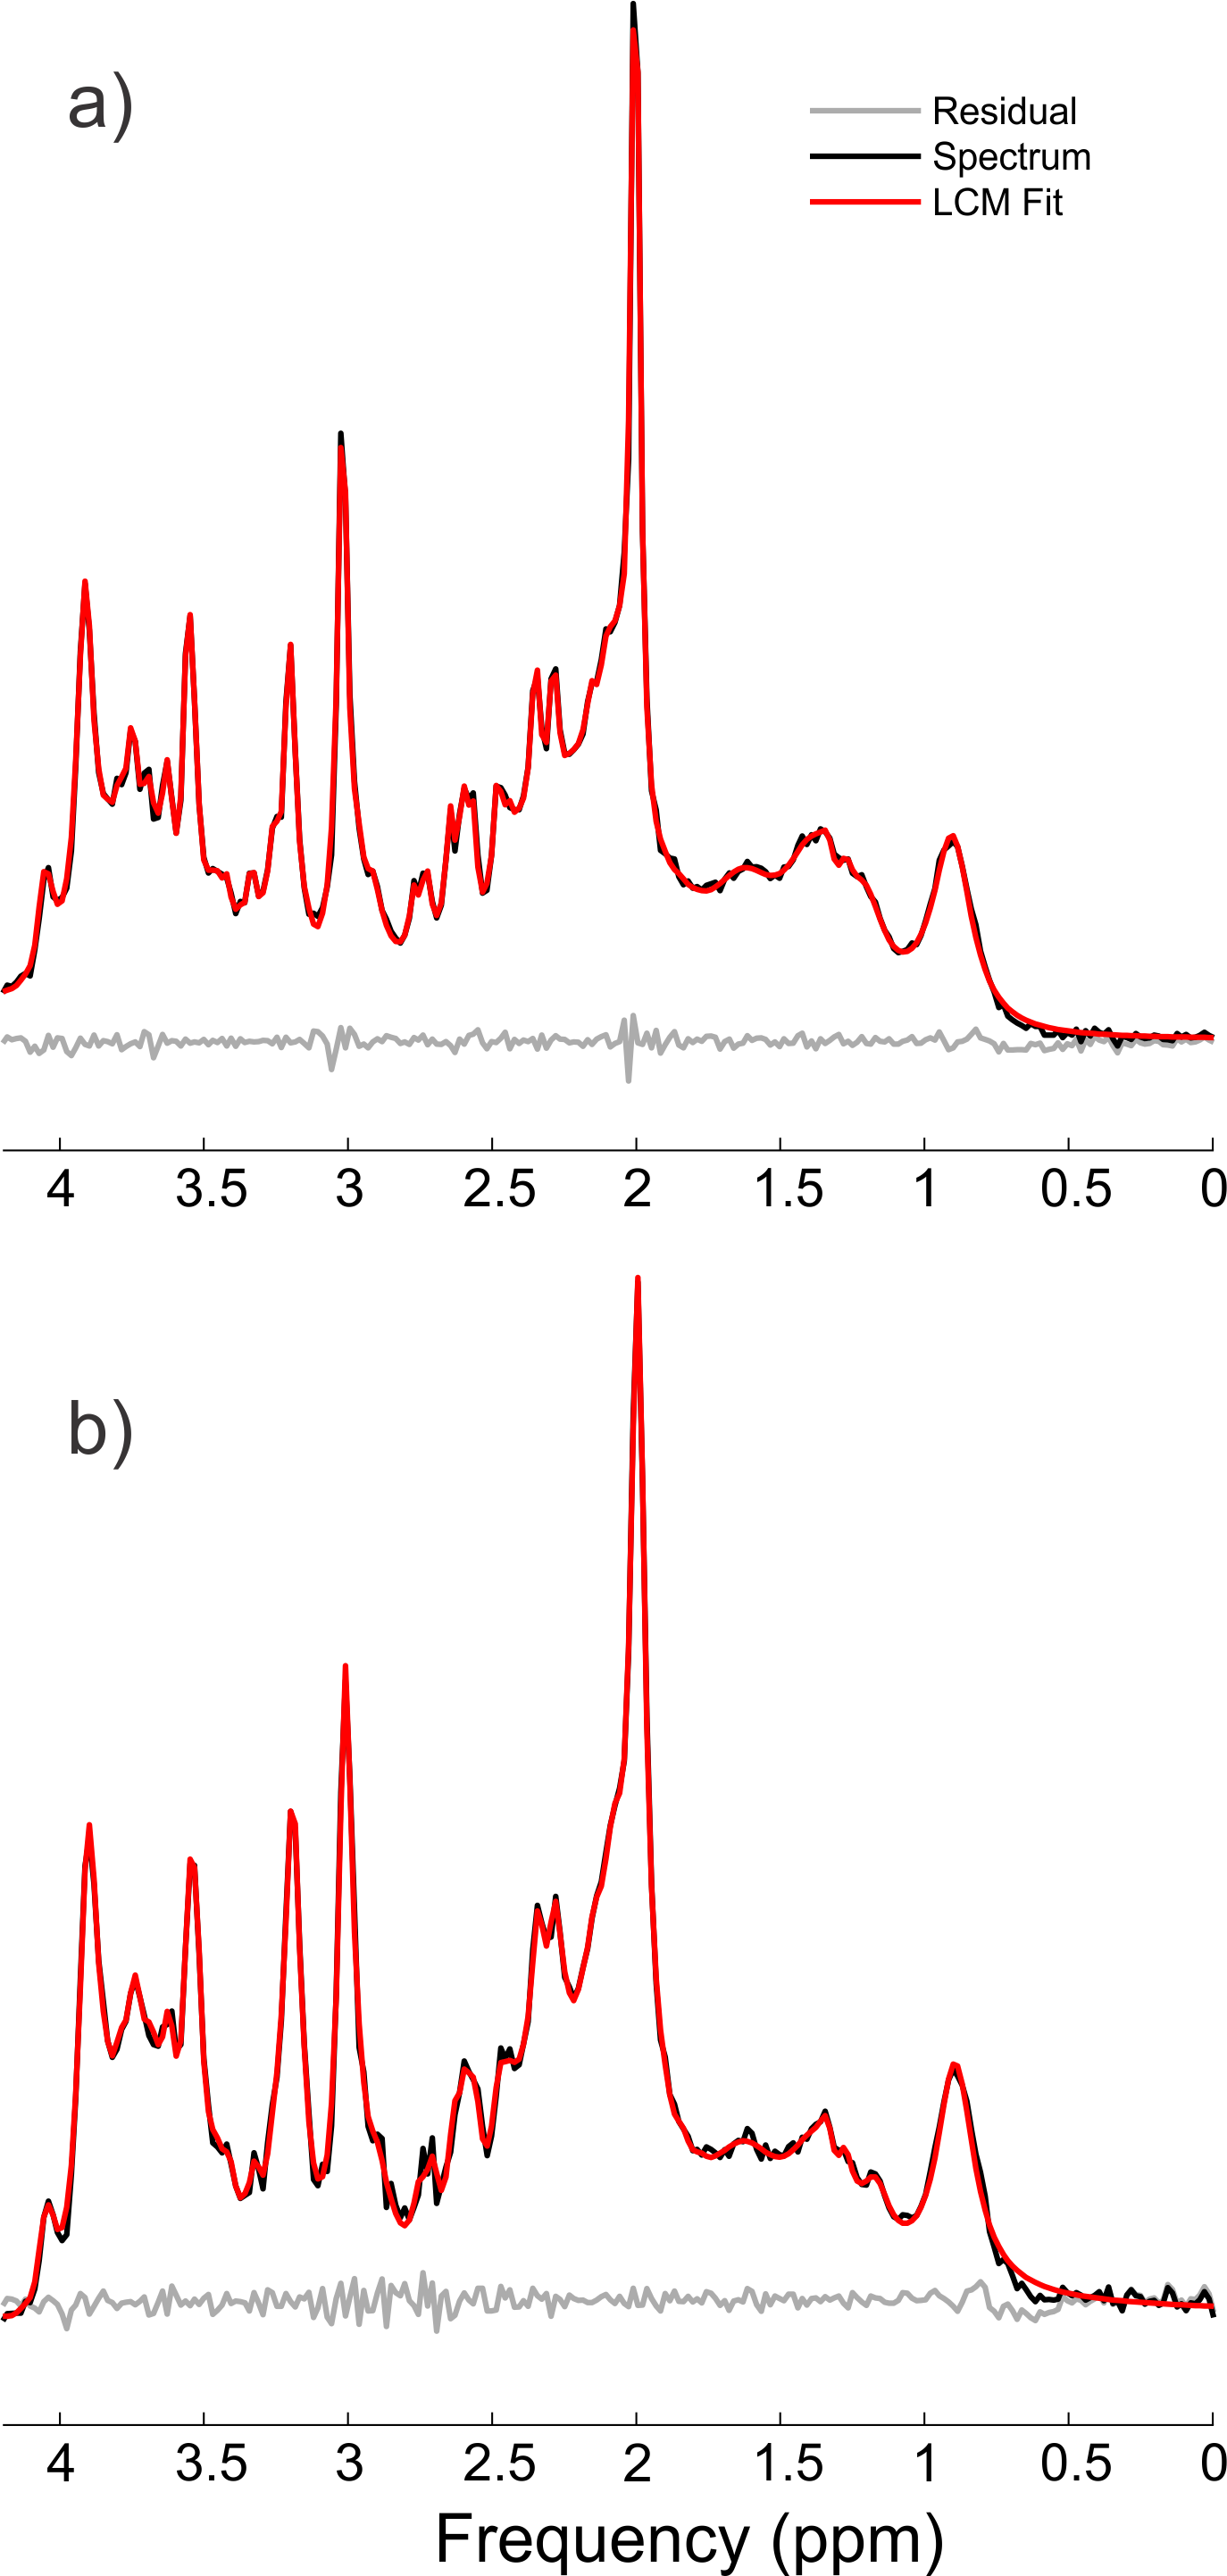
Individual traces showed no obvious indication of spurious echoes in the metabolite region (1.9 to 4.1 ppm), although some unwanted coherence pathways can be observed in the macromolecule region (0.8 to 1.8 ppm), as seen in Figure 5. Due to the high consistency between individual traces over the metabolite region, i.e. lack of erroneous shape alterations from spurious echoes, this enabled the frequency and phase alignment over the metabolite region prior to summation. The spurious echoes in the macromolecule region were effectively eliminated by the phase cycling scheme, (Figure 3), and hence are not considered to be an issue despite their presence within the individual traces. The water suppression factor across all volunteers was $$$(3.9 \pm 1.8) \times 10^{-4}$$$ and $$$(4.7 \pm 1.6) \times 10^{-4}$$$ for the occipital and prefrontal voxels, respectively, with > 99.9% water suppression for all voxels. High quality spectra were obtained for all subjects and voxels (Figure 4), with NAA linewidths of $$$4.7 \pm 0.4$$$ Hz in the occipital lobe and $$$6.0 \pm 0.8$$$ Hz in the prefrontal. High quality fits were obtained for all voxels (Figure 5). The prefrontal concentrations (mM) were $$$1.58 \pm 0.43$$$, $$$5.97 \pm 0.57$$$, $$$1.36 \pm 0.69$$$, $$$10.46 \pm 2.19$$$, $$$7.71 \pm 0.55$$$ and $$$3.17 \pm 0.54$$$ for choline, creatine, glutathione (GSH), glutamate + glutamine (Glx), N-acetylaspartic acid (NAA) and myo-inositol (mI), respectively. The occipital concentrations (mM) were $$$0.97 \pm 0.14$$$, $$$5.35 \pm 0.78$$$, $$$1.15 \pm 0.31$$$, $$$8.44 \pm 1.57$$$, $$$8.37 \pm 1.06$$$, and $$$3.62 \pm 0.33$$$ for choline, creatine, GSH, Glx, NAA, and mI, respectively.Conclusions
High quality spectra can be obtained with this implementation of sLASER with an echo time of 20.1 ms and minimal chemical shift displacement error.Acknowledgements
No acknowledgement found.References
[1] M. Wilson et al., “Methodological consensus on clinical proton MRS of the brain: Review and recommendations,” Magn Reson Med, pp. 1–24, 2019.
[2] T. W. Scheenen, A. Heerschap, and D. W. Klomp, “Towards 1H-MRSI of the human brain at 7T with slice-selective adiabatic refocusing pulses.,” Magn Reson Mater Phy, vol. 21, no. 1–2, pp. 95–101, 2008.
[3] T. W. J. Scheenen, D. W. J. Klomp, J. P. Wijnen, and A. Heerschap, “Short echo time 1H-MRSI of the human brain at 3T with minimal chemical shift displacement errors using adiabatic refocusing pulses,” Magn Reson Med, vol. 59, no. 1, pp. 1–6, 2008.
[4] J. Penner and R. Bartha, “Semi-LASER 1 H MR Spectroscopy at 7 Tesla in Human Brain: Metabolite Quantification Incorporating Subject-Specific Macromolecule Removal,” Magn Reson Med, vol. 74, pp. 4–12, 2015.
[5] K. Snoussi et al., “Comparison of Brain Gray and White Matter Macromolecule Resonances at 3 and 7 Tesla,” Magn Resn Med, vol. 74, no. 3, pp. 607–613, 2015.
[6] K. Landheer and C. Juchem, “Simultaneous optimization of crusher and phase cycling schemes for magnetic resonance spectroscopy: an extension of dephasing optimization through coherence order pathway selection,” Magn Reson Med, p. [Epub ahead of print], 2019.
[7] K. Landheer and C. Juchem, “Dephasing optimization through coherence order pathway selection (DOTCOPS) for improved crusher schemes in MR spectroscopy,” Magn Reson Med, vol. 81, pp. 2209–2222, 2019.
[8] J. Pauly, P. Le Roux, D. Nishimura, and A. Macovski, “Parameter Relations for the Shinnar-Le Roux Selective Excitation Pulse Design Algorithm,” IEEE Trans Med Imag, vol. 10, no. 1, pp. 53–65, 1991.
[9] M. Shinnar, L. Bolinger, and J. S. Leigh, “The Use of Finite Impulse Response Filters in Pulse Design.,” Magn. Reson. Med., vol. 12, no. 1, pp. 81–87, 1989.
[10] O. C. Andronesi, S. Ramadan, E. Ratai, and D. Jennings, “Spectroscopic Imaging with Improved Gradient Modulated Constant Adiabaticity Pulses on High-Field Clinical Scanners,” J Magn Reson, vol. 203, no. 2, pp. 283–293, 2010.
[11] D. K. Deelchand et al., “Across-vendor standardization of semi-LASER for single-voxel MRS at 3 Tesla,” NMR Biomed, p. In press.
[12] M. H. Levitt, P. K. Madhu, and C. E. Hughes, “Cogwheel phase cycling,” J Magn Reson, vol. 155, no. 2, pp. 300–306, 2002.
[13] I. Tkáč, Z. Starcuk, I. Y. Choi, and R. Gruetter, “In vivo 1H NMR spectroscopy of rat brain at 1 ms echo time.,” Magn Reson Med, vol. 41, no. 4, pp. 649–56, 1999.
[14] K. L. Chan, R. Ouwerkerk, and P. Barker, “Water suppression in the human brain with hypergeometric RF pulses for single-voxel and multi-voxel MR spectroscopy,” Magn Reson Med, vol. 80, pp. 1298–1306, 2018.
[15] C. Juchem, S. U. Rudrapatna, T. W. Nixon, and R. A. Graaf, “Dynamic Multi-Coil Technique (DYNAMITE) Shimming for Echo-Planar Imaging of the Human Brain at 7 Tesla,” Neuroimage, vol. 105, pp. 462–472, 2015.
[16] U. Klose, “In Vivo Proton Spectroscopy in Presence of Eddy Currents,” Magn Reson Med, vol. 30, pp. 26–30, 1990.
[17] H. Prinsen, R. a de Graaf, G. F. Mason, D. Pelletier, and C. Juchem, “Reproducibility measurement of glutathione, GABA, and glutamate: Towards in vivo neurochemical profiling of multiple sclerosis with MR spectroscopy at 7T.,” J Magn Reson Imag, vol. 45, no. 1, pp. 187–198, Jan. 2017.
[18] C. Juchem, “INSPECTOR - Magnetic Resonance Spectroscopy Software,” http://juchem.bme.columbia.edu/software-and-tools.
[19] K. Landheer, K. M. Swanberg, and C. Juchem, “Magnetic Resonance Spectrum Simulator (MARSS), A Novel Software Package for Fast and Computationally Efficient Basis Set Simulation,” NMR Biomed, p. e4129, 2019.
[20] J. Ashburner and K. J. Friston, “Unified segmentation,” Neuroimage, vol. 26, no. 3, pp. 839–851, 2005.
Figures