2860
Enabling Fast Metabolic Mapping of the Brain using Lipid Crushing and an EPSI Readout at 7T1Imaging & Oncology, UMC Utrecht, Utrecht, Netherlands, 2Danish Research Centre for Magnetic Resonance, Centre for Functional and Diagnostic Imaging and Research, Copenhagen University Hospital Hvidovre, Hvidovre, Denmark
Synopsis
Metabolic mapping at ultra-high field benefits from increased SNR and large chemical shift dispersion, enabling high spatial resolution and more resolved metabolite resonances. By exploiting increased SNR, MRSI acquisitions can be accelerated using echo-planar readout gradients (EPSI) or parallel imaging techniques. However, signal contamination from extra-cranial lipids can degrade the spectral quality and/or introduce fold-over artefacts. Therefore, suppression of extra-cranial lipids during acquisition is imperative for fast spectroscopic imaging. This work aimed to use a “crusher coil” to suppress extracranial lipid signals while acquiring metabolic information using a pulse-acquire acquisition with EPSI readout.
Introduction
Metabolic mapping at ultra-high field benefits from the increased SNR and large chemical shift dispersion, enabling high spatial resolution and more resolved metabolite resonances. However, increasing spatial resolution comes at the cost of prohibitively long scan-times. Moreover, lipid signal contamination due to the far-reaching the point-spread function associated with magnetic resonance spectroscopic imaging (MRSI) can cause unwanted artefacts that impede spectral quality. These effects can be amplified when using acceleration techniques such as SENSE 1,2 which can lead to fold-over artefacts 3. This is a critical problem considering the need to quantify metabolite distributions accurately. Lipid contamination can be avoided by using volume selection schemes such as semi-LASER 4; however, at the cost of long TR due to the specific absorption rate (SAR) limitations and limited spatial coverage. Another method for removing the lipid contamination is using L2 regularization 5 with short repetition times (i.e., TR<1000 ms) and very high spatial resolution (i.e., 128x128 matrix).6 Boer et al. 7 had shown that a crusher coil can effectively reduce lipid artefacts without any RF deposition in the brain. The sequence 8 enables the fast lipid suppression with high SNR per time unit using the crusher coil. To this end, this work aimed to present a pulse-acquire echo planar spectroscopic imaging (PA-EPSI) acquisition 9,10 including the lipid suppression using an external crusher coil at 7T.Methods
Measurements were performed in a healthy volunteer using a 7T MR scanner (Achieva, Philips, the Netherlands) with a quadrature transmit and a 32 channel receiving head coil (Nova Medical, USA). Informed consent was obtained from the volunteer and the local ethics committee approved the experiment.2D EPSI readout was acquired with the following parameters: FOV=192x192 mm2, one 12x12 and the other 6x6 mm2 voxel sizes, slice thickness=12 mm, temporal samples=512, VAPOR water suppression, and acquisition bandwidth=128 kHz. Additional parameters that differed between acquisition techniques are summarized (Table 1). For each acquisition, a non-water suppressed reference was acquired using similar parameters with 1 average. For all measurements, B0 shimming 11 was performed using up to 2nd order shim terms and an additional 3rd order shim amplifier was used to drive the crusher coil 7. A series of 3 measurements were performed to evaluate lipid signal leakage and suppression at the centre and periphery of the brain: 1) semi-LASER localization 4; 2) pulse-acquire (PA) with EPSI readout and no lipid suppression; 3) pulse-acquire with EPSI readout including lipid suppression using the crusher coil in figure 1. To compare the semi-LASER and pulse acquire techniques, the TR and flip angle were kept constant for the low-resolution acquisitions. To show the benefit of accelerated lipid suppressed MRSI, an additional measurement was performed at a higher spatial resolution using a shorter TR and optimized flip angle (for T1=1700: see table 1).12
During reconstruction, k-space lines of even EPSI echoes were reversed along the temporal dimension. A 2D phase correction was performed on both the water reference raw data and water suppressed raw data. Coil sensitivity maps were generated using the water reference raw data and subsequently used for channel combinations of water suppressed MRSI data. Further processing steps included the apodization function with a 2D hamming filter, spectral alignment, residual water removal, and eddy current correction. All data reconstruction steps were performed using in-house MATLAB scripts.
Resuts and discussion
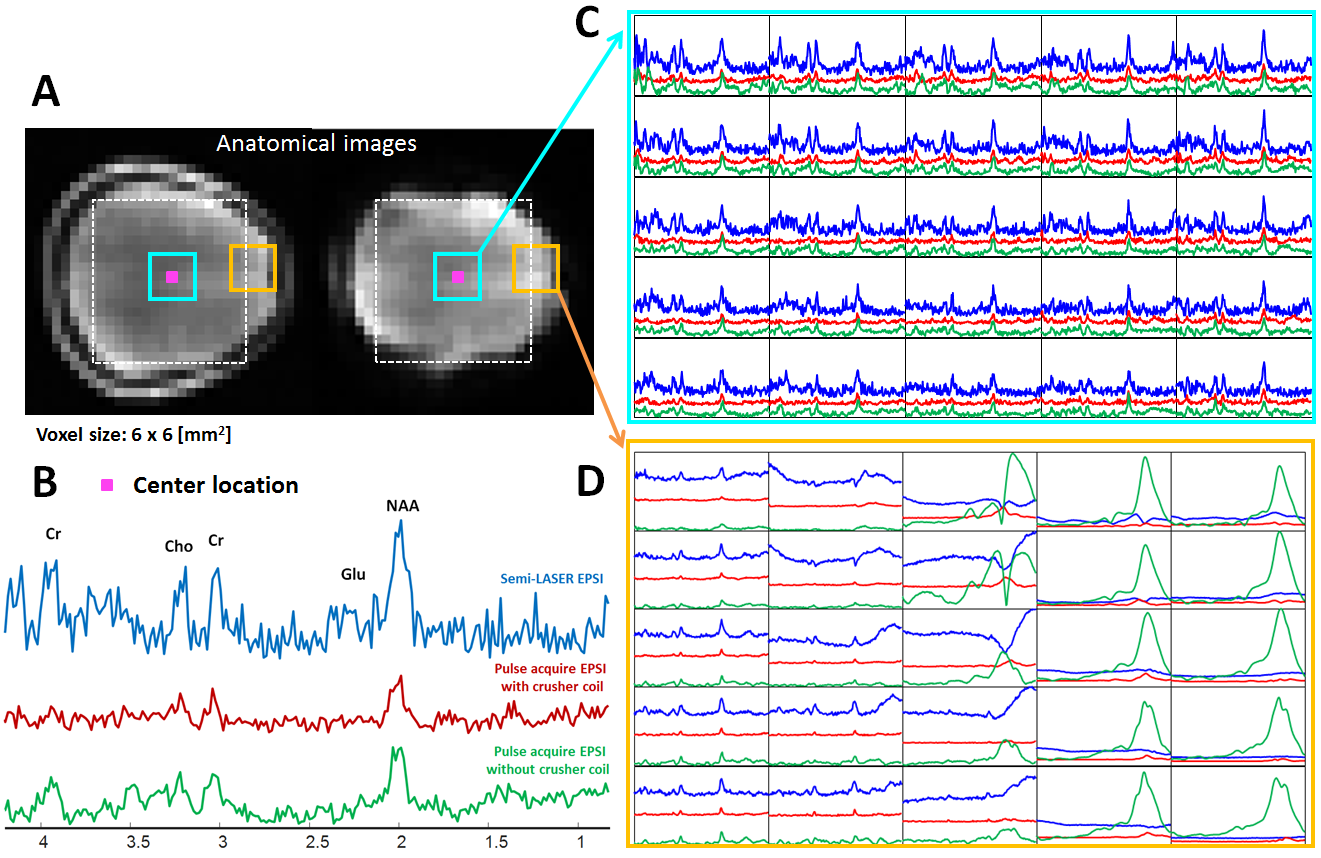
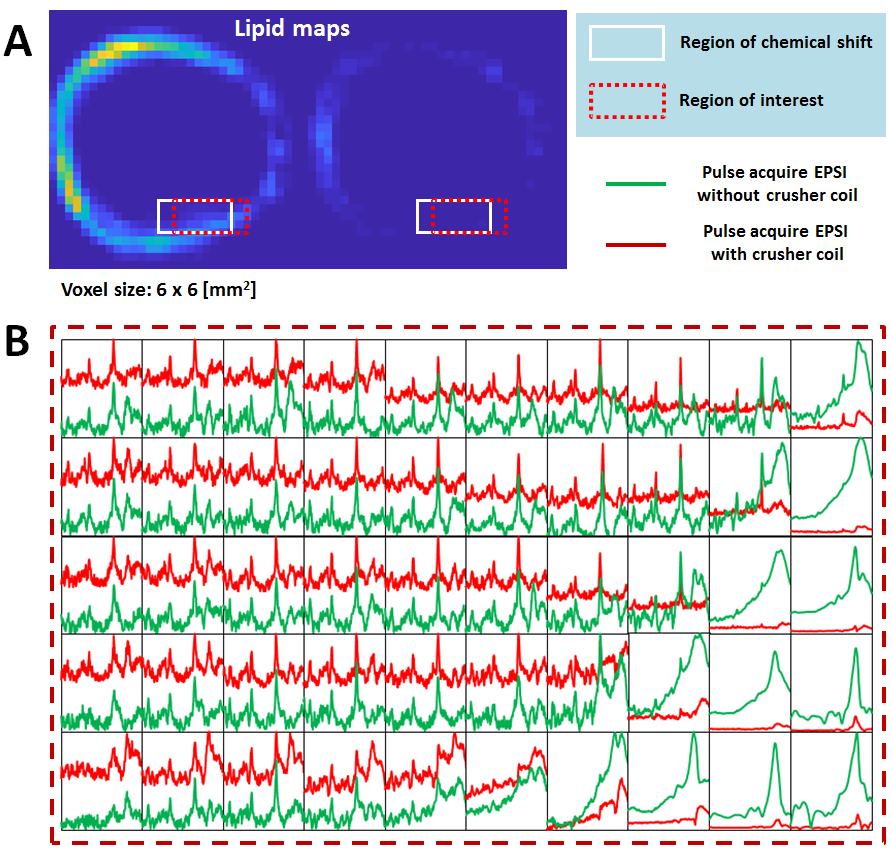
Example spectra from the 3 difference acquisition methods (semi-LASER EPSI with FOCI, PA-EPSI with and without crusher coil) are shown in figure 2. As expected, the spectra acquired in the center of the brain (orange voxel, figure 2A) showed no or very little contamination from extra-cranial lipid signals when using the semi-LASER localization. For the EPSI acquisitions, the similar signal characteristics between 0.8 and 1.5 ppm suggest sensitivity to macromolecular contributions due to short TE rather than the extra-cranial lipid contamination. Moving away from the center of the brain, lipid signal contamination was evident for non-suppressed PA-EPSI in figure 2C. When looking at regions close to the skull, the lipid signal contamination overshadows metabolite signals in figure 2D. However, at these locations (blue voxel, figure 2A), lipid suppressed PA-EPSI provided good spectra while the semi-LASER acquisition did not provide enough spatial coverage to acquire spectra in the region.This observation is confirmed in the higher resolution of MRSI data shown in figure 3C and D. Even though the semi-LASER localization restricts the signal to the localization volume (VOI), some lipid contamination is present at the corner of the VOI when it is closely positioned to the skull. Furthermore, the semi-LASER is less sensitive to metabolites with short T2 because of the relative long TE and limits relatively long TR by the RF power deposition (i.e., SAR). Therefore the semi-LASER is not an SNR efficient approach at high field. The MR spectra from the lipid suppressed PA-EPSI measurement were of good quality compared to the MR spectra from the PA-EPSI measurement without crushing in figure 4.
Conclusion
In this work, we successfully demonstrate the feasibility of accelerated MRSI acquisition while suppressing lipids using an external crusher coil. This work sets up the possibility to investigate optimal acquisition strategies for the fast whole-brain MRSI at 7T.Acknowledgements
We like to thank Eurostars IMAGINE and Marie-Curie ITN INSPiREmed for financial support.References
1. Pruessmann KP, Weiger M, Scheidegger MB, Boesiger P. SENSE: sensitivity encoding for fast MRI. Magn Reson Med. 1999; 42: 952– 962.
2. Dydak U, Weiger M, Pruessmann KP, Meier D, Boesiger P. Sensitivity‐encoded spectroscopic imaging. Magn Reson Med. 2001; 46: 713– 722.
3. Nassirpour S, Chang P, Avdievitch N, Henning A. Compressed sensing for high‐resolution nonlipid suppressed 1 H FID MRSI of the human brain at 9.4T. Magn Reson Med. 2018; 80: 2311– 2325.
4. Arteaga de Castro CS, Boer VO, Andreychenko A, et al. Improved efficiency on editing MRS of lactate and gamma‐aminobutyric acid by inclusion of frequency offset corrected inversion pulses at high fields. NMR Biomed. 2013; 26: 1213‐1219.
5. Bilgic B, Chatnuntawech I, Fan AP, et al. Fast image reconstruction with l2‐regularization. J Magn Reson Imaging. 2013; 40: 181– 191.
6. Bogner W, Gruber S, Trattnig S, Chmelík M. High resolution mapping of human brain metabolites by free induction decay 1H MRSI at 7 T. NMR Biomed 2012: 873– 882.
7. Boer, VO and van, de Lindt T and Luijten, PR and Klomp, DW. Lipid suppression for brain MRI and MRSI by means of a dedicated crusher coil. Magn Reson Med 2015; 73:2062-8.
8. Ma J, Wismans C, Cao Z, Klomp DWJ, Wijnen JP, Grissom WA. Tailored spiral in‐out spectral‐spatial water suppression pulses for magnetic resonance spectroscopic imaging. Magn Reson Med. 2018 Jan; 79(1):31-40.
9. Posse S, DeCarli C, Le Bihan D. Three‐dimensional echo‐planar MR spectroscopic imaging at short echo times in the human brain. Radiology. 1994; 192: 733– 738.
10. Posse S, Tedeschi G, Risinger R, Ogg R, Le Bihan D. High speed 1H spectroscopic imaging in human brain by echo planar spatial‐spectral encoding. Magn Reson Med. 1995; 33: 34‐ 40.
11. Schar M, Kozerke S, Fischer SE, Boesiger P. Cardiac SSFP Imaging at 3 Tesla. Magn Reson Med 2004; 51:799–806.
12. Xin L, Schaller B, Mlynarik V, Lu H, Gruetter R. Proton T1 relaxation times of metabolites in human occipital white and gray matter at 7T. Magn Reson Med 2013; 69:931–936.
Figures