2856
Hunting the perfect spline: Baseline handling for accurate macromolecule estimation and metabolite quantification by in vivo 1H MRS1Biomedical Engineering, Columbia University School of Engineering and Applied Science, New York, NY, United States, 2Radiology, Columbia University Vagelos College of Physicians and Surgeons, New York, NY, United States
Synopsis
It has been previously established that inappropriately modeled spectral baselines can confound metabolite concentration estimates by in vivo 1H MRS even while contributing to visually reasonable fits. The systematic optimization of spectral quantification pipelines, including baseline modeling, continues nonetheless to be impeded by an under-utilization of validation methods both physically meaningful and involving perfect prior knowledge. Here we address the extant need for evidence-based spectral baseline handling by combining the practical utility of in vivo data with the prior knowledge enabled by simulated standards. We use this paradigm to compare various baseline models for macromolecule characterization and metabolite quantification accuracy.
Introduction
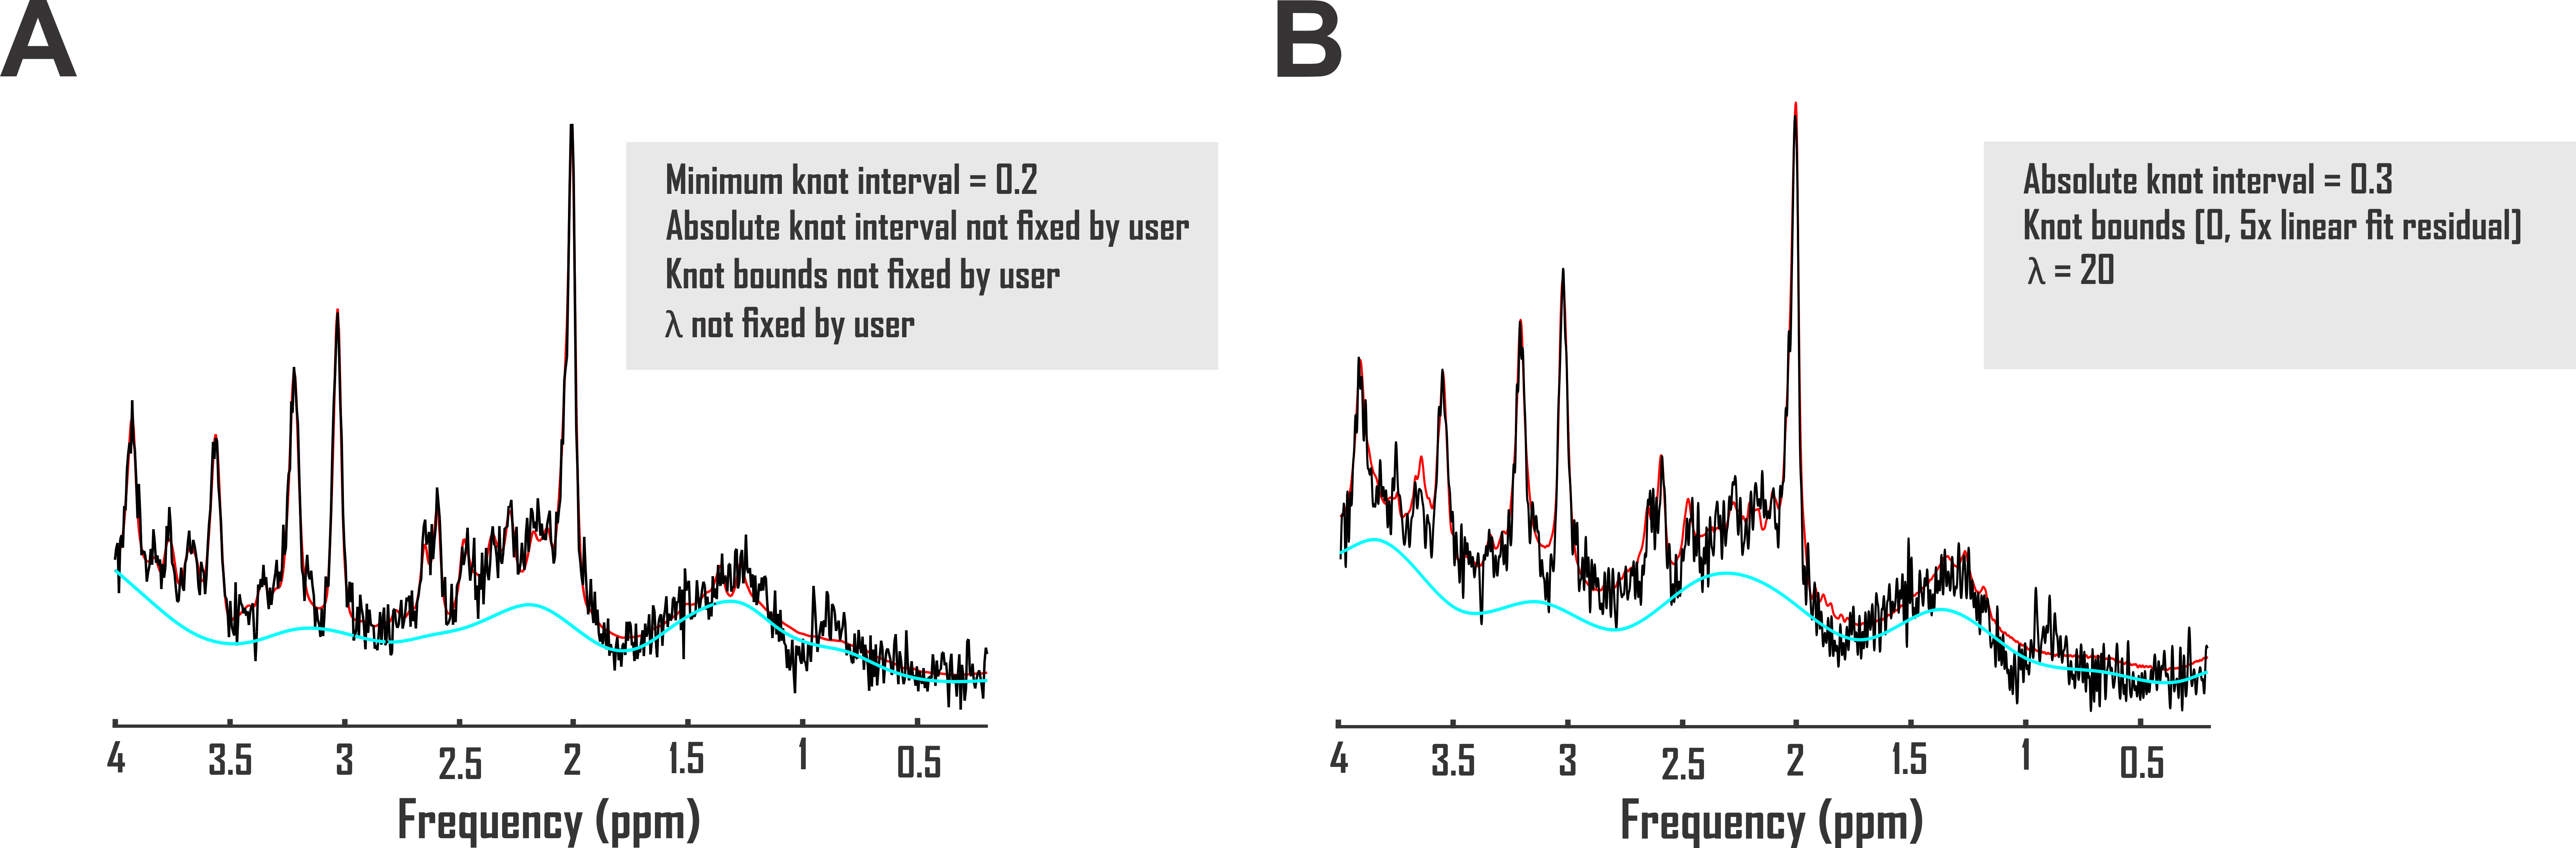
It has been previously demonstrated that spectral quality interacts with insufficient baseline models to introduce systematic errors to apparent concentrations of metabolites quantified by 1H MRS1,2. While exceptions employing exactly scaled metabolite resonances combined with directly measured in vivo baselines exist3, previous investigations into baseline model accuracy resemble the ongoing hunt for evidence-based 1H MRS quantification guidelines at large in demanding but largely lacking validation methods both maximally meaningful and perfectly reliable1,4. Spectroscopy on phantoms with known metabolite concentrations can enable quantification error measurement against a reasonably precise standard5, but they do not reflect biologically realistic baseline conditions even if some gel preparations might approach in vivo-like spectral quality. Analyses of variances and/or means across brain regions5, time points6,7, subjects8,9, or data centers10 exhibit superior biological relevance to phantoms, but they lack known concentration standards. Both approaches involve acquisition error introduced even before quantification.We address this extant need for evidence-based justification of baseline modeling approaches by using two validation pipelines that together combine the practical utility of in vivo data with the prior knowledge enabled by simulated standards. We use this paradigm to establish the influence of multiple baseline models, including splines with as-yet unexamined combinations of smoothing parameters and absolute knot intervals (Fig. 1), direct fitting of macromolecule basis functions, and the previously endorsed subtraction of metabolite-nulled acquisitions11, on macromolecule characterization and/or metabolite quantification accuracy of single-voxel short-echo time sLASER acquisitions in the healthy human cortex.
Methods
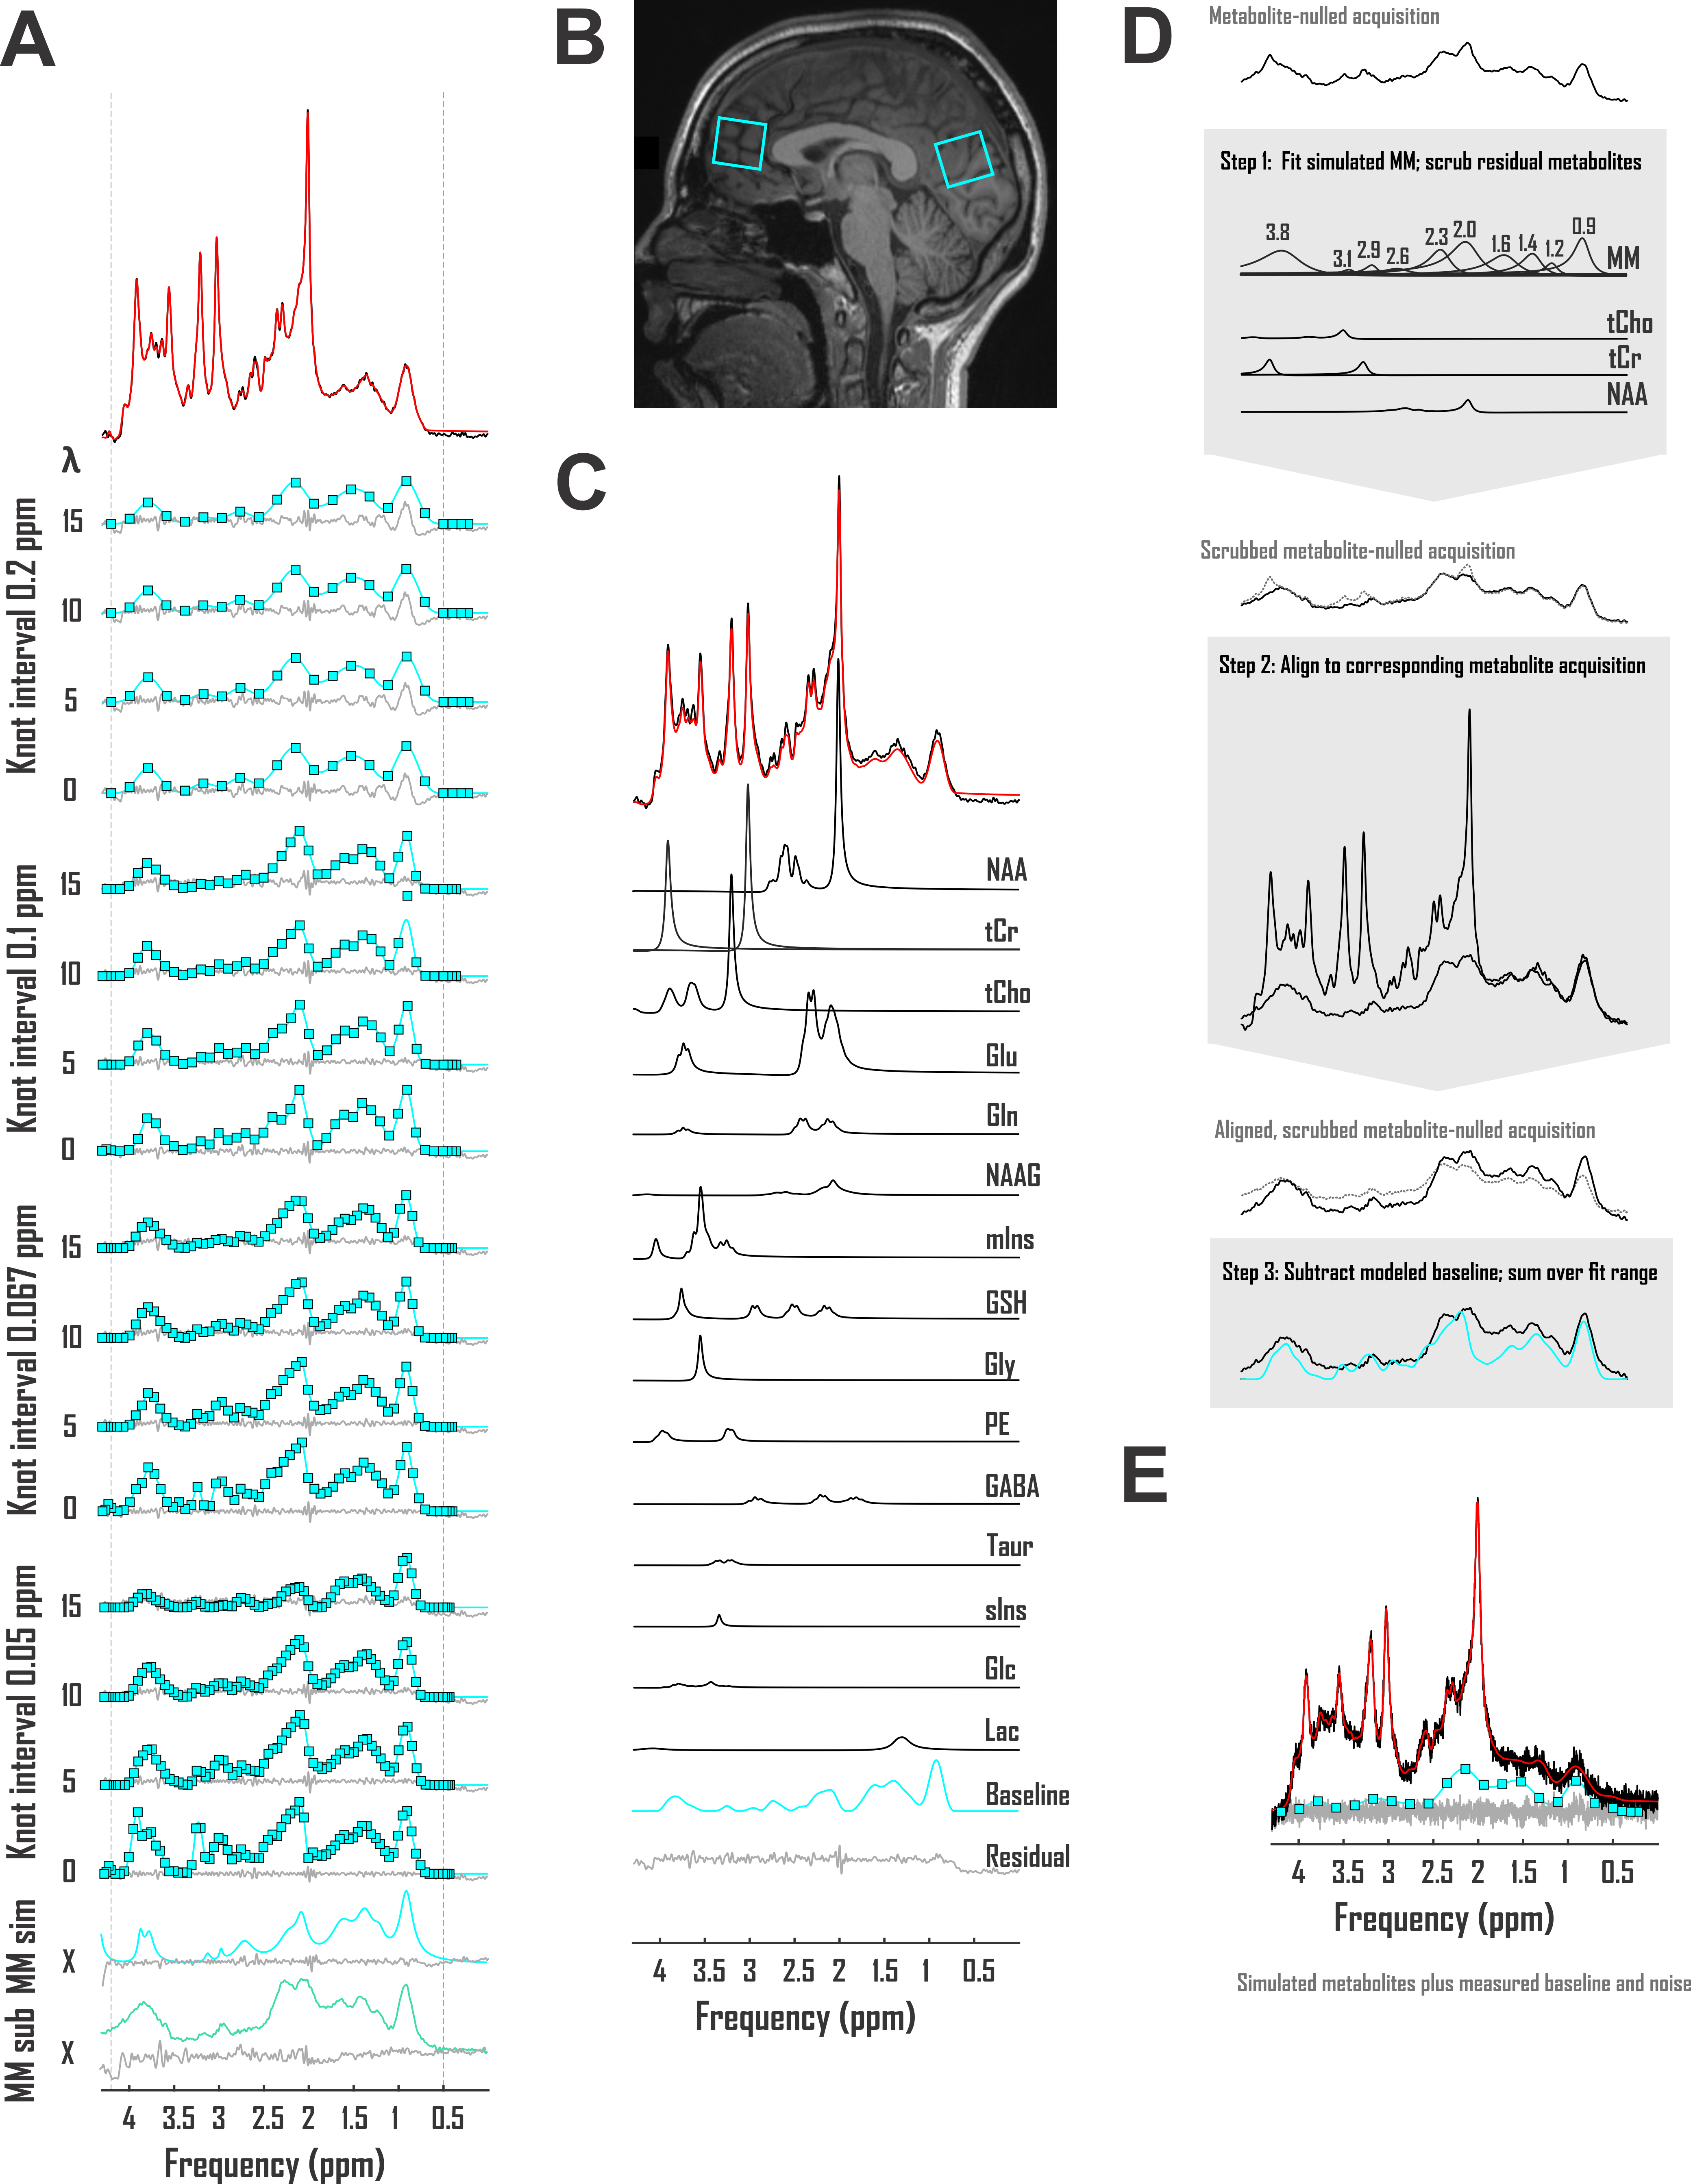
Accuracies of macromolecule and metabolite concentration estimation were assessed in two analysis pipelines for three baseline models. The first exploited a spline baseline functionality written into INSPECTOR12 at sixteen different user-defined combinations of knot interval and smoothing coefficient λ. The second employed a basis set of macromolecules simulated for the pulse sequence at hand, similar to previous work13. The third subtracted corresponding metabolite-nulled acquisitions before spectral fitting with offsets (Fig. 2A).First, to examine macromolecule prediction accuracy, we employed complex linear combination model (LCM) fits to in vivo metabolite spectra and compared generated baselines with corresponding metabolite-nulled acquisitions. Ten volunteers (equal sex ratios; 23 ± S.D. 5 y.o.) were scanned on a 3 Tesla Siemens MAGNETOM Prisma (Erlangen, Germany) using sLASER (TE 20 ms, TR 2 s, DOTCOPS-optimized crushers14 and 16-step phase cycling15) to isotropic voxels <27 cm3 in the medial prefrontal and occipital cortex in one session per voxel. Voxel selection was achieved via MPRAGE (FOV 256 x 256 x 192 mm, resolution 1 mm3, TE 2.26 ms, TR 2.3 s, TI 900 ms) (Fig. 1B). Spectra were preprocessed as detailed previously7. LCM in INSPECTOR employed a 15-metabolite basis (Fig. 1C) density-matrix simulated in MARSS16 plus a complex baseline that entered the optimization according to
$$B_k(\nu) + \lambda \lVert B_k''(\nu) \rVert$$
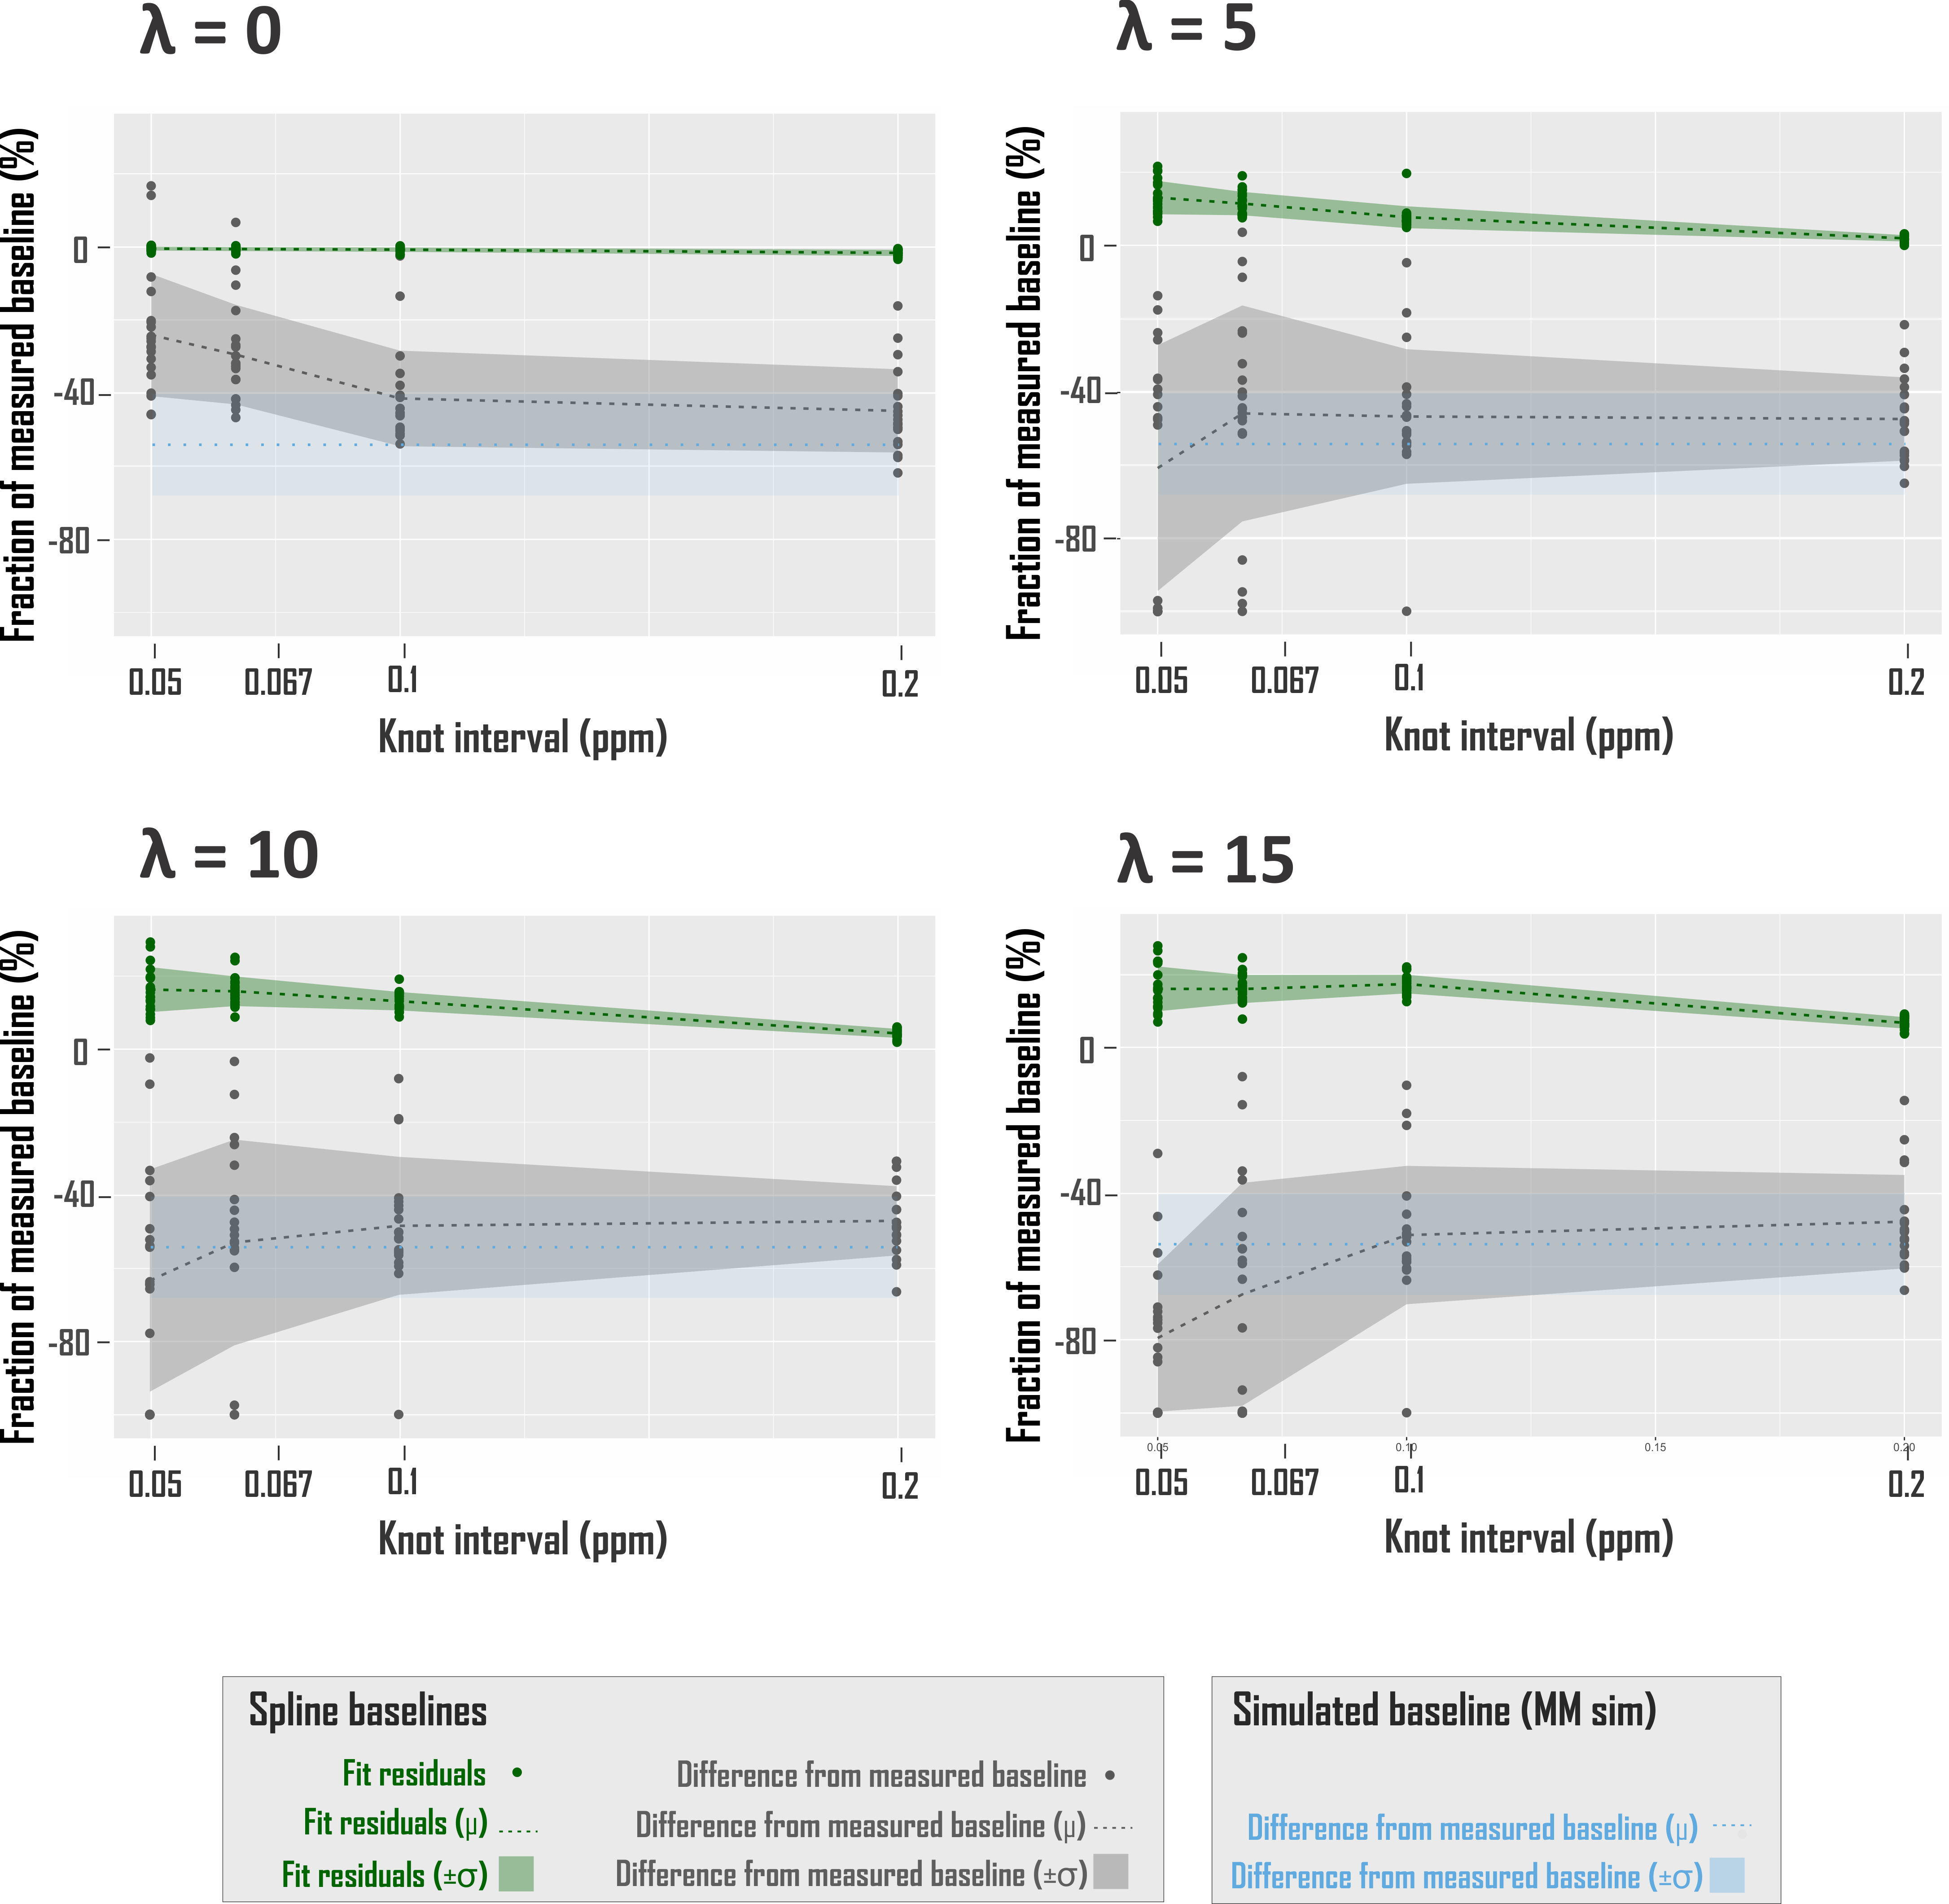
where Bk(ν) is the series of cubic splines expressed over fit frequency range ν and defined over evenly spaced knots of least-squares optimized ordinate, and λ a constant weight on the cost function thereof, based on previous work17. Knots were bound from 0 to 500% of offset-only baseline fit residuals. Fit baselines were compared with metabolite-nulled spectra from the same voxels (double inversion recovery7,8 TI1 920 ms and TI2 330 ms19) cleaned of potential residual N-acetyl aspartate, creatine, and choline singlets by subtracting LCM fits. The integrated real differences between measured and modeled baselines were calculated over metabolite fit range 0.5-4.2 ppm (Fig. 2D).
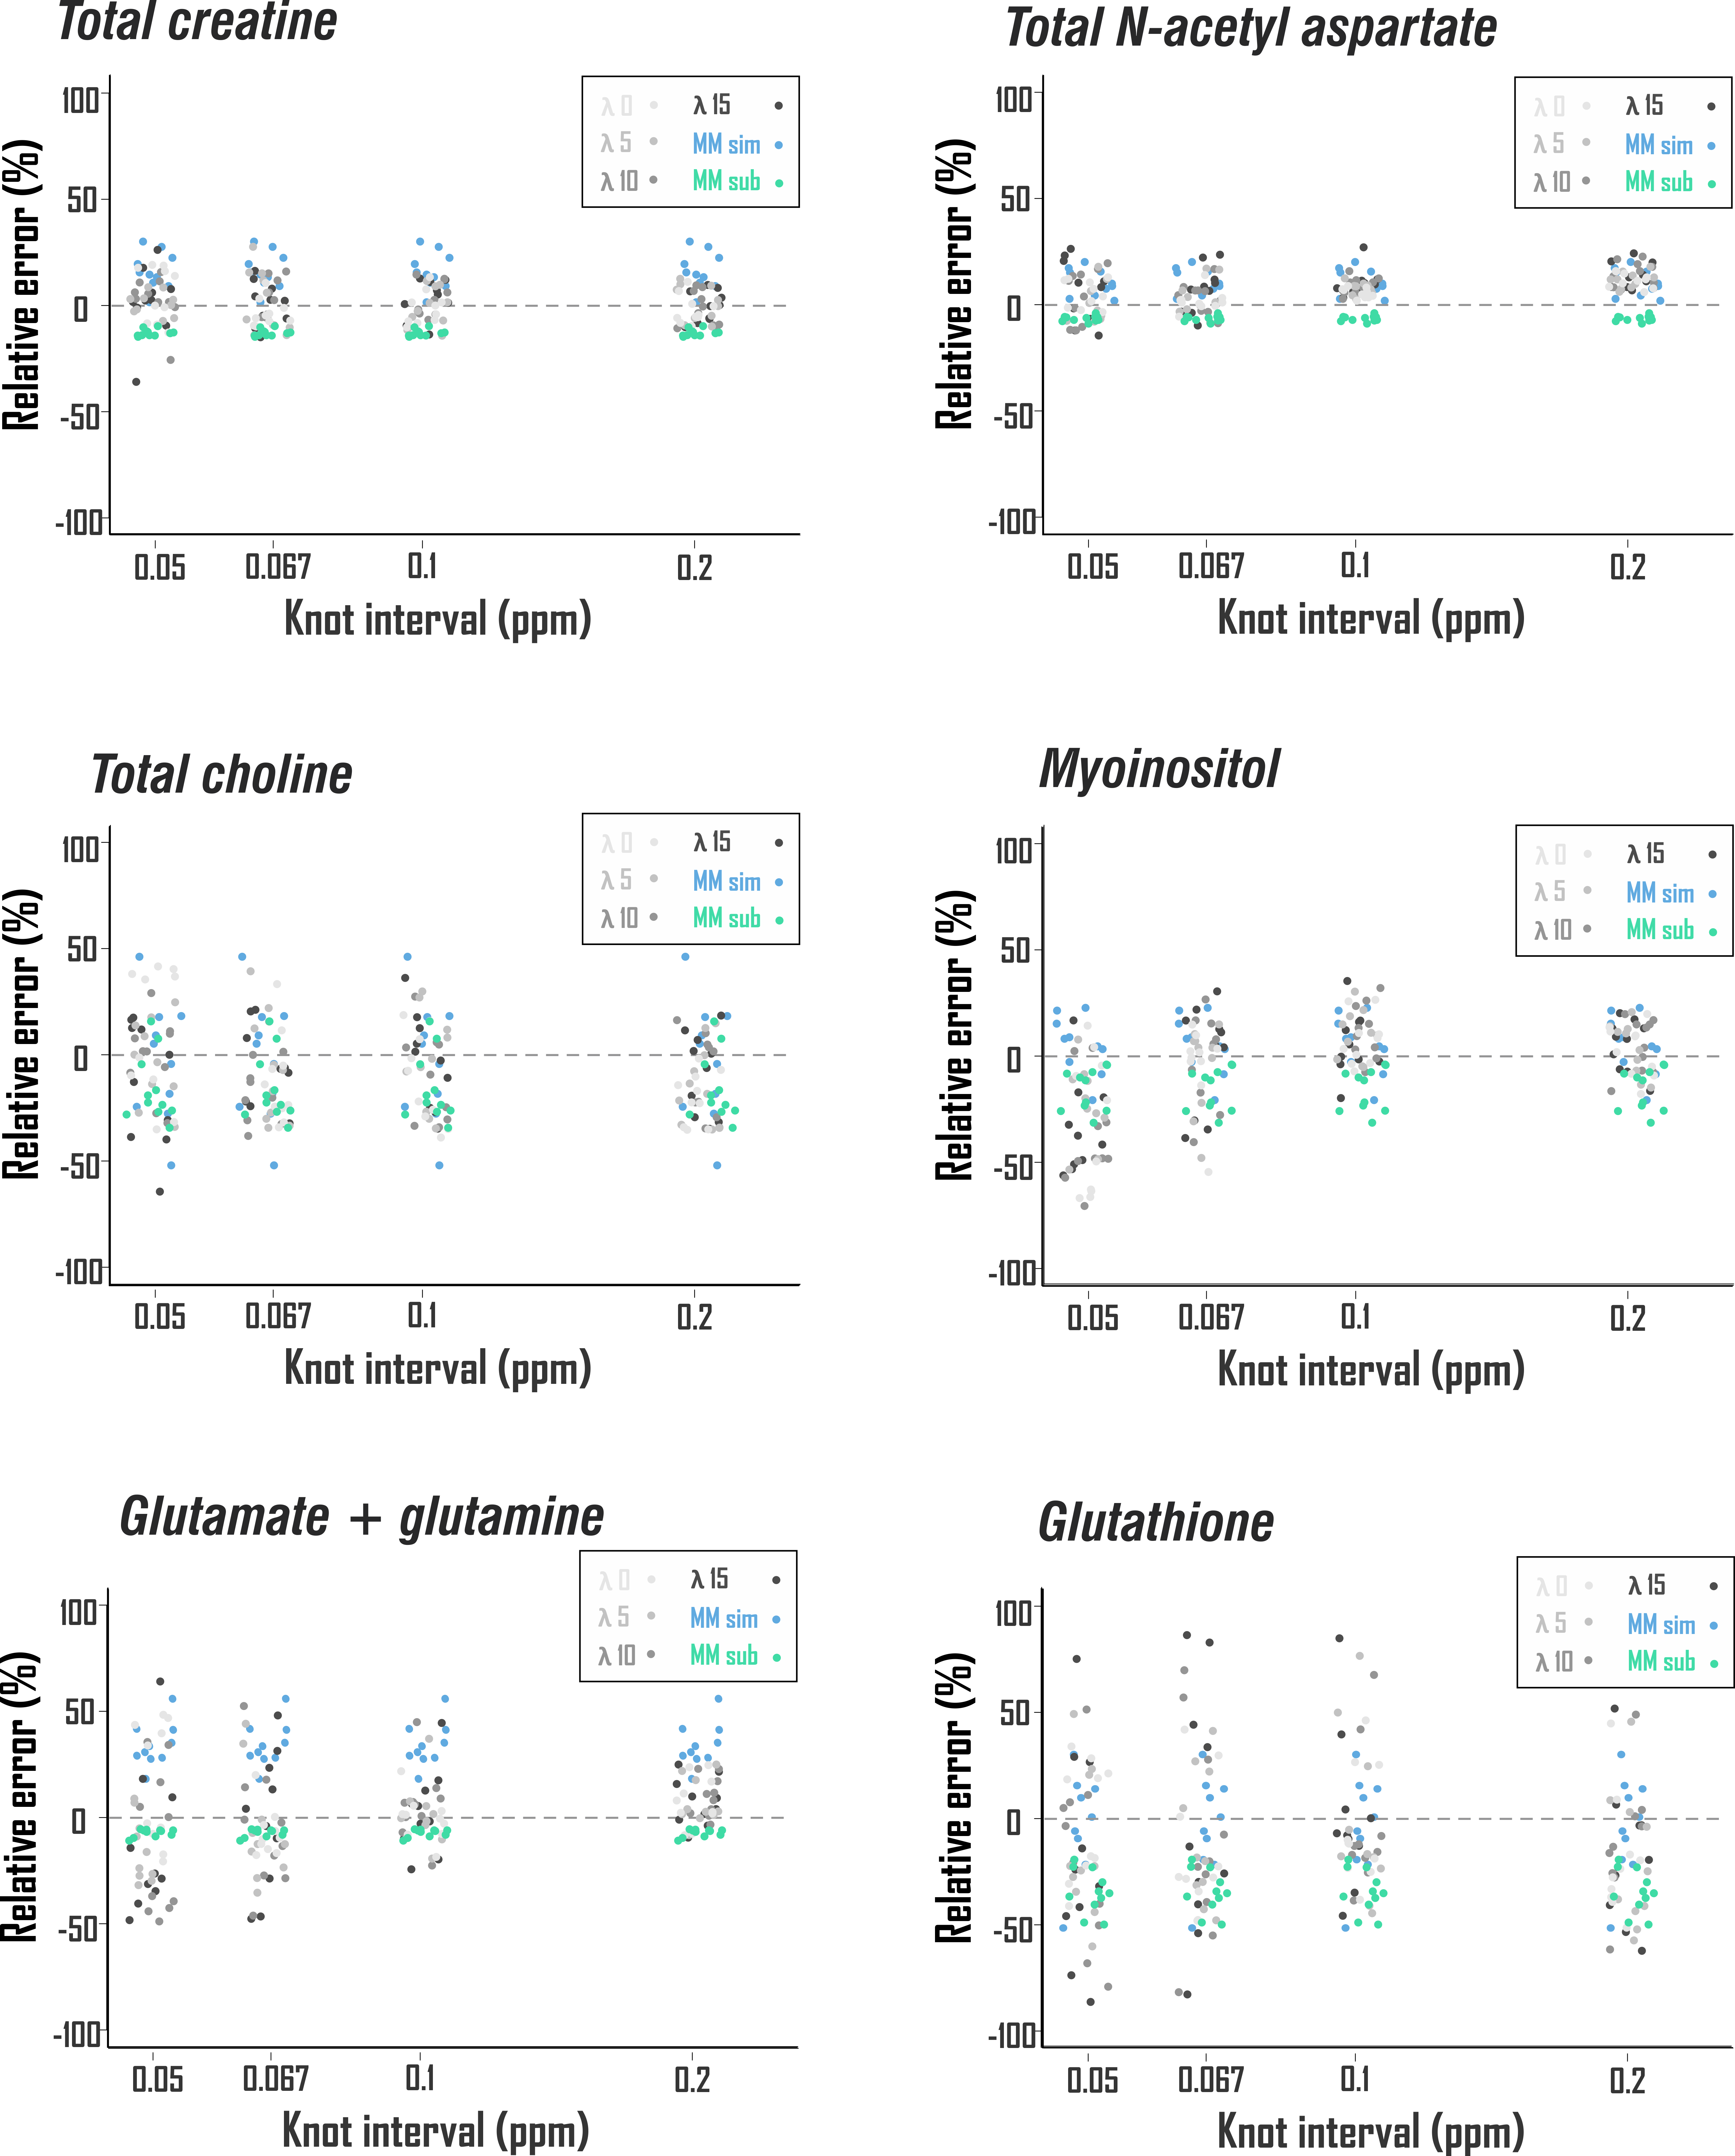
Second, to examine metabolite quantification accuracy, the same models were used to fit an in vivo-like sLASER spectrum of known metabolite scaling and a sample cleaned prefrontal cortex macromolecule baseline from the previously described data set, with ten predefined patterns of complex Gaussian noise generating low SNR (55 from the 2.01-ppm N-acetyl aspartate 2CH3). Relative errors of fit results were calculated against known metabolite scalings (Fig. 2E) and compared among baseline models.
Results
Spline fit residuals generally exceeded those using other baseline models, increasing with λ (Fig. 3A, 4). Modeled baseline differences from corresponding metabolite-nulled acquisitions were, however, greater than suggested by fit residuals, especially for simulated macromolecule baselines (Fig. 3B, 4). This corresponded to overestimations of key metabolites, more pronounced in fits with simulated macromolecules than splines for total creatine (two-tailed t-test p<0.001), glutamate (p<0.001), and myoinositol (p<0.05), while systematic metabolite underestimations were observed in fits to noisy data that first subtracted fitted metabolite-nulled acquisitions (Fig. 5).Conclusions
Combining the utility of in vivo measurements with the perfect knowledge of simulated gold standards, we show:- Baselines of simulated macromolecules do not necessarily outperform splines in either macromolecule or metabolite prediction accuracy, despite some expected T1-based macromolecule amplitude differences between metabolite-inclusive and -nulled acquisitions;
- Quantification pipelines employing prior knowledge from metabolite-nulled acquisitions exhibited superior metabolite fit accuracy among baseline models tested;
- All models exhibited systematic quantification error against noisy data with in vivo baselines. Notably, our observation of N-acetyl aspartate overestimation by splines with fewer knots agrees with previous analysis of low-SNR data despite differing acquisition and validation paradigms1.
Taken together, these findings underline both the feasibility of and critical need for spectral quantification pipelines informed by rigorous validation against meaningful but well characterized standards, especially for in vivo experiments that cannot be corrected by dedicated metabolite-nulled acquisitions.
Acknowledgements
This work was funded by the Technical Development Grant Program for MR Studies of the Zuckerman Mind Brain Behavior Institute at Columbia University and performed at the Zuckerman Mind Brain Behavior Institute MRI Platform, a shared resource. In vivo measurements were conducted in accordance with Columbia University Institutional Review Board protocol AAAQ9641.References
1. Kreis R, Boesch C. Bad spectra can be better than good spectra. Proc Intl Soc Mag Reson Med 2003:11.
2. Swanberg KM, Prinsen H, Juchem C. Spectral quality differentially affects apparent metabolite concentrations as estimated by linear combination modeling of in vivo magnetic resonance spectroscopy data at 7 Tesla. Proc Int Soc Magn Reson Med 2019:4237.
3. Cudalbu C, Beuf O, Cavassila S. In vivo short echo time localized H-1 MRS of the rat brain at 7 T: Influence of two strategies of background-accommodation on the metabolite concentration estimation using QUEST. J Signal Process Sys 2009;55(1-3):25-34.
4. Zhang Y, Shen J. Smoothness of in vivo spectral baseline determined by mean-square error. Magn Reson Med 2014;72(4):913-922.
5. Sanaei Nezhad F, Anton A, Parkes LM, Deakin B, Williams SR. Quantification of glutathione in the human brain by MR spectroscopy at 3 Tesla: Comparison of PRESS and MEGA-PRESS. Magn Reson Med 2017;78(4):1257-1266.
6. Bartha R, Drost DJ, Williamson PC. Factors affecting the quantification of short echo in-vivo 1H MR spectra: prior knowledge, peak elimination, and filtering. NMR Biomed 1999;12(4):205-216.
7. Prinsen H, de Graaf RA, Mason GF, Pelletier D, Juchem C. Reproducibility measurement of glutathione, GABA, and glutamate: Towards in vivo neurochemical profiling of multiple sclerosis with MR spectroscopy at 7T. J Magn Reson Imaging 2017;45(1):187-198.
8. Giapitzakis IA, Borbath T, Murali-Manohar S, Avdievich N, Henning A. Investigation of the influence of macromolecules and spline baseline in the fitting model of human brain spectra at 9.4T. Magn Reson Med 2019;81(2):746-758.
9. Larsen RJ, Newman M, Nikolaidis A. Reduction of variance in measurements of average metabolite concentration in anatomically-defined brain regions. J Magn Reson 2016;272:73-81.
10. Bhogal AA, Schur RR, Houtepen LC, van de Bank B, Boer VO, Marsman A, Barker PB, Scheenen TWJ, Wijnen JP, Vinkers CH, Klomp DWJ. (1) H-MRS processing parameters affect metabolite quantification: The urgent need for uniform and transparent standardization. NMR Biomed 2017;30(11).
11. Cudalbu C, Mlynarik V, Gruetter R. Handling macromolecule signals in the quantification of the neurochemical profile. J Alzheimers Dis 2012;31:S101-S115.
12. Juchem C. INSPECTOR - Magnetic Resonance Spectroscopy Software. http://innovation.columbia.edu/technologies/cu17130_inspector-magnetic-resonance-spectroscopy-software-for-optimized-data-extraction
13. Pfeuffer J, Juchem C, Merkle H, Nauerth A, Logothetis NK. High-field localized 1H NMR spectroscopy in the anesthetized and in the awake monkey. J Magn Reson Imaging 2004;22(10):1361-1372.
14. Landheer K, Juchem C. Dephasing optimization through coherence order pathway selection (DOTCOPS) for improved crusher schemes in MR spectroscopy. Magn Reson Med 2019;81(4):2209-2222.
15. Landheer K, Juchem C. Simultaneous optimization of crusher and phase cycling schemes for magnetic resonance spectroscopy: an extension of dephasing optimization through coherence order pathway selection. Magn Reson Med 2019;83(2):391-402.
16. Landheer K, Swanberg KM, Juchem C. Magnetic resonance spectrum simulator (MARSS), a novel software package for fast and computationally efficient basis set simulation. NMR Biomed 2019;e4129 [Epub ahead of print].
17. Provencher SW. Estimation of metabolite concentrations from localized in-vivo proton Nmr-spectra. Magn Reson Med 1993;30(6):672-679.
18. Behar KL, Rothman DL, Spencer DD, Petroff OA. Analysis of macromolecule resonances in 1H NMR spectra of human brain. Magn Reson Med 1994;32(3):294-302.
19. Mlynarik V, Gruber S, Moser E. Proton T-1 and T-2 relaxation times of human brain metabolites at 3 Tesla. NMR Biomed 2001;14(5):325-331.
Figures