2855
Optimized truncation to integrate multi-channel MRS data using rank-R singular value decomposition (OpTIMUS)1Department of Biomedical Engineering, Georgia Institute of Technology and Emory University, Atlanta, GA, United States, 2Department of Biostatistics and Bioinformatics, Emory University, Atlanta, GA, United States, 3Department of Radiology and Imaging Sciences, Emory University School of Medicine, Atlanta, GA, United States, 4MR R&D Collaborations, Siemens Healthcare, Los Angeles, CA, United States
Synopsis
Multi-channel phased array coils facilitate acquisition of fast, localized, and high signal-to-noise ratio (SNR) magnetic resonance spectroscopy (MRS) data. As individual spectra are acquired from multiple coil channels, it is necessary to combine these data to form a final spectrum. Here, we present an improved approach for combining multi-channel phased array data using spectral windowing followed by a rank-R singular value decomposition (SVD). Our approach, termed ‘OpTIMUS’ was evaluated using SNR and compared to combination methods including whitened SVD (WSVD), S/N2 weighting, and the vendor-supplied reconstruction. OpTIMUS generated the highest SNR across all methods.
Introduction
The use of multi-channel phased-array coils is increasingly common in both MRI and MRS to maximize SNR while reducing acquisition time.1,2 A key post-processing step when using phased-array coils for MRS acquisition is the combination of spectra from individual coil channels. Data-driven methods have shown promise in determining optimized coil combination parameters.3 Here, we present a data-driven approach called OpTIMUS (optimized truncation to integrate multi-channel MRS data using rank-R singular value decomposition) that uses noise-whitened windowed spectra along with an iterative rank-R SVD. We observe significantly higher SNR over previously reported methods including the vendor-supplied reconstruction.Methods
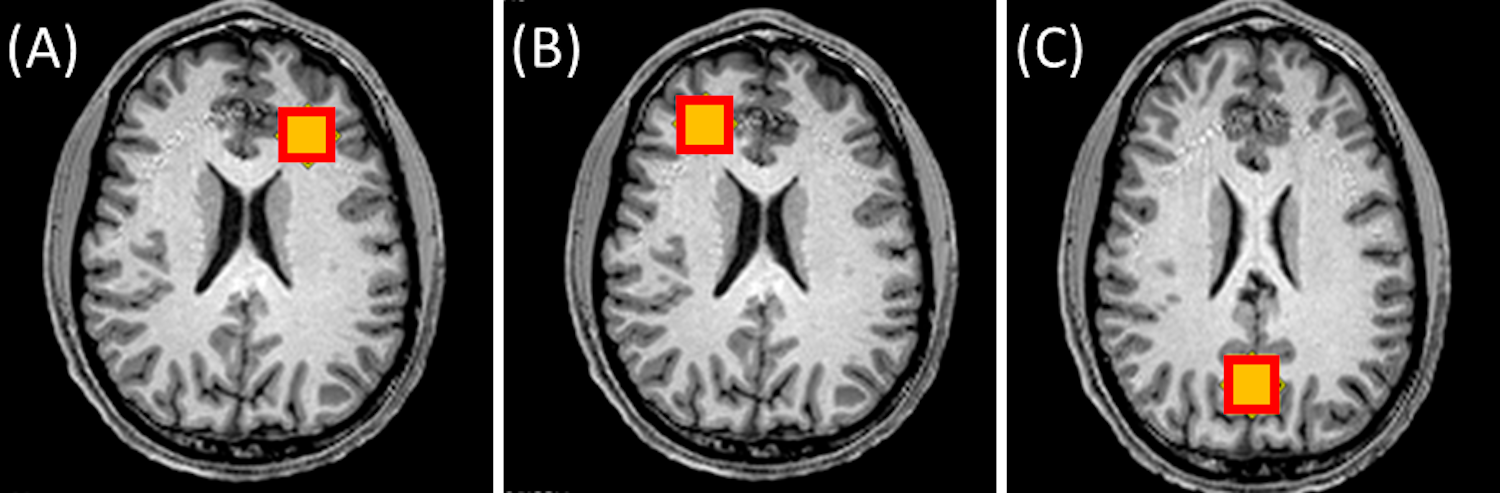
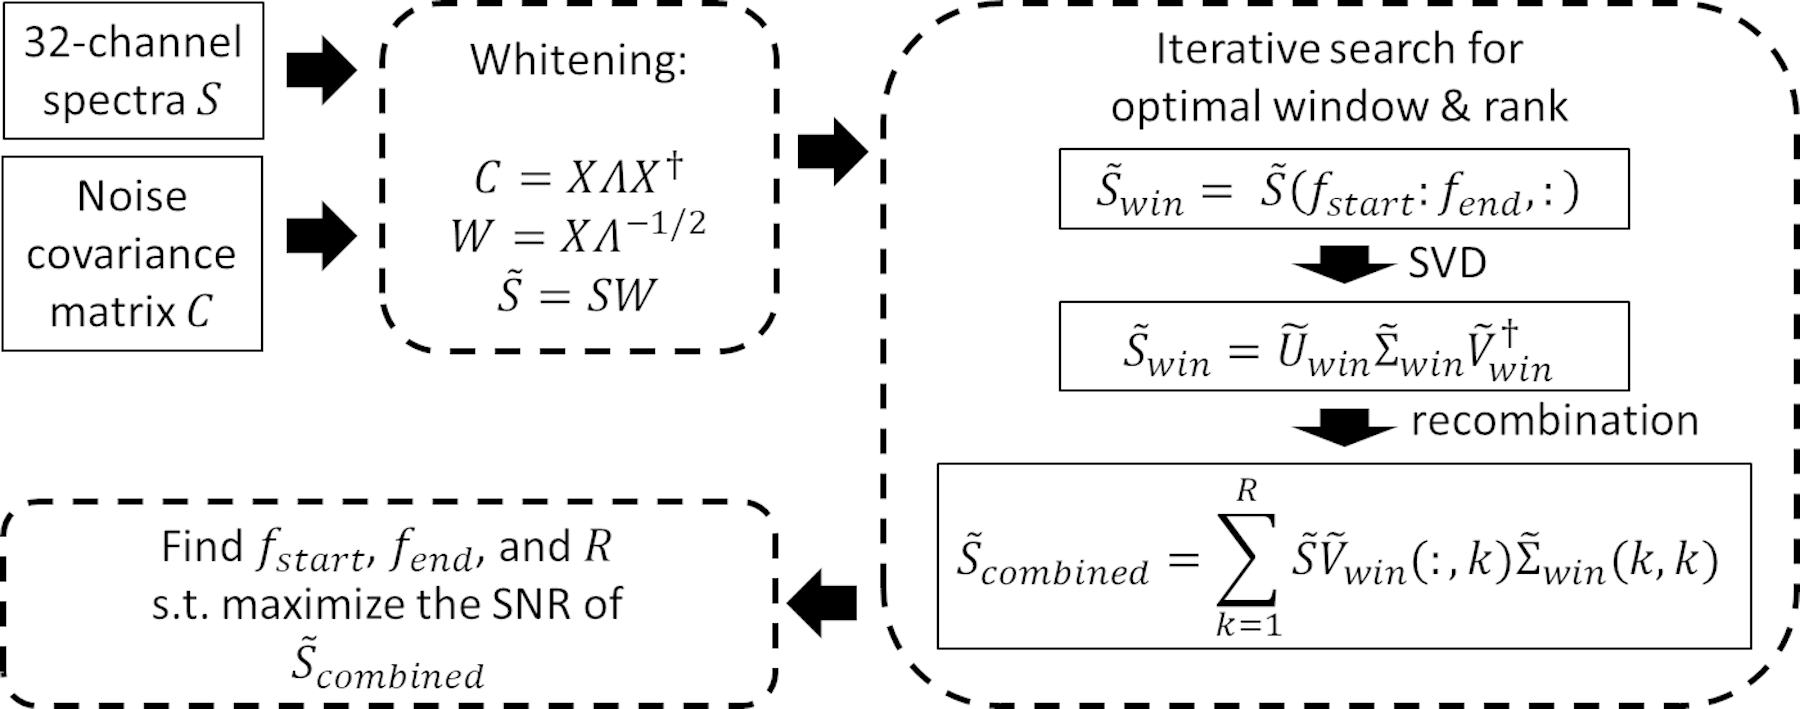
MR data was acquired in 11 healthy volunteers (1 female, mean age ± standard deviation = 24 ± 5 years old) after approval by the local institutional review board. Written informed consent was obtained from each subject. MR experiments were performed on a 3T MR scanner (MAGNETOM PrismaFit, Siemens Healthcare, Erlangen, Germany) with a 32-channel phased array head coil (Siemens Healthcare, Erlangen, Germany). A T1-weighted magnetization-prepared rapid gradient-echo (MPRAGE) sequence (TR/TI/TE=2300/900/3.39ms, flip angle=9°, FOV=256mm×256mm, matrix size=192×192, slices per slab=160, slice thickness=1mm) was used to position the 1H MRS voxel. Single voxel MRS was acquired using the PRESS sequence (TR/TE=1700/35ms, complex data points=1024, bandwidth=1200Hz, averages=128, voxel size=2×2×2cm3) in the left frontal white matter (LFWM), right frontal white matter (RFWM), and posterior cingulate cortex (PCC) (Figure 1).OpTIMUS relies on three key steps: noise whitening, spectral windowing, and rank-R SVD. First, principal component analysis (PCA)-based whitening was applied to remove correlated noise.4 The whitening matrix was computed using the noise covariance matrix from a scan acquired with the transmission voltage set to zero. After whitening, an iterative brute force search was performed to find the optimal window size and rank size that maximize SNR of the combined spectrum. SVD was then used to determine the optimal coil weights. Figure 2 shows the overall schematic of the OpTIMUS method. SNR calculated from spectra reconstructed using OpTIMUS, WSVD,3 S/N2 weighting,5 and the vendor-supplied reconstruction were compared. SNR was calculated using the maximum value of the N-acetylaspartate (NAA) peak divided by the standard deviation of a noise-only region (8.43 – 9.34 ppm). A linear mixed model was fit with Kenward-Roger’s approximation of the degrees of freedom and p-values were corrected for multiple comparisons using the false discovery rate.6
Results
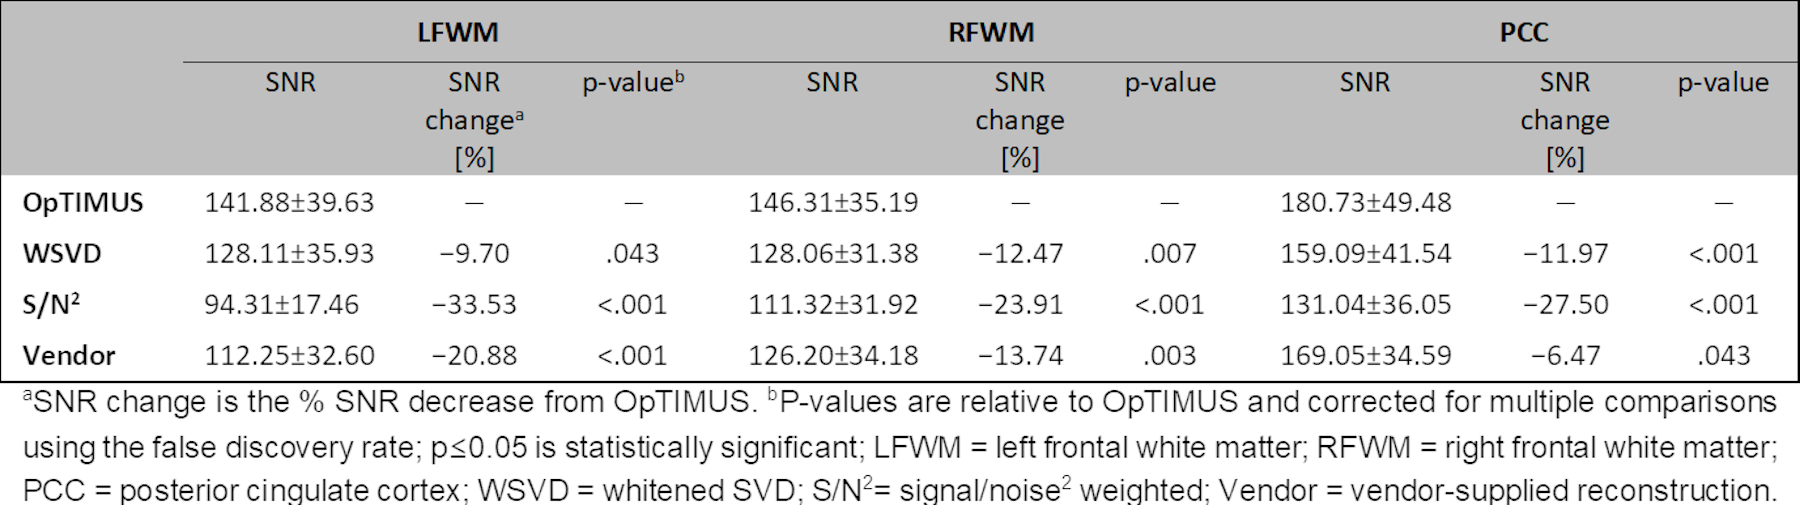
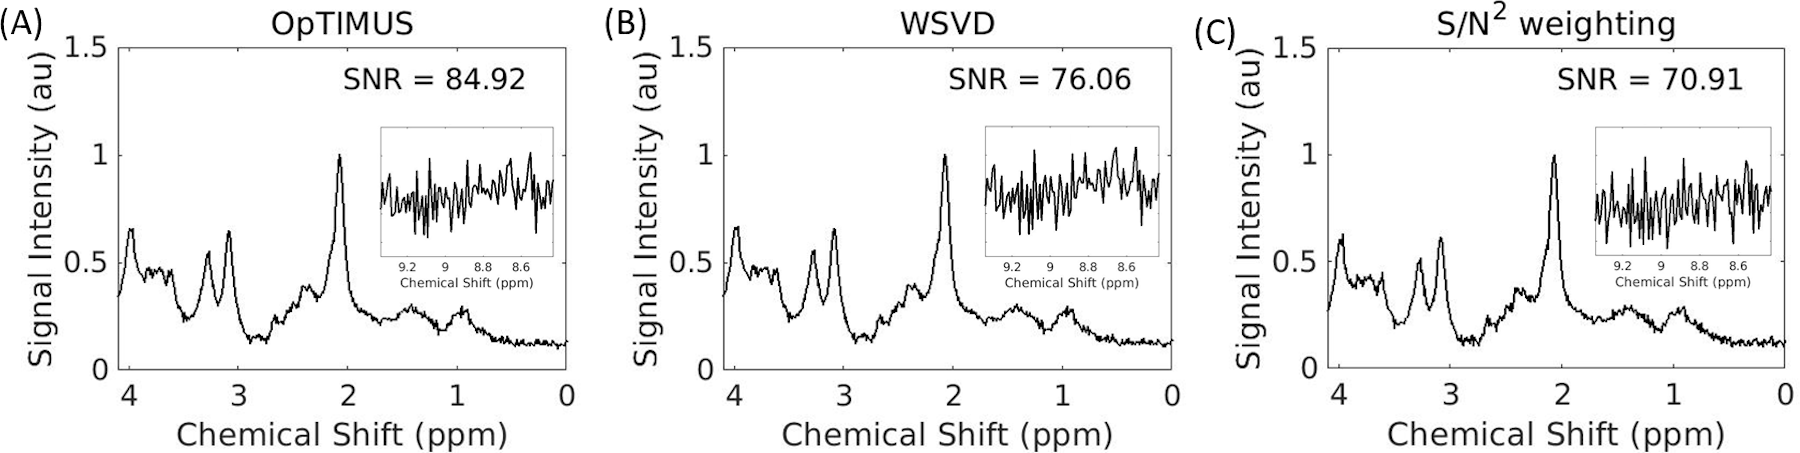
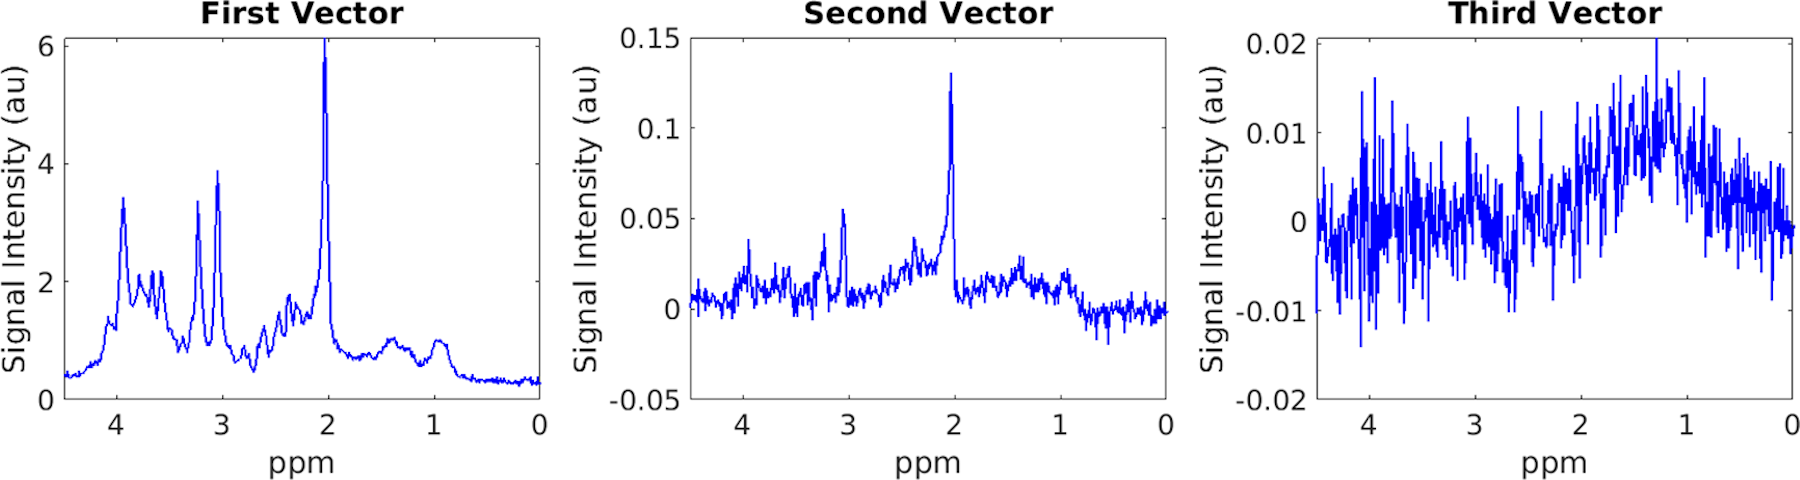
SNR of spectra combined using each of the four methods are shown in Table 1. Spectral combination with OpTIMUS resulted in significantly higher SNR for all voxels (p≤0.05). Figure 3 shows representative in vivo spectra that were reconstructed using three different combination methods after NAA peak-based normalization. Insets represent the expanded noise region (8.43 – 9.34 ppm). Although the reconstructed spectra look similar, the noise variation of the OpTIMUS spectrum was smaller than that of the WSVD spectrum and the S/N2 spectrum, resulting in a higher overall SNR. Figure 4 shows the first three singular vectors following rank-R WSVD on an unwindowed in vivo spectral data set, demonstrating the presence of metabolite signal in higher order vectors.Discussion
In this study we present OpTIMUS, a method that uses whitening to remove correlated noise, followed by SVD on windowed spectra, and final recombination by summing R (≥1) singular vectors. The optimality of a rank-1 reconstruction depends on the assumption that the noise is perfectly whitened, which may not be true in practice. Empirically, identifiable signal peaks are present in other singular vectors (Figure 4), which motivates the use of information from the rank-R decomposition in OpTIMUS. A second distinct feature of OpTIMUS is the use of spectral windowing prior to SVD, which may be more effective in maximizing the SNR of the final combined spectrum. These results are consistent with recent reports demonstrating the utility of a rank-R SVD approach for better reconstruction of noise-contaminated images or signals.7-9Conclusions
We present a novel approach, termed OpTIMUS, for the combination of MR spectra acquired from multi-channel phased receive arrays. OpTIMUS utilizes spectral windowing and rank-R decomposition to estimate the coil channel weights. Significant increases in SNR (p≤0.05) were observed with OpTIMUS compared to previously reported methods including the vendor-supplied reconstruction.Acknowledgements
This work was supported in part by NIH 5R01CA203388. MR experiments were facilitated by the Emory Center for Systems Imaging Core.References
1. Deshmane A, Gulani V, Griswold MA, Seiberlich N. Parallel MR imaging. J Magn Reson Imaging. 2012;36(1):55-72.
2. Abdoli A and Maudsley AA. Phased-array combination for MR spectroscopic imaging using a water reference. Magn Reson Med. 2016;76(3):733-741.
3. Rodgers CT and Robson MD. Coil combination for receive array spectroscopy: Are data-driven methods superior to methods using computed field maps? Magn Reson Med. 2016;75(2):473-487.
4. Kessy A, Lewin A, Strimmer K. Optimal whitening and decorrelation. Am Stat. 2018;72(4):309-314.
5. Hall EL, Stephenson MC, Price D, Morris PG. Methodology for improved detection of low concentration metabolites in MRS: optimised combination of signals from multi-element coil arrays. Neuroimage. 2014;86:35-42.
6. Benjamini Y and Hochberg Y. Controlling the false discovery rate: A practical and powerful approach to multiple testing. J R Statist Soc B. 1995;57(1):289-300.
7. Candès EJ, Sing-Long CA, Trzasko JD. Unbiased risk estimates for singular value thresholding and spectral estimators. IEEE Trans Signal Process. 2013;61(19):4643-4657.
8. Barash D and Gavish M. Optimal shrinkage of singular values under random data contamination. In Proceedings of the 31st International Conference on Neural Information Processing Systems, Long Beach, California, USA. 2017.
9. Gol GD and Potter LC. A subspace-based coil combination method for phased-array magnetic resonance imaging. Magn Reson Med. 2016; 75(2): 762-774.
Figures