2853
Comparison of 3T proton brain spectra quantified with basis sets simulated using experimental and ideal pulses1Russell H. Morgan Department of Radiology and Radiological Science, The Johns Hopkins University, School of Medicine, Baltimore, MD, United States, 2F. M. Kirby Research Center for Functional Brain Imaging, Kennedy Krieger Institute, Baltimore, MD, United States, 3Sir Peter Mansfield Imaging Centre, School of Physics and Astronomy, University of Nottingham, Nottingham, United Kingdom
Synopsis
The most common method for proton MRS quantification is the linear combination of model basis spectra. Typically, these model spectra are simulated using density matrix formalism. Here we aimed to compare the quantification using two basis sets with full localization and real RF pulses and one basis set with non-localized ideal RF pulses. Statistically significant differences were found between metabolite concentrations quantified in LCModel with different basis sets. Whereas two models that used localized real RF pulses were not significantly different for the major metabolites, the ideal basis set differed in concentration for all metabolites except NAA.
Aim
To compare quantification of 1H-MRS brain spectra using basis sets created in two different software packages that fully simulate spatial localization effects, and a basis set created with ideal RF pulses without localization.Introduction
Spectral quantification represents a crucial portion of an MRS experiment. One of the most widespread methods in 1H-MRS involves fitting the spectrum to a linear combination of model basis spectra that are typically simulated using the density matrix formalism. Multiple software packages are available for simulation of MRS basis spectra1–4. These are all capable of importing user-defined RF pulses and gradient waveforms thus enabling simulations that reflect spatial variations of the simulated basis spectra within the localized volume. This is particularly important for quantification of J-coupled metabolites5,6. Whereas the physical principles of all numerical simulations are the same (i.e. quantum mechanical density matrix formalism), the implementations vary substantially. In addition, the combination of individually simulated metabolite moieties into a basis spectrum and the scaling of the basis spectra is also software-specific and may affect quantified results. This abstract reports on the comparison of quantification of 1H-MRS PRESS data using two basis sets created in two different software packages incorporating spatial localization effects, and also a basis set simulated with non-localized ideal RF pulses.Methods
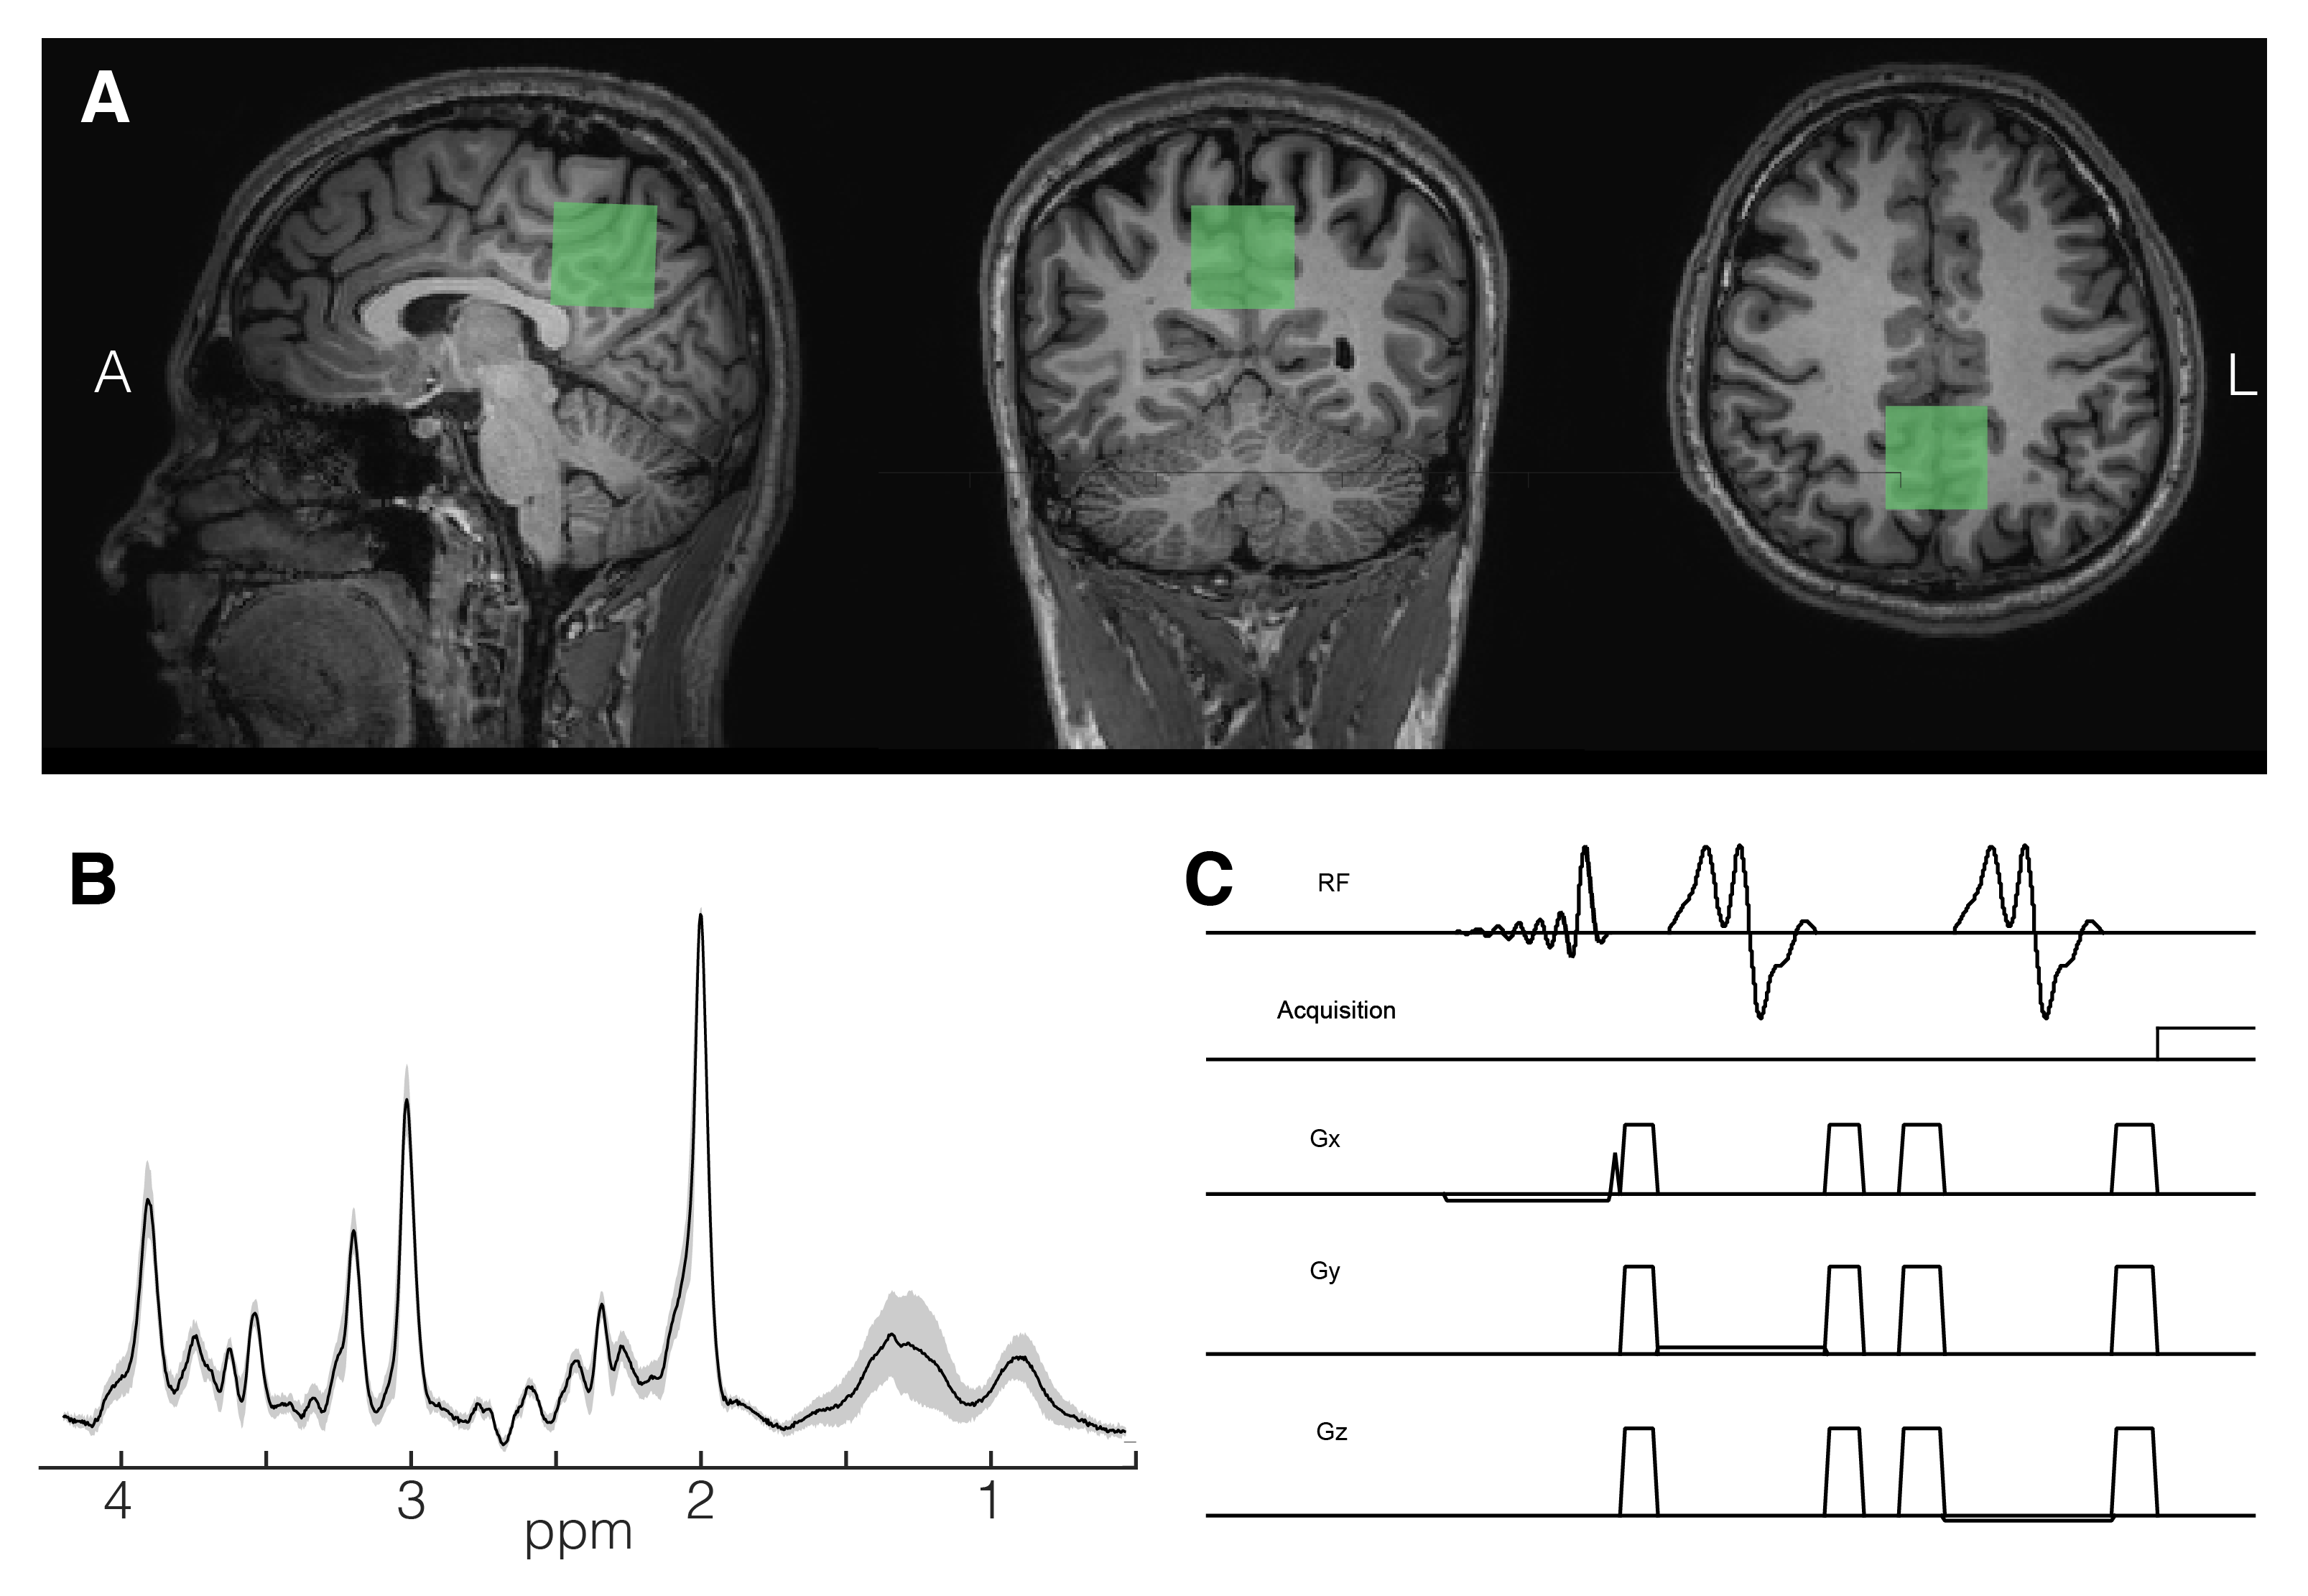
Spectra from a mid-parietal voxel (3x3x3 cm3, Fig.1A) were recorded from 12 healthy volunteers (7M/5F; mean age = 29 yrs) on a 3T Philips Ingenia scanner with a 1Tx/32Rx head coil using the vendor-supplied PRESS sequence (Fig.1C) with the following parameters: TE/TR=35/2000ms; spectral width=2kHz; NT=64; 2048 data points and VAPOR water suppression. Water unsuppressed data were acquired with similar parameters and NT=8. Spectra were pre-processed using an automated in-house developed script based on FID-A1 and quantified in the range 0.5 to 4.2 ppm with LCModel version 6.37. The quantified results were corrected for CSF and tissue fraction. RF numerically optimized refocusing pulses (6.9 ms ‘gtst1203’; B1max,13.5μT;bandwidth,1.26kHz) phase cycling, delays and crusher gradient schemes were implemented based on the experimental PRESS sequence in FID-A1 and MARSS2. In MARSS, the excitation pulse (7.1 ms asymmetric sinc) was also part of the simulation. Chemical shifts and J-coupling constants of 19 metabolites were obtained from Govindaraju8 and Near9. The 30x30x30 mm3 voxel was simulated with the 5kHz simulation bandwidth and 4096 points at 40x40x40 spatial locations, which were summed together after simulation. The reference peak at 0 ppm necessary for LCModel analysis was also modeled in the corresponding packages. Additionally, one ‘non-localized’ basis set was created assuming ideal (instantaneous) RF pulses using our in-house script. The mean metabolite concentrations were compared in SPSS 22 with repeated measures ANOVA with Greenhouse-Geisser correction. A post-hoc test with Bonferroni correction was used for pairwise comparison.Results
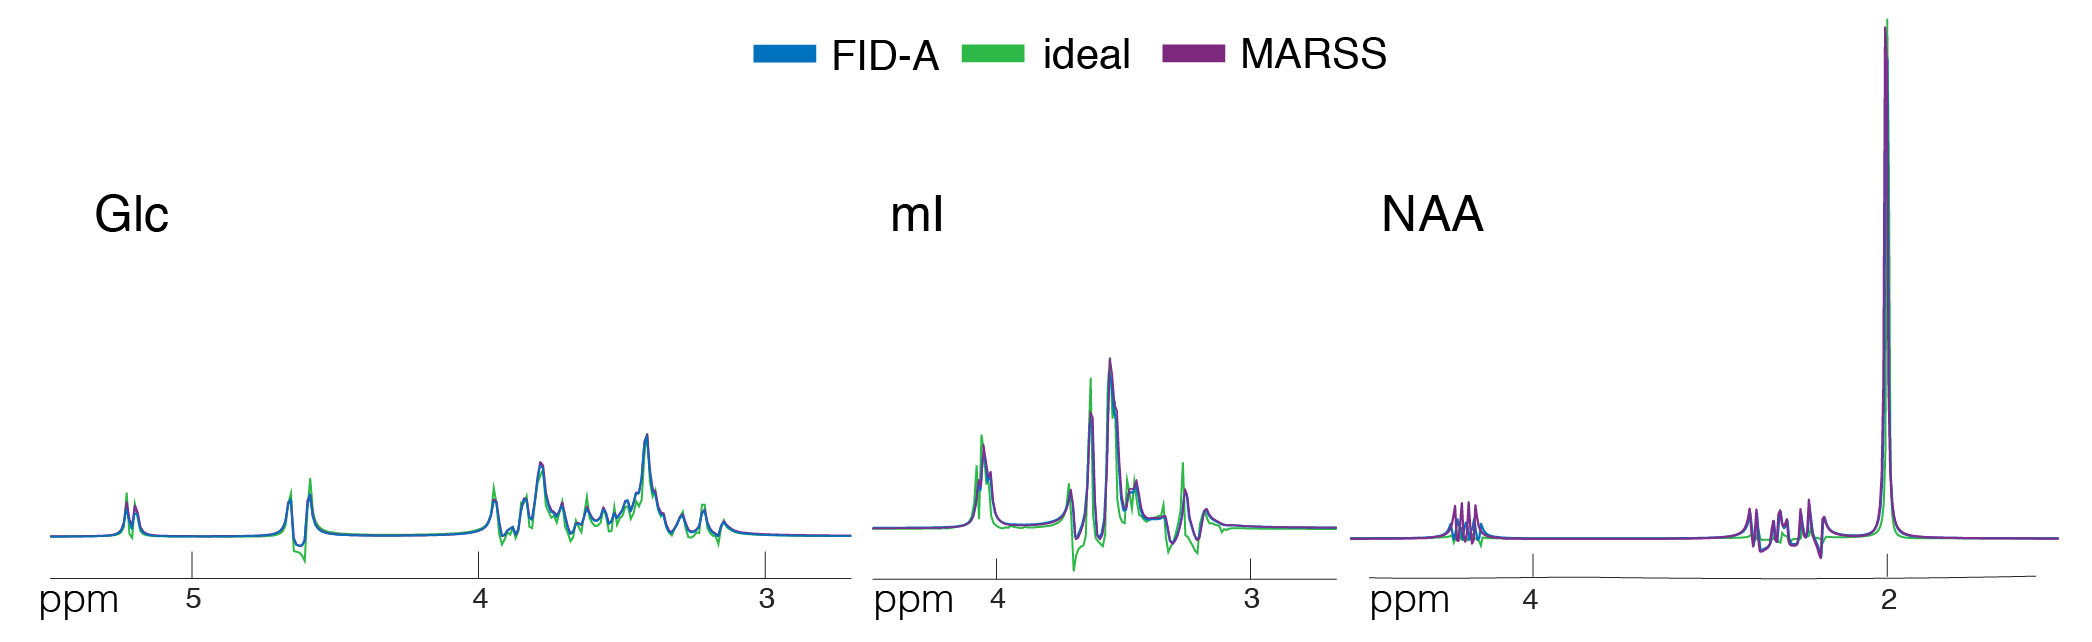
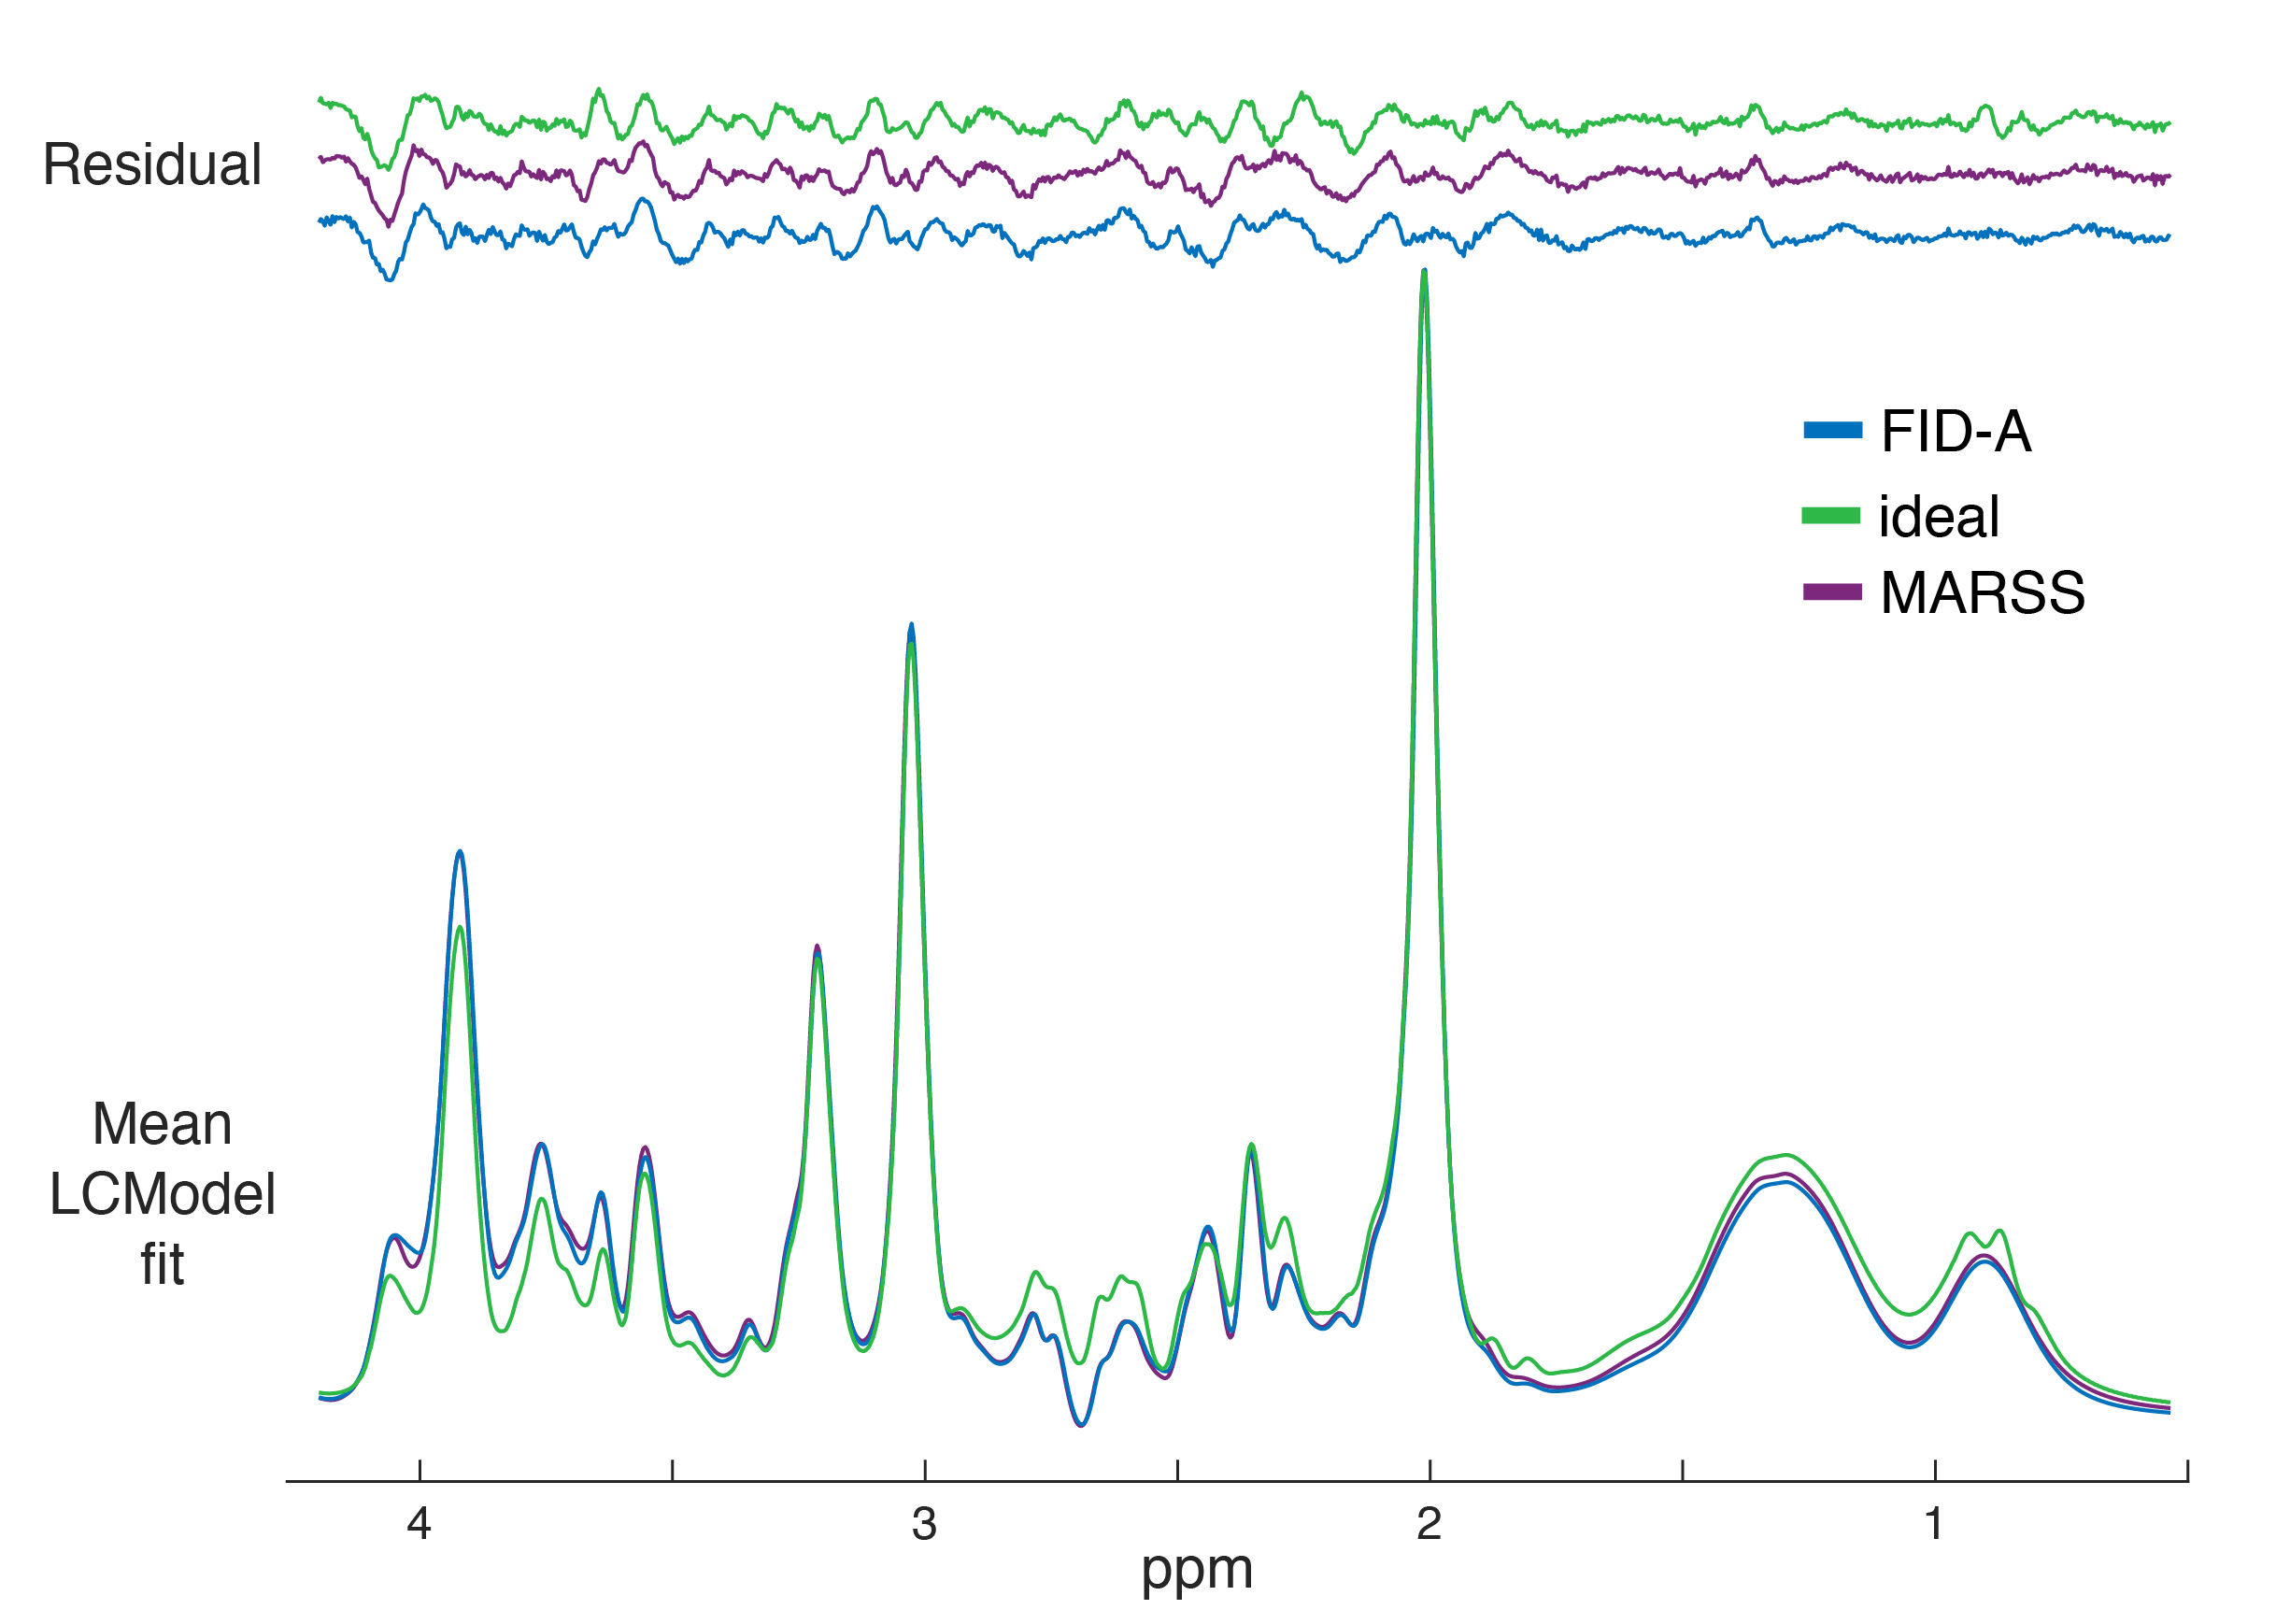
Acquired spectra showed high SNR and low variability between volunteers (Fig.1B). The profile of the spectral fits was qualitatively similar between “FID-A” and “MARSS” simulation (Fig.2). More prominent differences were observed for the ideal simulation, especially for J-coupled metabolites (Fig.2;glucose,myo-inositol). This is also reflected in the comparison between average fits, where 4ppm-3.5ppm and 2.9ppm-2.2ppm regions are the most affected (Fig.3). GABA, glutamine, gluthathione, phosphorylethanolamine and total choline were significantly different for all three basis sets (all p<0.005)(Fig.4A). Quantification with the Ideal basis set yielded metabolite levels significantly different in all but one metabolite (NAA; ideal vs. FID-A, p=0.135; ideal vs. MARSS, p=0.28). Cramer-Rao Lower Bounds were below 10% for 7 quantified metabolites (Fig.4B).Discussion
Statistically significant differences were found between metabolite concentrations quantified in LCModel with basis sets simulated using three different methods. Results quantified with FID-A and MARSS basis sets were similar for major metabolites (i.e. tNAA,tCr,mI,Glx,Glu, but not tCho). The ideal basis set differed in concentration for all but one (NAA) metabolite. It was previously shown, that an ideal simulation may not be sufficient for accurate quantification5,10, which may explain the concentration differences of ideal basis set reported herein. The small bandwidth of the refocusing pulses is reflected in a relatively high chemical shift displacement (at 3T, 26% between water and NAA in one direction), which may exacerbate the spatial effects in the measured spectrum. These effects become more severe at ultra-high fields, in sequences with more pulses, or with spectrally selective pulses6. The differences in concentration found for some minor metabolites quantified with FID-A and MARSS remain unclear. MARSS simulation includes excitation effects as well, which may better model the chemical shift displacement artefact across the excitation direction. The difference in scaling of the individual moieties before construction of the basis set – such as glycerophosphorylcholine and phosphorylcholine in the signal of total choline may be another factor, but further investigation is needed. Future work will focus on comparing other software packages used for basis set simulation as well as better analysis of the discrepancies found for the compared packages.Acknowledgements
No acknowledgement found.References
1. Simpson, R., Devenyi, G. A., Jezzard, P., Hennessy, T. J. & Near, J. Advanced processing and simulation of MRS data using the FID appliance (FID-A) - An open source, MATLAB-based toolkit. Magn Reson Med 77, 23–33 (2017).
2. Landheer, K., Swanberg, K. M. & Juchem, C. Magnetic resonance Spectrum simulator (MARSS), a novel software package for fast and computationally efficient basis set simulation. NMR Biomed 1–13 (2019). doi:10.1002/nbm.4129
3. Soher, B., Semanchuk, D., Todd, D., Steinberg, J. & Young, K. VeSPA: Integrated applications for RF pulse design, spectral simulation and MRS data analysis. Proc 19th Annu Meet ISMRM 19, 1410 (2011).
4. Jr, Z. S., Starčuková, J., Štrbák, O. & Graveron-Demilly, D. Simulation of coupled-spin systems in the steady-state free-precession acquisition mode for fast magnetic resonance (MR) spectroscopic imaging. Meas Sci Technol 20, 104033 (2009).
5. Thompson, R. B. & Allen, P. S. Sources of variability in the response of coupled spins to the PRESS sequence and their potential impact on metabolite quantification. Magn Reson Med 41, 1162–1169 (1999).
6. Kaiser, L. G., Young, K. & Matson, G. B. Numerical simulations of localized high field 1H MR spectroscopy. J Magn Reson 195, 67–75 (2008).
7. Provencher, S. W. Estimation of metabolite concentrations from localized in vivo proton NMR spectra. Magn Reson Med 30, 672–679 (1993).
8. Govindaraju, V., Young, K. & Maudsley, a a. Proton NMR chemical shifts and coupling constants for brain metabolites. NMR Biomed 13, 129–53 (2000).
9. Near, J., Evans, C. J., Puts, N. A. J., Barker, P. B. & Edden, R. A. E. J-difference editing of gamma-aminobutyric acid (GABA): Simulated and experimental multiplet patterns. Magn Reson Med 70, 1183–1191 (2013).
10. Thompson, R. B. & Allen, P. S. Response of metabolites with coupled spins to the STEAM sequence. Magn Reson Med 45, 955–965 (2001).
Figures