2852
Influence of parametrized MM and spline baseline in LCModel using in-vivo rat brain 1H-MR spectra and Monte Carlo simulations at 9.4T
Dunja Simicic1,2, Veronika Rackayova1, Lijing Xin1, Bernard Lanz2, and Cristina Cudalbu1
1CIBM, EPFL, Lausanne, Switzerland, 2LIFMET, EPFL, Lausanne, Switzerland
1CIBM, EPFL, Lausanne, Switzerland, 2LIFMET, EPFL, Lausanne, Switzerland
Synopsis
Reliable detection, post-processing and fitting of MM is crucial for quantifying short-TE 1H-MR brain spectra. In general, an in-vivo acquired full-MM spectrum is included in the basis-set together with a relatively free spline baseline (i.e.LCModel). Availability of high magnetic fields (better resolved in-vivo MM) lead to a need for more sophisticated approaches such as MM parametrization. Furthermore, effect of the stiffness of fitted baseline on the resulting metabolite concentrations gained a lot of interest. We compared parametrized and full-MM basis-sets, with varying DKNTMN to assess the resulting changes in metabolite concentrations (in-vivo rat brain 1H-MRS and Monte-Carlo simulations at 9.4T).
Introduction
Reliable detection, post-processing and fitting of mobile macromolecules (MM) is crucial for quantifying short-TE 1H-MR brain spectra. In general, an in-vivo acquired full MM spectrum is included in the basis-set1 together with a relatively free spline baseline to address unpredictable spectral components2(i.e. LCModel3). The ‘baseline’ consists of smoothly varying components and spurious signals arising through imperfections during data acquisition. The availability of high magnetic fields lead to better resolved MM in-vivo, thus more sophisticated approaches need to be used for eliminating the metabolite residuals or parametrizing the acquired MM in individual components4. Furthermore, the effect of the stiffness of the fitted spline baseline on the resulting metabolite concentrations gained a lot of interest5. As such, recent 7T clinical studies showed that the parametrization of MM with appropriate soft-constrains is feasible, with some changes in metabolite concentrations, and may facilitate the detection of pathologically altered MM4. In addition, changes in metabolite concentrations were observed when the stiffness of the fitted spline baseline was varied at 9.4T in humans but no final conclusion on the best value was drawn5 due to lack of ground truth .In the present study parametrized and full MM basis-sets were compared, with varying DKNTMN parameter for both approaches, to assess the resulting changes in metabolite concentrations using in-vivo rat brain 1H-MR spectra and Monte Carlo simulations at 9.4T.
Methods
In-vivo 1H-MRS measurements were performed on a 9.4T system (Varian-Magnex Scientific), using a home-built 1H-quadrature surface transceiver. First and second order shims were adjusted using FAST(EST)MAP6. Spectra were acquired in the rat brain using the SPECIAL7 sequence (TE=2.8ms) in a voxel located in the hippocampus (2x2.8x2mm3, n=7, 160averages). The in-vivo spectrum of MM was acquired using a single inversion-recovery module before SPECIAL7 sequence (2ms hyperbolic secant inversion pulse, inversion time (TI) of 750ms, TE=2.8ms, 700averages, n=3).Parametrization: After elimination of metabolite residuals, ten individual MM components were parametrized with AMARES8 (Figure.1A). Individual MM components were saved separately to create the MM basis-set (Figure.1B). To implement the soft constraints for the individual MM each MM component was first quantified from the three measured spectra. Signal intensity ratios of Mxx/M0.94 were then calculated for every spectrum and averaged over the three acquisitions to obtain a value and standard deviation for each ratio (Figure.1C). These values were included in the LCModel control files using the parameter CHRATO as described in4.
Quantification: Each spectrum was quantified with LCModel using full MM (standard) and parametrized MM basis-set with varying DKNTMN value (0.1, 0.25, 0.4, 0.5, 1, 5) for every basis-set. DKNTMN (minimum allowed spacing between spline knots)2,5 controls the stiffness of the spline baseline. The default value is 0.15 (low stiffness) and all the values equal or higher than 1 give a high baseline stiffness5. Metabolites concentrations where compared for all the DKNTMN values within groups (full and parametrized-MM) using 1-way ANOVA.
Monte-Carlo simulation (MC): To estimate the reliability of the estimated concentrations, artificial rat brain 1H-MR spectra were simulated (Matlab, MathWorks, Natick, MA) (Figure.2) to mimic optimal experimental conditions (metabolites with MM only) and real experimental conditions (metabolites with MM and a baseline as a result of minor outer-volume contamination and insufficient water suppression). 100 high signal to noise spectra were generated for each experimental condition to estimate any systematic deviation from the real values without any bias induced by the quantification algorithm. A random normally distributed noise was also added.
Results and discussion
Ten components of MM were fitted providing reliable values used as prior knowledge in LCModel for the parametrized MM basis-set (Figure.1B).When using the full MM, the in-vivo quantifications with increasing the stiffness in the spline baseline lead to a significant decrease of Gln(-16%), Glu(-7%) and GABA(-30%) concentrations (Figure.3-black plots). As expected, MC studies using optimal conditions showed a negligible impact of DKNTMN on metabolite concentrations (Figure.4), while the MC signals containing an additional baseline revealed mainly a drop in metabolite concentrations when DKNTMN was increased (Figure.5), consistent with our in-vivo results. As can be seen in Figure.2, there was a mismatch between the raw data and the LCModel fit when increasing DKNTMN.
When using parametrized MM, the overall in-vivo metabolite changes over DKNTMN values became less important than for the full MM (only Ala, Ins and Lac, Figure.3-red plots). This can be explained by the additional flexibility of the individual MM. Findings also supported when using the MC signals with baseline (real conditions) (Figure.5-red plots) where the metabolite changes due to DKNTMN were less pronounced.
However, when comparing the full vs parametrized MM, the in-vivo spectra revealed overall increased concentrations from 15% to 45% (Asp, GABA, Gln, GSH, NAAG, PE). These findings were confirmed by MC studies and were consistent with previous studies4.
Conclusion
Our results confirmed the metabolite changes when using parametrized MM in the basis-set and these seemed less important when a flexible baseline was used. Using in-vivo and MC data we showed that a degree of flexibility in the spline baseline is required for quantification of real/experimental data. In addition, a highly stiff baseline lead to important metabolite changes when using the full MM for in-vivo rat brain spectra at 9.4T.Acknowledgements
Supported by CIBM of the UNIL, UNIGE, HUG, CHUV, EPFL, the Leenaards and Jeantet Foundations and the SNSF project no 310030_173222/1References
- Cudalbu, C., Mlynárik, V. & Gruetter, R. Handling macromolecule signals in the quantification of the neurochemical profile. J. Alzheimer’s Dis. 31, (2012).
- Provencher, S. Manual. (2019).
- Provencher, S. W. Automatic quantitation of localized in vivo 1H spectra with LCModel. NMR Biomed. 14, 260–264 (2001).
- Považan, M. et al. Simultaneous mapping of metabolites and individual macromolecular components via ultra-short acquisition delay 1 H MRSI in the brain at 7T. Magn. Reson. Med. 79, 1231–1240 (2018).
- Giapitzakis, I. A., Borbath, T., Murali-Manohar, S., Avdievich, N. & Henning, A. Investigation of the influence of macromolecules and spline baseline in the fitting model of human brain spectra at 9.4T. Magn. Reson. Med. 81, 746–758 (2019).
- Gruetter, R. & Tkáč, I. Field mapping without reference scan using asymmetric echo-planar techniques. Magn. Reson. Med. 43, 319–323 (2000).
- Mlynárik, V., Gambarota, G., Frenkel, H. & Gruetter, R. Localized short-echo-time proton MR spectroscopy with full signal-intensity acquisition. Magn. Reson. Med. 56, 965–970 (2006).
- Vanhamme, L., Van Den Boogaart, A. & Van Huffel, S. Improved Method for Accurate and Efficient Quantification of MRS Data with Use of Prior Knowledge. J. Magn. Reson. 129, 35–43 (1997).
Figures
Figure 1: A) Original MM spectrum (TI=750 ms,
TE=2.8 ms) shown in black, estimated fits of the residual metabolites using
AMARES (red) and the residue obtained after subtraction of the estimated metabolites
remaining from the original spectrum (blue). B) MM spectrum parametrized into
10 individual components using AMARES. The original spectrum was fitted using
AMARES and the fits of individual components were saved separately to form a
parametrized basis-set (in color). C) Signal intensity ratios and their
standard deviations (used for CHRATO parameter in LCModel).
Figure 2: A) Spectra obtained with
Monte Carlo simulation of real experimental conditions (with baseline) showing
a mismatch between the raw data and the LCModel fit (arrow) when quantifying
with DKNTMN = 5; B) In-vivo acquired spectra from the same
rat using DKNTMN = 0.25 (left) and DKNTMN = 5 (right).
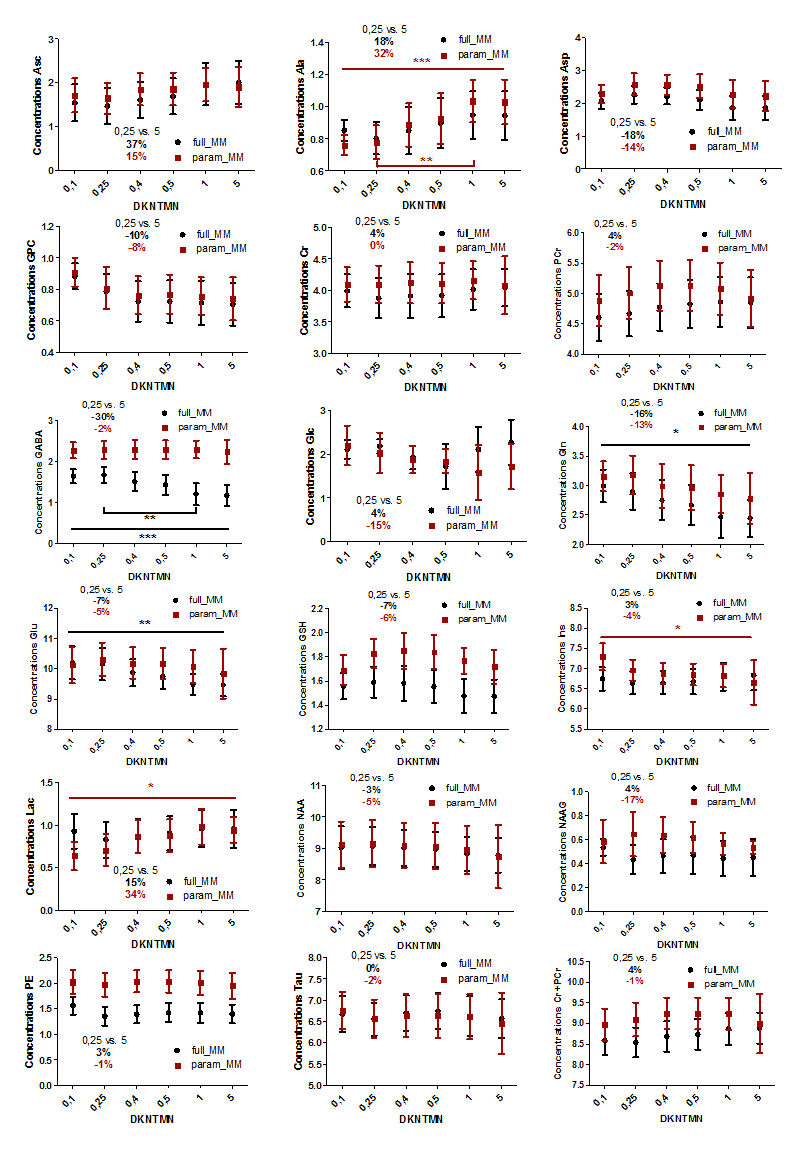
Figure 3: In-vivo metabolite changes using two
different quantification approaches in LCModel: full MM spectra (black) and
parametrized MM spectra (red) over different DKNTMN values (One-way ANOVA, Bonferroni correction). The
percentage change between metabolite concentrations when quantified with DKNTMN
= 0.25 and DKNTMN = 5 are shown in the insert (always in red for the
parameterized MM and black for the full MM).

Figure 4:
Metabolic concentrations obtained when quantifying Monte Carlo spectra
mimicking optimal experimental
conditions (without baseline) with
different DKNTMN values. The
quantifications were done using two approaches full MM (black) and parametrized
MM (red) in LCModel. The true concentration of each metabolite is represented
with a triangle symbol at DKNTMN = 0.
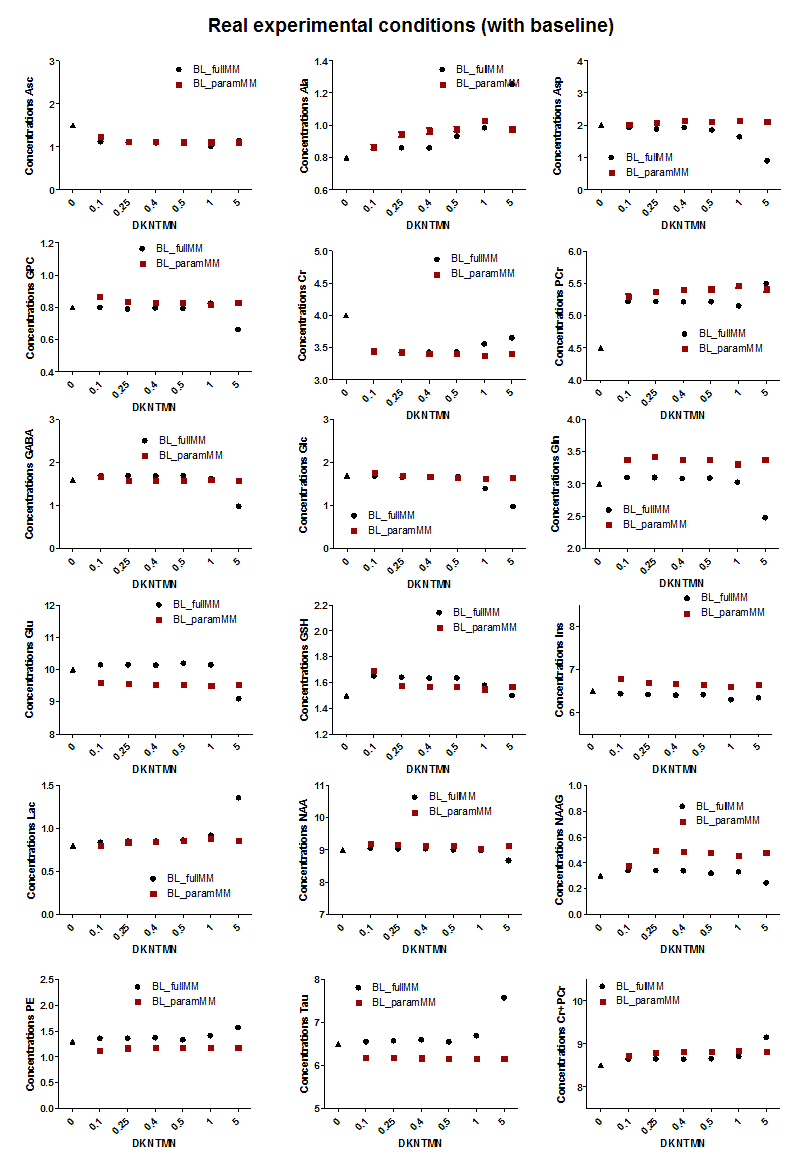
Figure 5:
Metabolic concentrations obtained when quantifying Monte Carlo spectra
mimicking real experimental
conditions (with baseline) with
different DKNTMN values. The
quantifications were done using two approaches full MM (black) and parametrized
MM (red) in LCModel. The true concentration of each metabolite is represented
with a triangle symbol at DKNTMN = 0.