2851
A Subspace-based Reliable NMR Spectroscopy Reconstruction1School of Computer and Information Engineering, Xiamen University of Technology, Xiamen, China, Xiamen, China, 2School of Opto-Electronic and Communication Engineering, Xiamen University of Technology, Xiamen, China, Xiamen, China, 3Department of Electronic Science, Xiamen University, Xiamen, China, Xiamen, China, 4Department of Chemistry and Molecular Biology and Swedish NMR Centre, University of Gothenburg, Gothenburg, Sweden, Gothenburg, Sweden
Synopsis
Accelerating the data acquisition is one of the major developments in modern Nuclear Magnetic Resonance (NMR). Non-Uniform Sampling (NUS) acquires fewer data and reconstructs the spectra with proper signal processing methods1. Here, we introduce an approach to reconstruct faithful spectra from highly accelerated NMR. The FID signal is constrained by the self-learning signal subspace (SLS), in which a true representation of NMR should be in. Results on realistic NMR data demonstrate that the new approach provides much better spectra than the compared state-of-the-art method.
Purpose
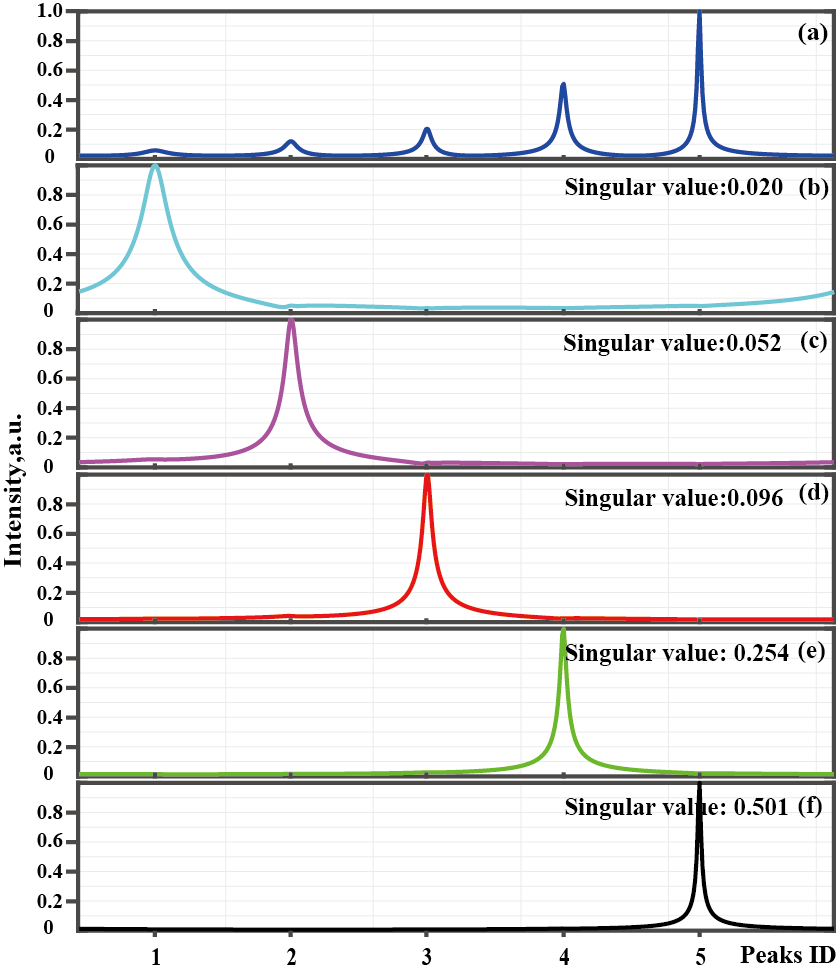
Fast Nuclear Magnetic Resonance (NMR) spectroscopy is strongly desired in modern biochemistry applications2, 3, especially for high-dimensional spectroscopy of macromolecule4. The acceleration factor has been gained by fast sampling, however, it is always limited because the compromised spectra quality achieved when applying a high acceleration factor. Although the low-rank Hankel Matrix (LRHM)5-7 can reconstruct broad peaks, low intensity peaks may be submerged when the data is highly undersampled . Since the singular values mainly correspond to the peak intensity, solely manipulating the singular values may ignore the peak shapes, which are of great importance in NMR spectroscopy8. Therefore, the original LRHM method is at the risk of distorting peak intensity and shapes, particularly for the FID with very limit sampled data9. Herein, we propose a self-learning signal subspace (SLS) method to enable reliable reconstruction of the low-intensity peak even when substantial acceleration factor is applied.Method
In NMR, the Free Induction Decay (FID) signal is usually modeled as the sum of exponential functions as$$ {x_m} = \sum\limits_{j = 1}^J {\left( {{A_j}{e^{i{\phi _j}}}} \right){e^{ - \frac{{m\Delta t}}{{{\tau _j}}}}}{e^{im\Delta t{\omega _j}}}} ,(1) $$where $$$ J $$$ is the number of spectral peaks,$$${A_j},{\phi _j},{\tau _j},{\omega _j}$$$are the amplitude, phase, decay time and frequency of the spectral peak, respectively.
The LRHM minimizes the nuclear norm, the sum of singular values, as an indicator of the rank of Hankel matrix. This scheme may result in unsatisfactory reconstruction because of suppressing or even removing small but meaningful singular values. In this work, a self-learning signal subspace (SLS) method is proposed to enable reliable reconstruction of the low-intensity peak even when substantial acceleration factor is applied. Let the FID be recovered as $$${\bf{x}}$$$, then the reconstruction problem is formulated as$$ \mathop {{\rm{min}}}\limits_{\bf{x}} {P_r}\left( {\bf{x}} \right) + \frac{\lambda }{2}\left\| {{\bf{y}} - {{\cal U}}{\bf{x}}} \right\|_2^2,(2) $$
where$$${P_r}\left( {\bf{x}} \right) $$$is defined as $$ {P_r}({\bf{x}}) = {\left\| {{{\cal R}}{\bf{x}}} \right\|_ * } - Tr\left( {{{\bf{A}}_r}{{\cal R}}{\bf{xB}}_r^H} \right), (3)$$
where $$$ {{\bf{A}}_r} $$$ and $$${{\bf{B}}_r}$$$ are two matrices formed by the first r columns of the left and right unitary matrixes that satisfy singular value decomposition in $$$ {{\cal R}}{\bf{x}}{\rm{ = }}{\bf{A\Lambda }}{{\bf{B}}^H}$$$ and which is the subspace of the reconstructed signal, $$${ \bullet ^H} $$$ is complex conjugate transpose, $$${{\cal R}}$$$ denote an operator converting the FID $$${\bf{x}}$$$ into a Hankel matrix $$${{\cal R}}{\bf{x}}$$$,$$$ Tr\left( \cdot \right) $$$ is trace function, $$${\left\| \cdot \right\|_*}$$$represents the nuclear norm, $$$ {\left\| \cdot \right\|_2} $$$ represents the $$$ {l_2} $$$ norm, $$$ \lambda $$$ denotes a regularization parameter that balances the two terms, and $$$ {{\cal U}} $$$ is an undersampling operator. In our implementation, $$$ {{\bf{A}}_r} $$$and $$${{\bf{B}}_r}$$$ are first estimated from the NUS FID and then updated from the reconstructed FID for better accuracy.
Results
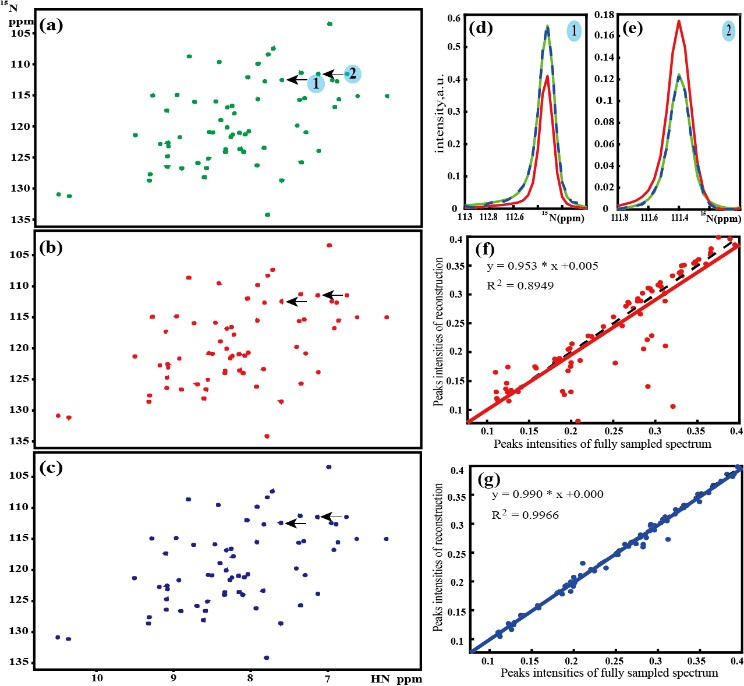
The reconstruction performances of proposed SLS and LRHM are evaluated on realistic biological protein MRS.The sample is 2 mM U-15N, 20%-13C GB1 in 25 mM PO4, pH 7.0 with 150 mM NaCl and 5% D2O. Data was collected using a phase-cycle selected HSQC at 298 K on a Bruker Avance 600 MHz spectrometer using a room temp HCN TXI probe, equipped with a z-axis gradient system. Since the singular value mainly correspond to the peak intensity as shown in Figure 1, The more accurate the peak signal space, the better the reconstruction. Obviously, The SLS reconstructs the spectral peaks better than the LRHM (Figure. 2(f) and (g)), particularly for peaks with low intensity (Figure. 2(e)).
Conclusion
A self-learning signal subspace method is proposed to reconstruct the sparsely sampled data in fast NMR spectroscopy. A major advantage of this model is that weak peak are better preserved in reconstruction. This method may also be useful to magnetic spectroscopic imaging (MRSI) in which the weak spectral peaks may be distorted in data processing.Acknowledgements
This work was supported in part by the National Natural Science Foundation of China (61871341, 61971361, 61571380, 61811530021, U1632274), the National Key R&D Program of China (2017YFC0108703), the Natural Science Foundation of Fujian Province of China (2018J06018), the Fundamental Research Funds for the Central Universities (20720180056), and the Science and Technology Program of Xiamen (3502Z20183053) .
The correspondence should be sent to Dr. Xiaobo Qu (Email: quxiaobo@xmu.edu.cn)
References
1. M. Mobli and J. C. Hoch, "Nonuniform sampling and non-Fourier signal processing methods in multidimensional NMR," Progress in Nuclear Magnetic Resonance Spectroscopy, vol. 83, pp. 21-41, 2014.
2. M. Betz, K. Saxena, and H. Schwalbe, "Biomolecular NMR: a chaperone to drug discovery," Current Opinion in Chemical Biology, vol. 10, pp. 219-225, 2006.
3. A. Cavalli, X. Salvatella, C. M. Dobson, and M. Vendruscolo, "Protein structure determination from NMR chemical shifts," Proceedings of the National Academy of Sciences, vol. 104, pp. 9615-9620, 2007.
4. J. Ying, J.-F. Cai, D. Guo, G. Tang, Z. Chen, and X. Qu, "Vandermonde factorization of Hankel matrix for complex exponential signal recovery—Application in fast NMR spectroscopy," IEEE Transactions on Signal Processing, vol. 66, pp. 5520-5533, 2018.
5. X. Qu, M. Mayzel, J.-F Cai, Z. Chen, V. Orekhov. Accelerated NMR spectroscopy with low-rank reconstruction, Angewandte Chemie International Edition, vol. 54, no.3, 852-854, 2015.
6. H. Lu, X. Zhang, T. Qiu, J. Yang, J. Ying, D. Guo, et al., "Low rank enhanced matrix recovery of hybrid time and frequency data in fast magnetic resonance spectroscopy," IEEE Transactions on Biomedical Engineering, vol. 65, pp. 809-820, 2017.
7. J. Ying, H. Lu, Q. Wei, J.-F. Cai, D. Guo, J. Wu, et al., "Hankel matrix nuclear norm regularized tensor completion for N-dimensional exponential signals," IEEE Transactions on Signal Processing, vol. 65, pp. 3702-3717, 2017.
8. F. Lam and Z. P. Liang, "A subspace approach to high‐resolution spectroscopic imaging," Magnetic Resonance in Medicine, vol. 71, pp. 1349-1357, 2014.
9. X. Qu, Y. Huang, H. Lu, T. Qiu, D. Guo, V. Orekhov, and Z. Chen, "Accelerated nuclear magnetic resonance spectroscopy with deep learning," Angewandte Chemie International Edition, 2019. DOI:10.1002/anie.201908162.
Figures