2849
Learning MR-guided PET reconstruction in image space using a convolutional neural network - application to multiple PET tracers1Department of Imaging and Pathology, Division of Nuclear Medicine, KU Leuven, Leuven, Belgium, 2Center for Advanced Imaging Innovation and Research (CAI2R) and Bernard and Irene Schwartz Center for Biomedical Imaging, Department of Radiology, New York University School of Medicine, New York City, NY, United States, 3Siemens Healthcare GmbH, Erlangen, Germany, 4Department of Neuroradiology, NYU Langone Health, Department of Radiology, New York University School of Medicine, New York City, NY, United States
Synopsis
Recently, we could show that MR-guided PET reconstruction can be mimicked in image space using a convolutional neural network which facilitates the translation of MR-guided PET reconstructions into clinical routine. In this work, we test the robustness of our CNN against the used input PET tracer. We show that training the CNN with PET images from two different tracers ([18F]FDG and [18F]PE2I), leads to a CNN that also performs very well on a third tracer ([18F]FET) which was not the case when the network was trained on images from one tracer only.
Introduction
Positron emission tomography (PET) is a quantitative molecular imaging technique with high sensitivity and specificity that is widely used in different fields. Compared with structural imaging modalities such as magnetic resonance imaging (MRI), PET images suffer from limited spatial resolution (ca. 4-5mm), Gibbs overshoots, and propagation of noise from the acquired raw data. The low resolution and the resulting partial volume effects1 hinder accurate quantification of small structures such as gray matter gyri.To overcome these challenges, especially in brain PET, many techniques for anatomy-guided PET reconstruction using high resolution structural MR images were developed in the past2-5. Unfortunately up to now, despite promising results in simulations and first studies, MR-guided PET reconstructions are not widely adopted in clinical practice. The reasons for that are manifold. First, until now no vendor has implemented any MR-guided PET reconstruction into their products which prohibits the use and evaluation by clinical users on bigger patient cohorts. Moreover, even in the few academic centers world-wide that are able to perform MR-guided PET reconstructions, they are not widely applied.
Recently, we have shown that MR-guided PET reconstruction using the Bowsher prior are effective at reducing partial voluming effects5 and that they can be very well approximated by a convolutional neural network (CNN) in image space6 which substantially facilitates the translation of this method into clinical routine. In this work we aim to investigate the robustness of our trained CNN with respect to the PET tracer used to acquire the input PET image.
Methods
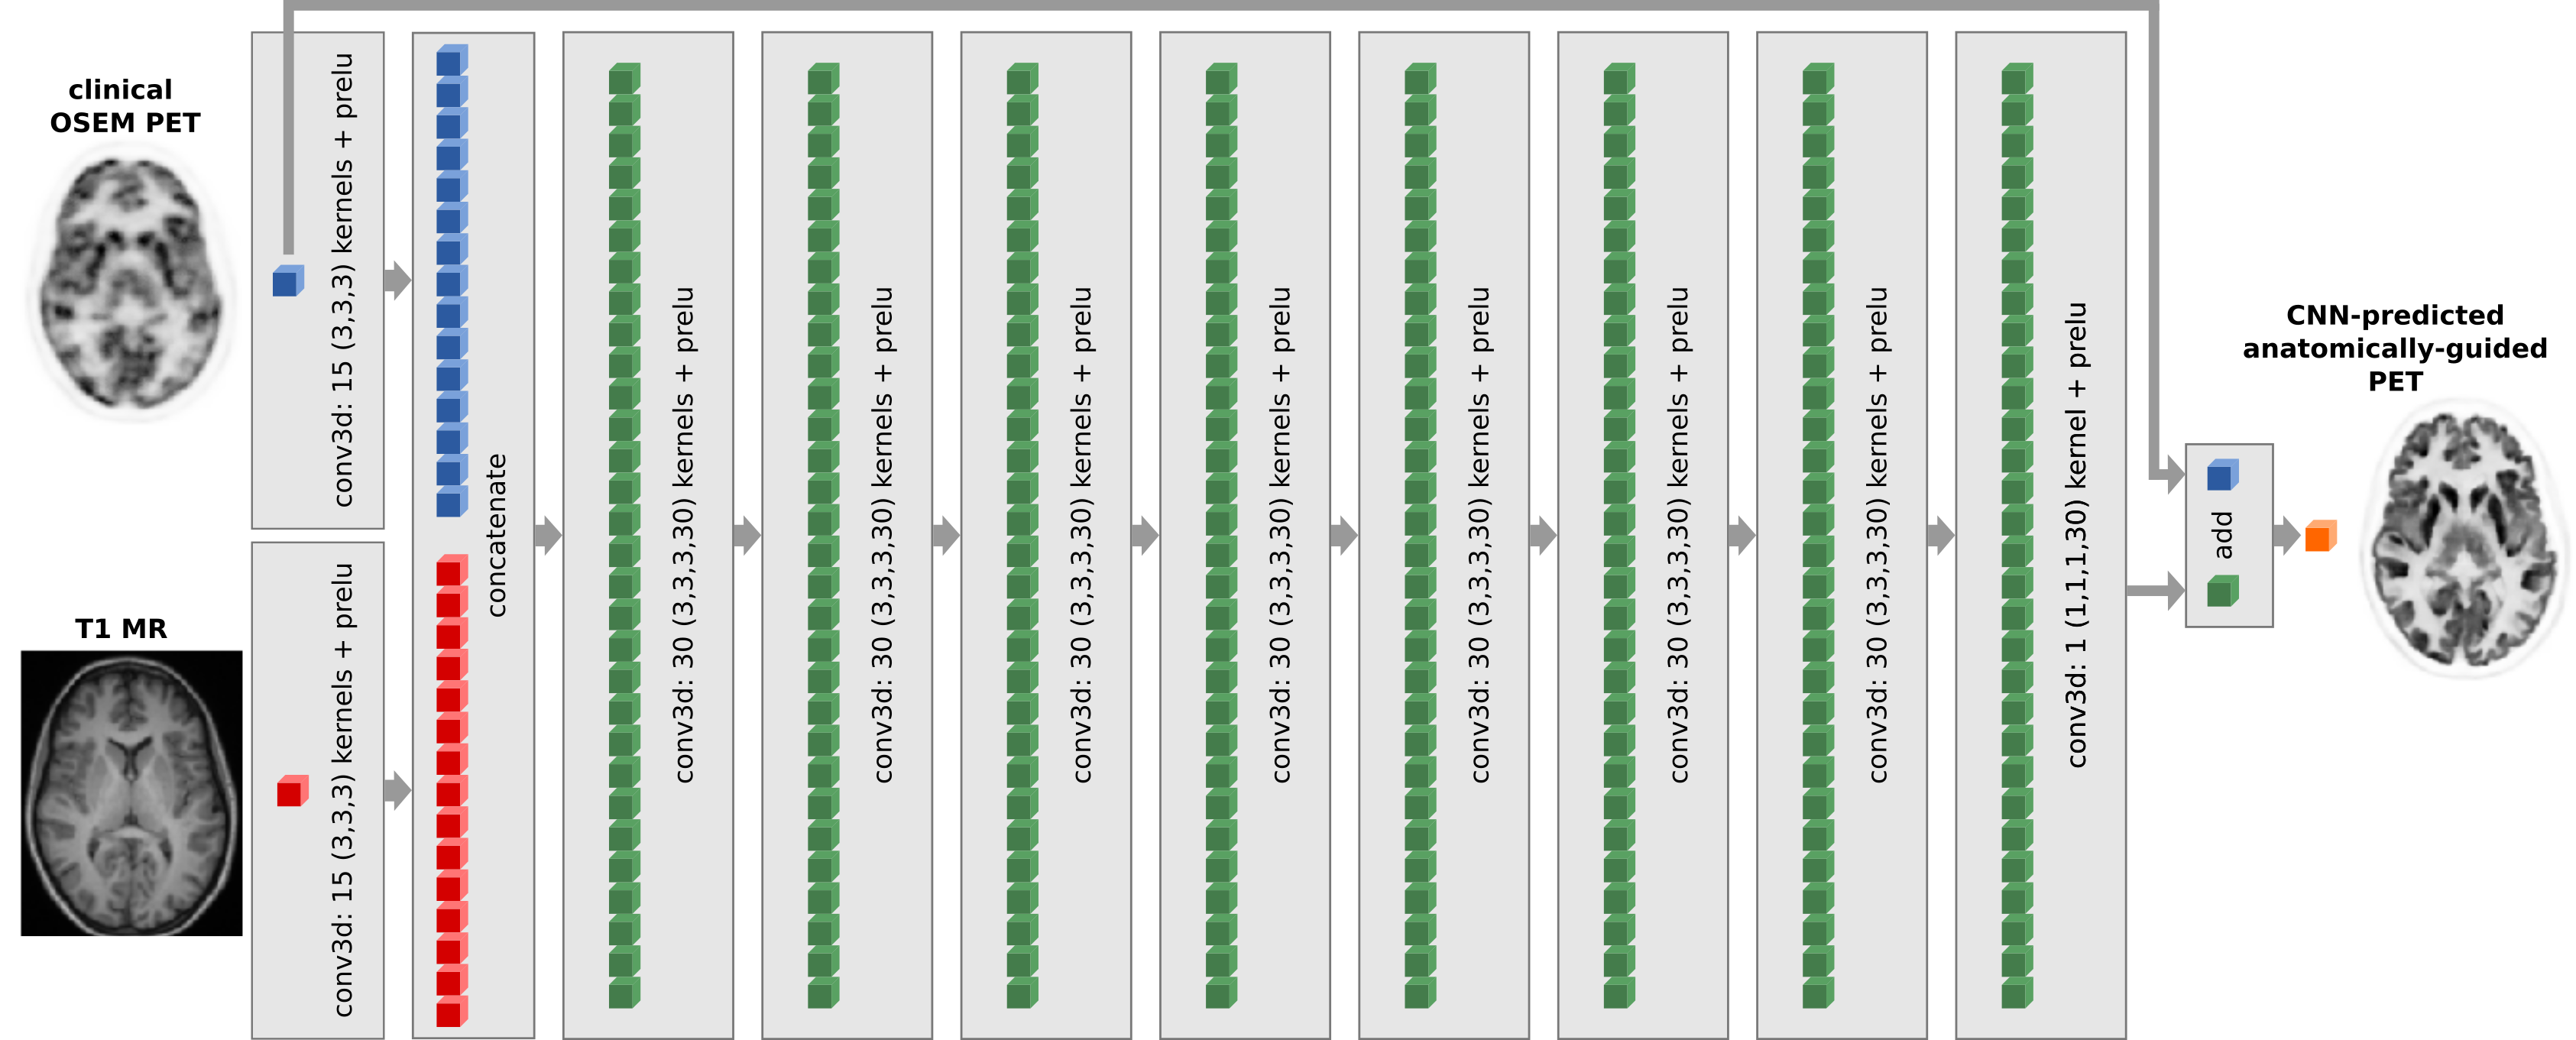
To test the robustness of our CNN shown in Fig. 1, we trained it using T1 weighted MR images and PET images acquired with two different tracers (13 20min [18F]FDG acquisitions from a Siemens mMR, 3 20min [18F]FDG acquisitions from a GE SIGNA PET/MR, and 10 20min [18F]PE2I acquisitions from a GE SIGNA PET/MR).The performance of the trained CNN was evaluated on a seprate test data set consisting of 39 20min [18F]FDG acquisitions from a Siemens mMR, 18 20min [18F]PE2I acquisitions from a GE SIGNA PET/MR and 7 25min [18F]FET acquisitions from a GE SIGNA PET/MR. Note that [18F]FET images were not used for training.
For all data sets, the target output of the CNN was MR-guided PET reconstruction using the asymmetric Bowsher prior with a prior weight of β = 10. The reconstruction were obtained from the acquired PET raw data and inhouse developed PET reconstruction software.
The similarity of the CNN-predicted MR-guided PET reconstructions (BOWCNN) and the target MR-guided PET reconstructions obtained from the raw data (BOW) was assessed visually and in terms of regional mean recovery coefficients and regional structural similarity in anatomical regions of interest obtained from freesurfer segmentations7.
Results
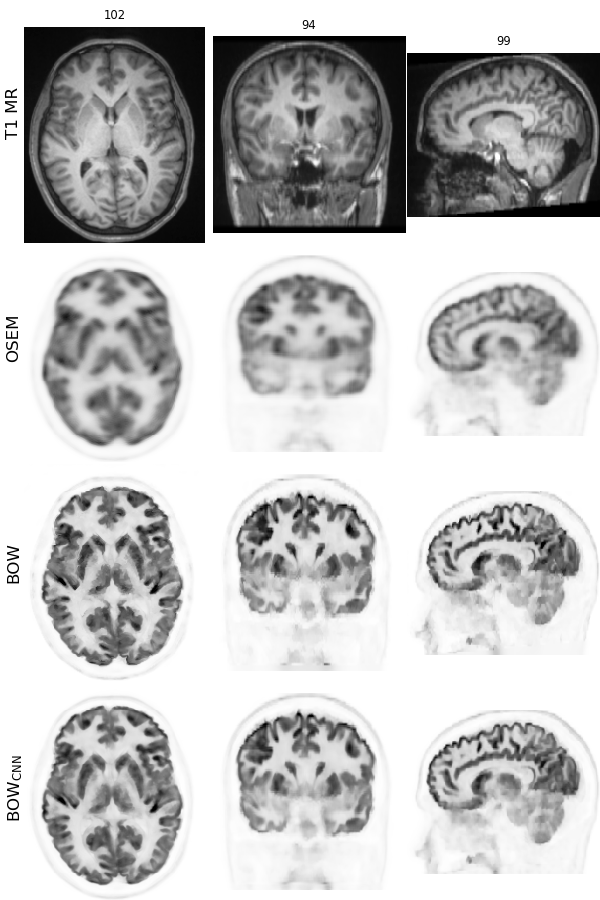
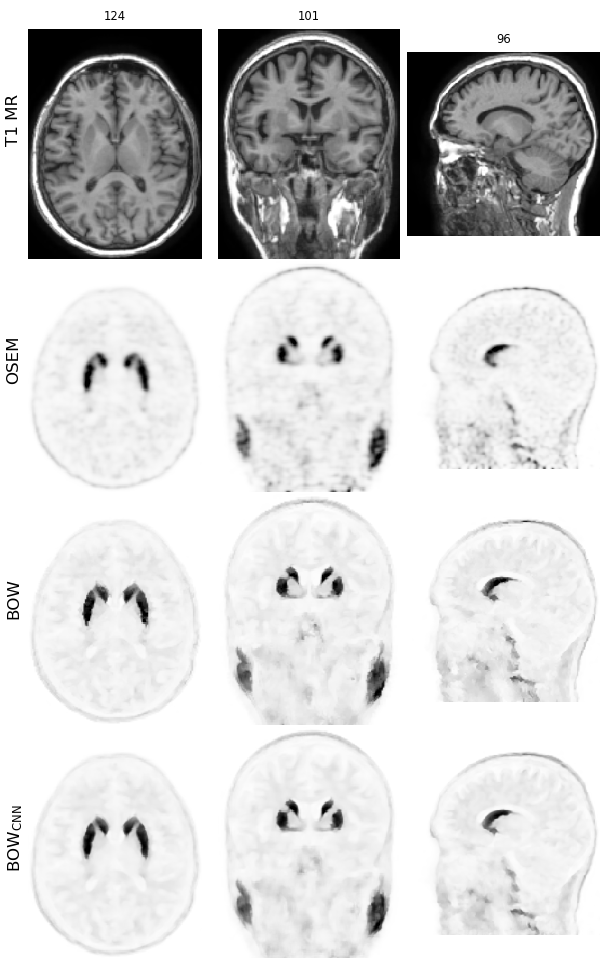
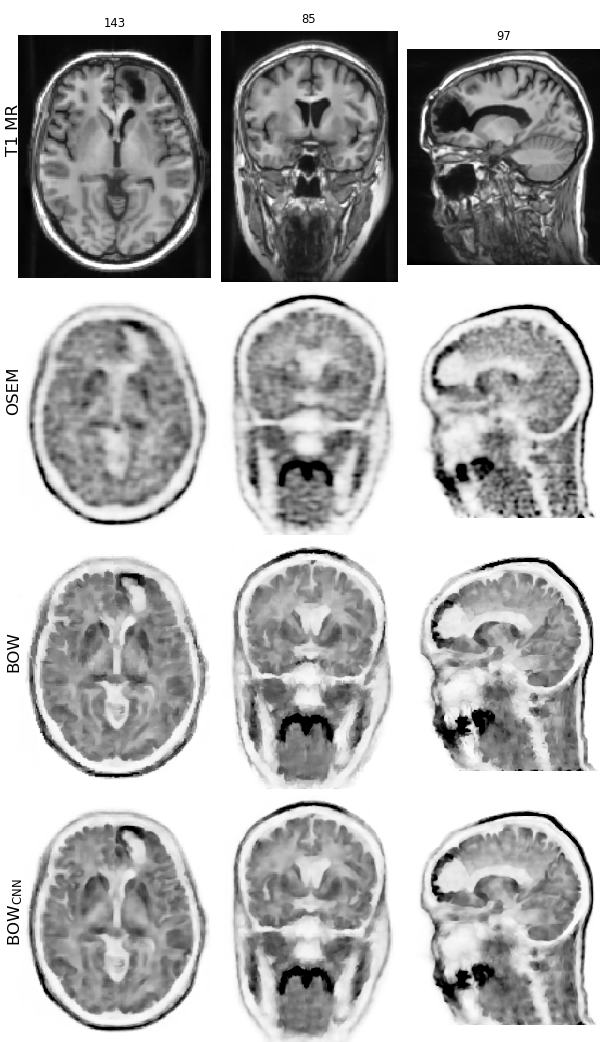
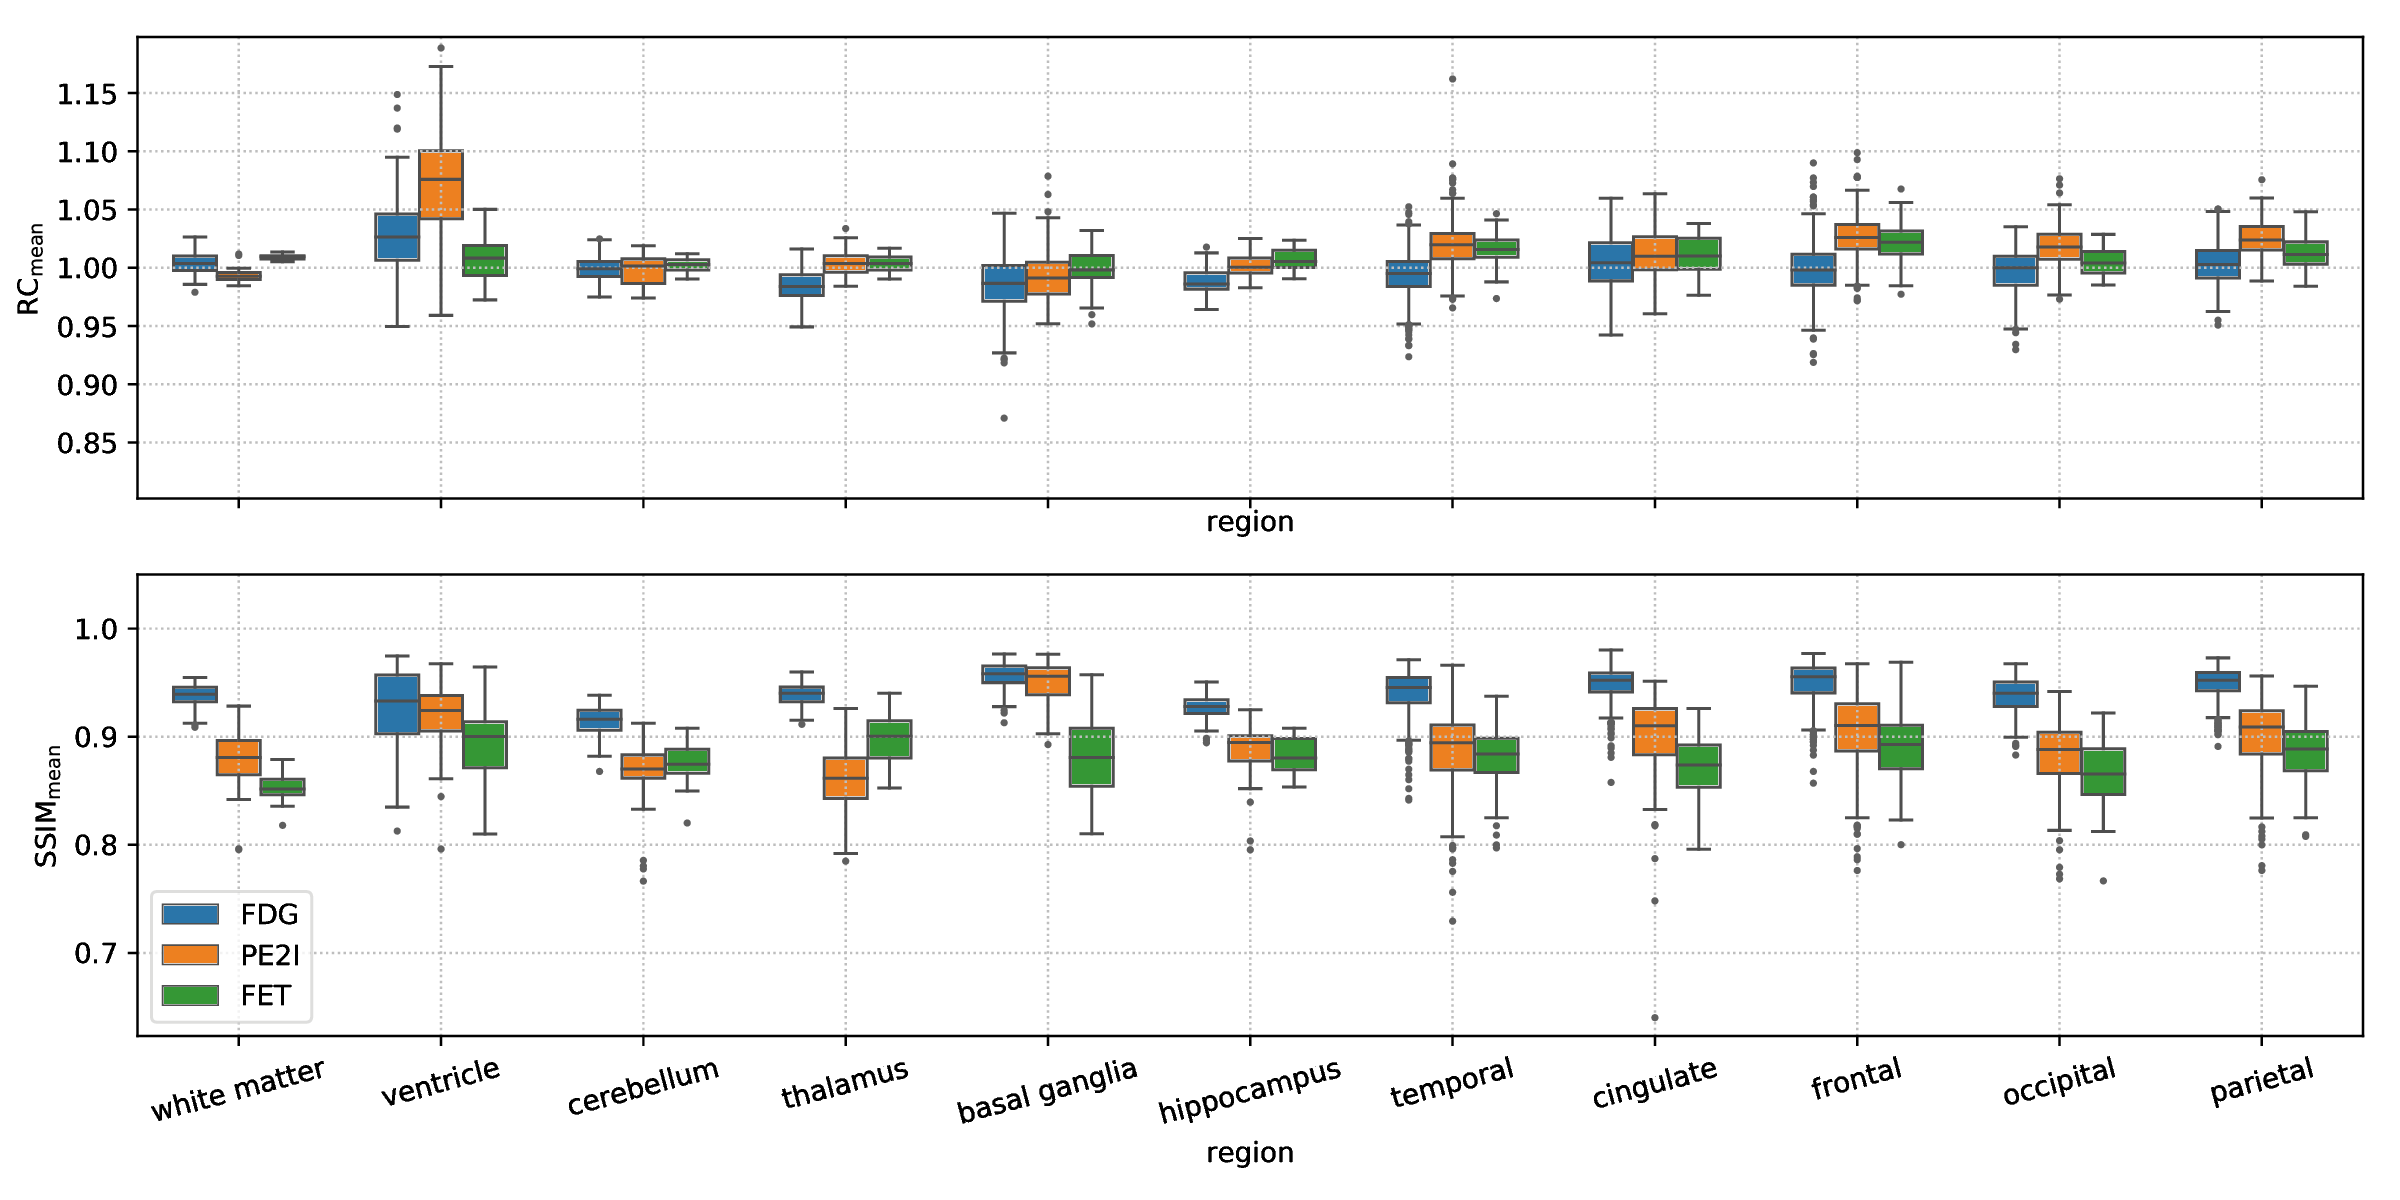
Figure 2 shows one of the [18F]FDG test cases acquired on the mMR. Figures 3 and 4 show two examples of network predictions for [18F]PE2I and [18F]FET acquired on the SIGNA.Figure 5 shows the results for the regional mean recovery and structural similarity between BOWCNN and BOW evaluated in the test cases. For all three tracers and all regions except the ventricals in [18F]PE2I, the regionally averaged RCmean ranges from 0.98 to 1.03 with standard deviation below 0.03. For [18F]PE2I, the ventricles show a small positive bias in the RCmean (1.05 ± 0.05). However, it should be noted that the [18F]PE2I uptake in the ventricles is extremely low. Only 244 out of the 5130 analyzed ROIs (4.7%) showed more than 5% bias in the RCmean. Out of those, 79 ROIs were ventricles with low tracer uptake.The regionally averaged structural similarity between BOWCNN and BOW ranges from 0.91 in the cerebellum to 0.96 basal ganglia for [18F]FDG, from 0.86 in the thalamus to 0.95 in the basal ganglia for [18F]PE2I, and from 0.85 in white matter to 0.9 in the thalamus for [18F]FET indicating that the perceived image quality of BOWCNN is very close to BOWin all regions for all tracers.
Discussion
The visual appearance of BOWCNN compared to BOW for all investigated PET tracers is very similar with both showing better contrast between gray matter and white matter and less Gibbs artifacts in the cortical gray matter compared to the input OSEM image. Moreover, BOW and BOWCNN show more detail compared to OSEM as e.g. visible in the insula.While these results might be expected for the [18F]PE2I cases, the results for the [18F]FET cases are rather surprising since, first, no [18F]FET data sets were used during training, and second, the regional contrasts in the [18F]FET cases are substantially different from the [18F]FDG and [18F]PE2I cases used for training.
In a previous analysis of a CNN only trained on [18F]FDG, we had observed substantial regional bias
in the predictions of [18F]PE2I and [18F]FET. We assume that by using two different tracers we can learn the CNN not to rely on the average regional contrasts of the training PET images which is highly desirable.
Conclusion
By using PET images from two tracers ([18F]FDG and [18F]PE2I) for training, we could demonstrate that MR-guided PET reconstruction can be well approximated by a purely shift-invariant CNN even for PET tracers not used during training.Acknowledgements
This work was supported in part by PHS grant P41 EB017183.References
1Fazio and Perani. "Importance of partial-volume correction in brainPET studies." Journal of Nuclear Medicine, 41, 1849–50 (2000).
2Bowsher et al. "UtilizingMRI information to estimate F18-FDG distributionsin rat flank tumors." Nuclear Science Symposium Conference Record, 2004 IEEE 4, 2488–2492 (2004).
3Vunckx et al. "Evaluation of three MRI-based anatomical priors for quantitative PET brain imaging." IEEE Transactions on Medical Imaging 31, 599–612 (2012).
4Ehrhardt et al. "PET Reconstruction with an AnatomicalMRI Priorusing Parallel Level Sets." IEEE Transactions on Medical Imaging 35,2189–2199 (2016).
5Schramm et al. "Evaluation of Parallel Level Sets and Bowsher’s Method as Segmentation-Free Anatomical Priors for Time-of-Flight PET Reconstruction." IEEE Transactions on Medical Imaging 37, 590–603 (2017).
6Rigie et al., "Approximating MRI-Based Anatomically Guided PET Reconstruction with a Convolutional Neural Network," 2018 IEEE Nuclear Science Symposium and Medical Imaging Conference Proceedings (NSS/MIC), Sydney, Australia, 2018, pp. 1-3.
7Fischl et al. "Automatically Parcellating the Human Cerebral Cortex." Cerebral Cortex 14, 11–22 (2004).
Figures