2848
MRI-assisted Deep Learning-enhanced Actual Ultra-low-dose Amyloid PET Acquisitions1Stanford University, Stanford, CA, United States
Synopsis
We are aiming to greatly reduce the radioactive radiotracer dose administered to subjects during PET scanning. In this work we propose to leverage the perfect spatiotemporal correlation of hybrid PET/MRI scanning to synthesize diagnostic PET images from multiple MR images and a noisy PET image reconstructed from acquisitions with actual ultra-low-dose (as low as ~1% of the original) amyloid radiotracer injections, using trained deep neural networks. This technique can potentially increase the utility of hybrid amyloid PET/MR imaging and remove the limiting factors to large-scale clinical longitudinal PET/MRI studies.
Introduction
Simultaneous amyloid positron emission tomography/ magnetic resonance imaging (PET/MRI) provides the opportunity of a “one-stop shop” imaging exam for dementia research, diagnosis, and potential clinical trials1. PET allows the acquisition of the amyloid biomarker, a hallmark of Alzheimer’s disease neuropathology2, while MRI with its exquisite soft tissue contrast allows for imaging cortical atrophy, representative of neurodegeneration3. Moreover, the perfect spatiotemporal correlation of PET/MRI is such that the strengths of one modality can be used to compensate for the weaknesses of the other4. While the absolute quantification of radiotracer concentrations is a strength in PET, radioactivity associated with the radiotracers will also present a risk to participants, especially in vulnerable populations. This will affect the scalability of large-scale clinical longitudinal PET/MRI studies. With the advent of deep learning-based machine learning methods such as convolutional neural networks (CNNs) and simultaneously-acquired multimodal MRI and PET scanning, we have shown that we can generate diagnostic quality amyloid PET images from PET/MRI scan protocols with simulated ultra-low (1%) radiotracer dose using deep learning5. While researchers have pushed for dose reduction in PET, some using machine learning methods as well6,7, in this project we will demonstrate utility of the network with images acquired using actual ultra-low-dose radiotracer injections rather than simulations such as a subset of the original data or short-time-frame reconstructions. Dramatically lowering injected dose will provide breakthroughs in PET/MRI scanning protocols, allowing for more frequent scanning and more accurate follow-ups of disease progression.Methods
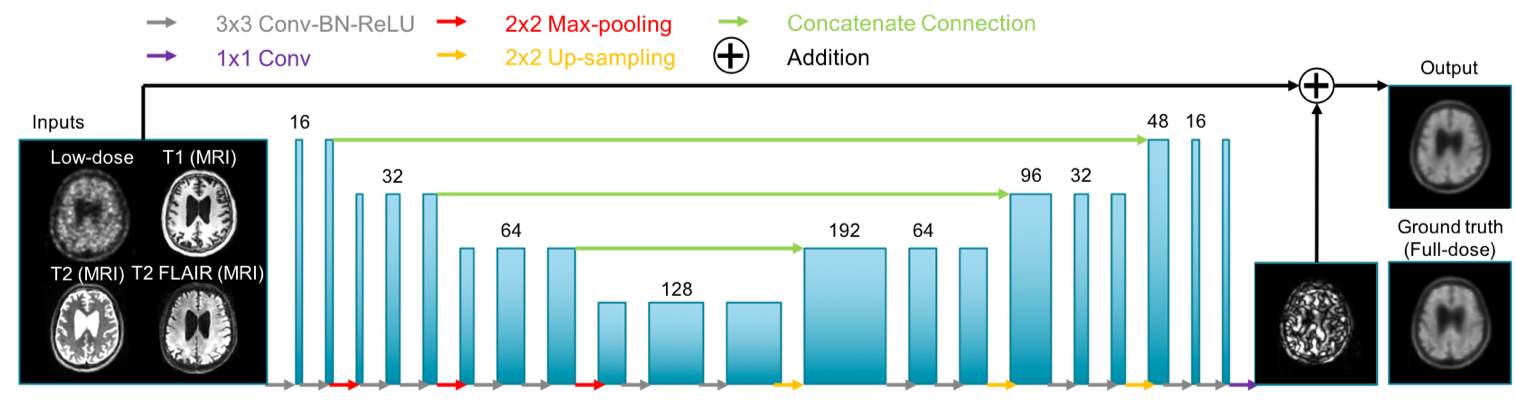
PET/MR data acquisition: 48 total subjects were recruited for the study. The T1-weighted, T2-weighted, and T2 FLAIR MR images were acquired (simultaneously with PET on an integrated PET/MR scanner with time-of-flight capabilities: SIGNA PET/MR, GE healthcare) for all scans. 32 (19 female, 68.2±7.1 years) were used for pre-training the network; 328±32 MBq of the amyloid radiotracer 18F-florbetaben were injected into the subject and PET data were acquired 90-110 minutes after injection. The raw list-mode PET data was reconstructed for the full-dose ground truth image and was also randomly undersampled by a factor of 100 and then reconstructed to produce an ultra-low-dose PET image. 16 subjects (8 female, 70.6±7.7 years) were scanned with the ultra-low-dose protocol. These subjects were scanned in two PET/MRI sessions, with 6.91±3.74 MBq and 303±13 MBq 18F-florbetaben injections in the two sessions respectively (2.3%±1.3% dose for the ultra-low-dose sessions). PET data were acquired 90-110 minutes after injection (83-98 minute frames were acquired for one subject). 9 subjects were scanned on the same day (ultra-low-dose protocol followed by the full-dose protocol), while the others were scanned on separate days (1- to 42-day interval, mean 19.6 days).CNN implementation: A pre-trained ultra-low-dose CNN was trained based on Chen et al.5 (Figure 1). The inputs of the network are the multi-contrast MR images (T1-weighted, T2-weighted, T2 FLAIR) and the simulated ultra-low-dose PET image. The network was trained on the full-dose PET image as the ground truth. The last layer of the CNN was fine-tuned using the actual low-dose datasets. 8-fold cross-validation was used to prevent tuning and testing on the same subjects (14 subjects for training, 2 subjects for testing per network trained).
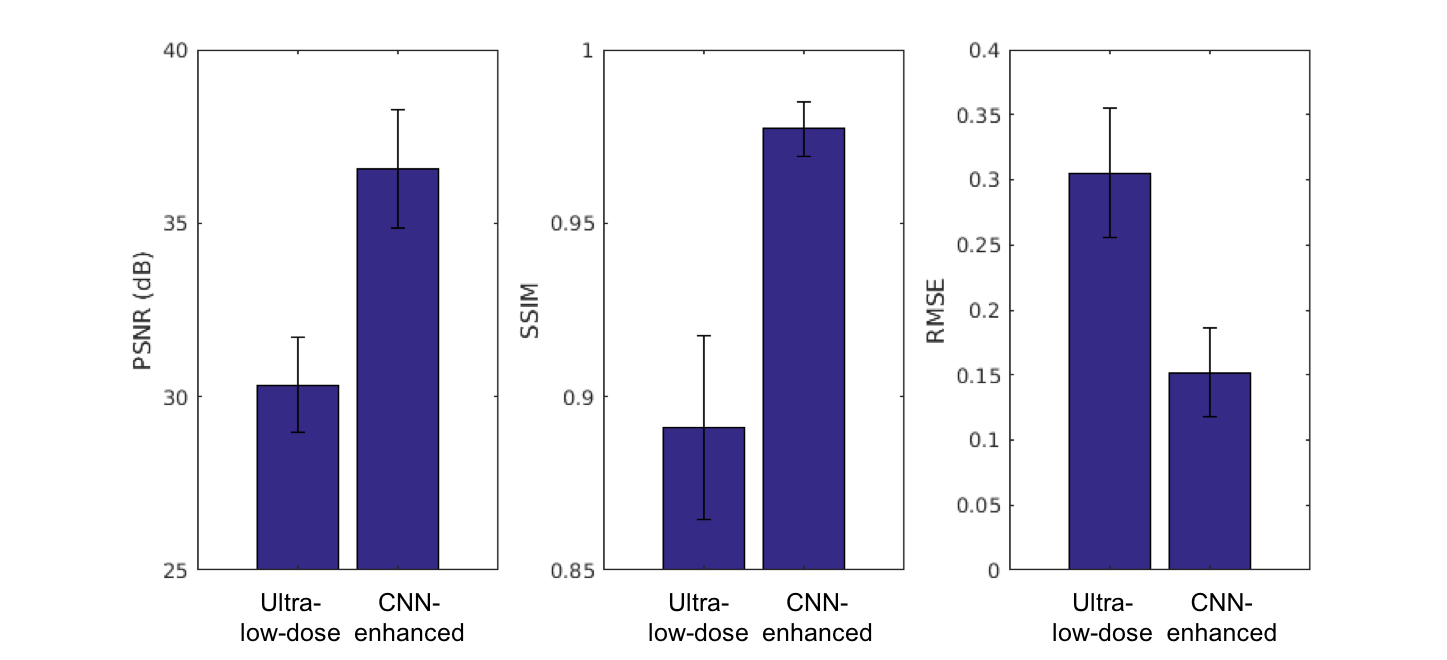
Data analysis: Using the software FreeSurfer, a brain mask derived from the T1 images of each subject was used for voxel-based analyses. The mean uptake values within the brain were calculated for all image types (full-dose images were multiplied by the low-dose percentage) and correlation coefficients were computed between image types. For each axial slice of the volumes, the image quality of the CNN-enhanced PET image and the low-dose PET images within the brain mask were compared to the original full-dose image using the metrics peak signal-to-noise ratio (PSNR), structural similarity (SSIM), and root mean square error (RMSE). The CNN-enhanced, full-dose, and ultra-low-dose PET images of each subject were anonymized and a certified neuroradiologist determined its amyloid uptake (positive/negative) status as well as image quality (5-point scale).
Results and Discussion
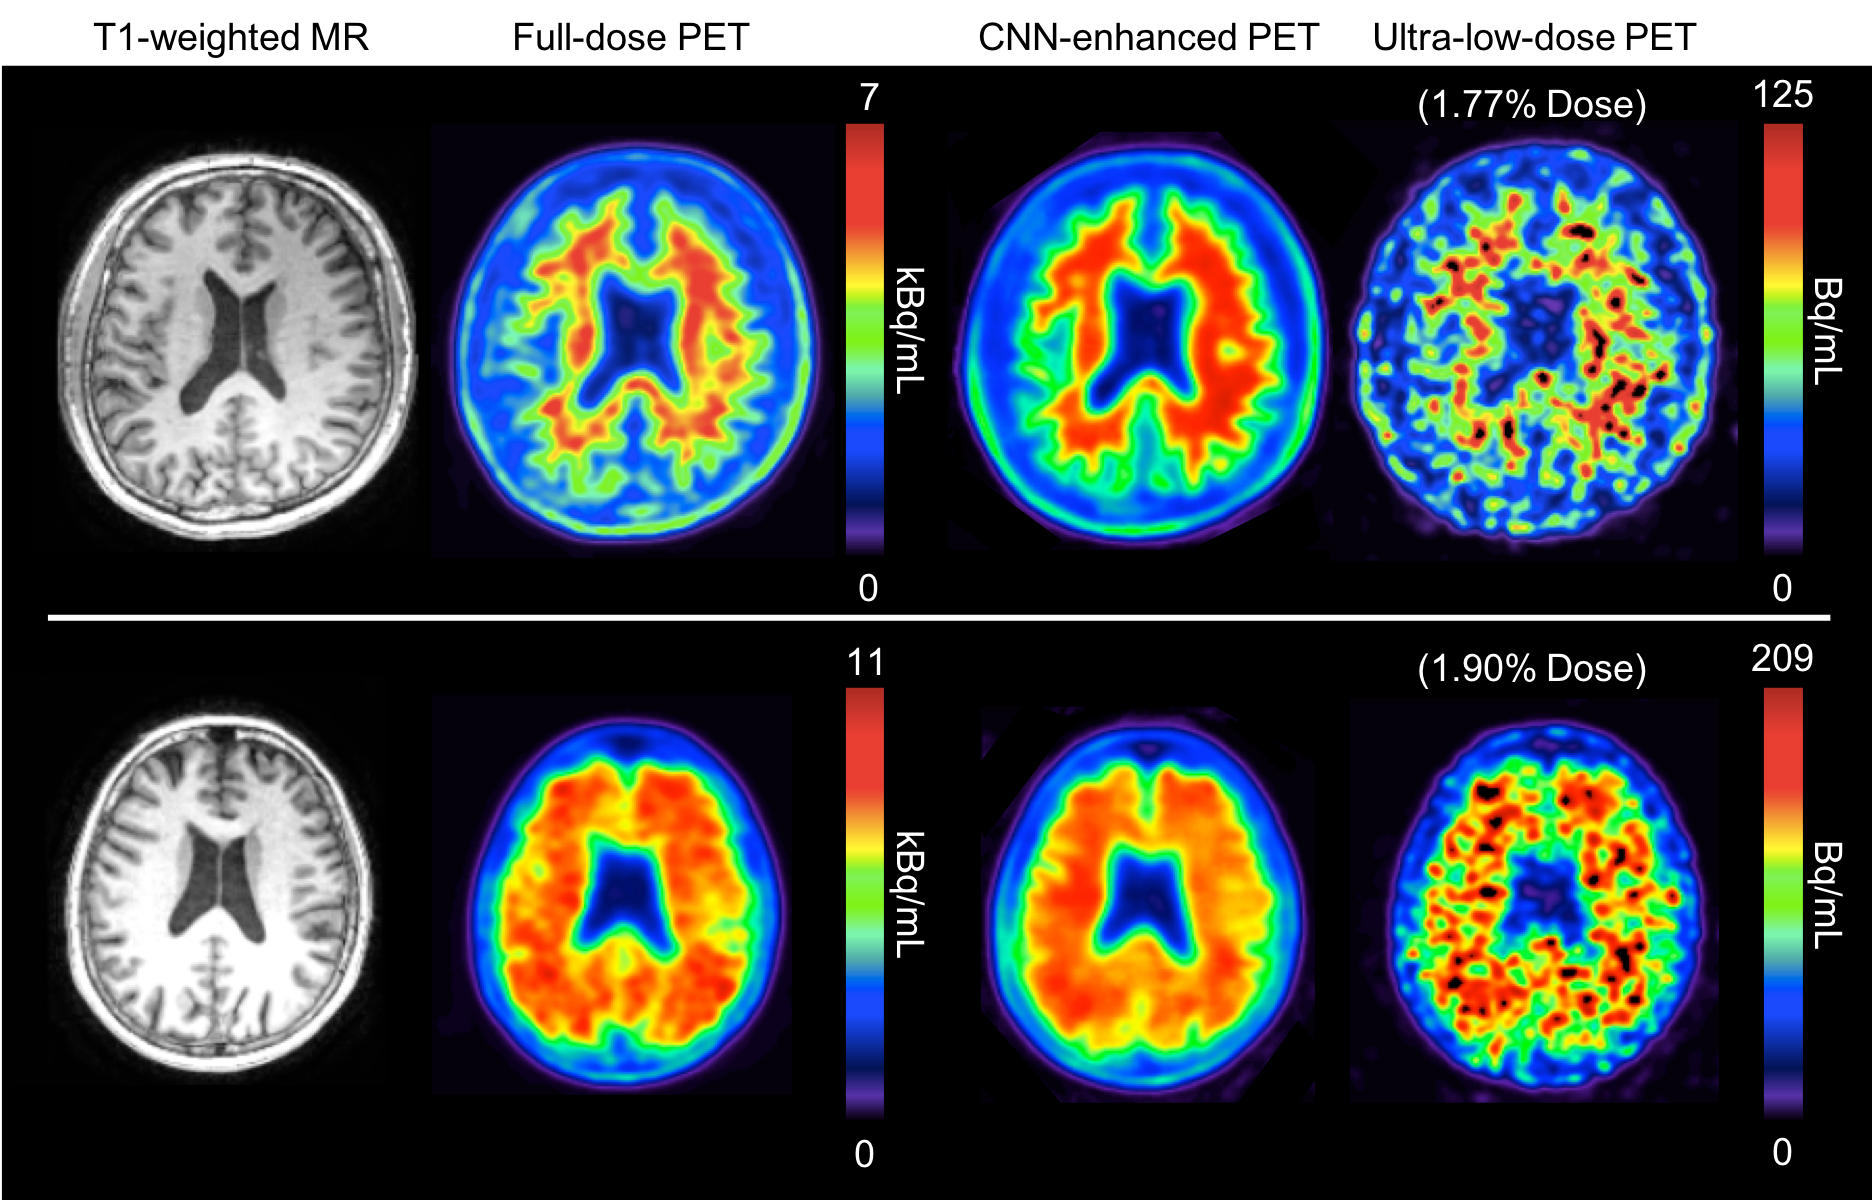
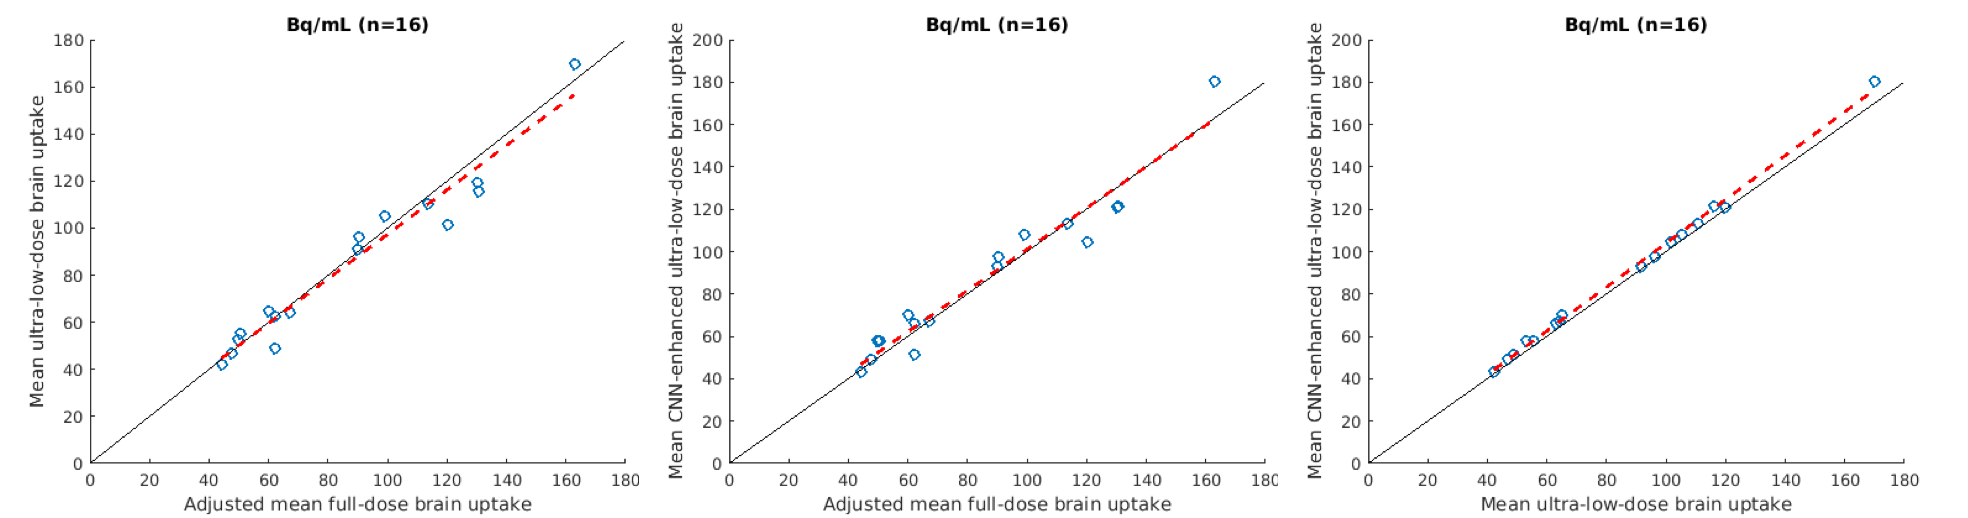
Qualitatively, the CNN-enhanced images show marked improvement in noise reduction to the ultra-low-dose image and resemble the ground truth image (Figure 2). The mean radiotracer uptake within the brain highly correlated across image types, validating the amount of tracer injected for the ultra-low-dose portion (Figure 3). The readings of the full-dose image and the CNN-enhanced images showed substantially high agreement between the two image types (Cohen’s kappa=0.61). Most (10/16) of the ultra-low-dose images were uninterpretable. The reader also preferred the CNN-enhanced images (image quality score 3.75±0.68), which scored close to the full-dose images (4.19±0.66), much more than the ultra-low-dose images (1.25±0.45). Quantitatively, image quality as indicated by all three metrics improved dramatically for all datasets (Figure 4) from the ultra-low-dose images to the CNN-enhanced images.Conclusion
This work has shown that diagnostic amyloid PET images can be generated using trained CNNs with simultaneously-acquired MR images and noisy PET images reconstructed from actual ultra-low-dose radiotracer injections.Acknowledgements
This project was made possible by the NIH grant P41-EB015891, GE Healthcare, the Foundation of the ASNR, and Life Molecular Imaging.References
1. Drzezga A, Barthel H, Minoshima S, Sabri O. “Potential Clinical Applications of PET/MR Imaging in Neurodegenerative Diseases.” J Nucl Med. 2014 Jun 1;55(Supplement 2):47S-55S.
2. Rowe, C.C. and V.L. Villemagne, “Brain amyloid imaging.” J Nucl Med, 2011. 52(11): p. 1733-40.
3. Dickerson, B.C., et al., “The cortical signature of Alzheimer's disease: regionally specific cortical thinning relates to symptom severity in very mild to mild AD dementia and is detectable in asymptomatic amyloid-positive individuals.” Cereb Cortex, 2009. 19(3): p. 497-510.
4. Catana C, Drzezga A, Heiss W-D, Rosen BR. “PET/MRI for Neurologic Applications.” J Nucl Med. 2012 Dec;53(12):1916-25.
5. Chen, K.T., et al., “Ultra-Low-Dose (18)F-Florbetaben Amyloid PET Imaging Using Deep Learning with Multi-Contrast MRI Inputs.” Radiology, 2019. 290(3): p. 649-656.
6. Bland J, Mehranian A, Belzunce MA, et al. “MR-Guided Kernel EM Reconstruction for Reduced Dose PET Imaging.” IEEE Trans Radiat Plasma Med Sci. 2018;2(3):235-43.
7. Xiang, L., et al., “Deep Auto-context Convolutional Neural Networks for Standard-Dose PET Image Estimation from Low-Dose PET/MRI.” Neurocomputing, 2017. 267: p. 406-416.
Figures