2847
Deep learning-based target metabolite-specific signal isolation and big data-driven measurement uncertainty estimation in 1H-MRS of the brain
HyeongHun Lee1 and Hyeonjin Kim1,2
1Department of Biomedical Sciences, Seoul National University, Seoul, Republic of Korea, 2Department of Radiology, Seoul National University Hospital, Seoul, Republic of Korea
1Department of Biomedical Sciences, Seoul National University, Seoul, Republic of Korea, 2Department of Radiology, Seoul National University Hospital, Seoul, Republic of Korea
Synopsis
We developed convolutional-neural-networks(CNNs) for each individual metabolites capable of spectrally isolating target metabolite signal for quantification on simulated rat brain spectra at 9.4T. Although heuristically and empirically developed, a method of predicting measurement uncertainty is also proposed by exploiting the spectral isolation capability of the CNNs and the availability of big data. The quantitative accuracy of the proposed method was higher than that of the LC model. The measurement uncertainty predicted by the proposed method was highly correlated with the ground-truth error. The proposed method may be used for metabolite quantification with measurement uncertainty estimation in rat brain at 9.4T.
INTRODUCTION
The machine learning/deep learning-based 1H-MRS studies have been accumulating,1-8 and its applicability in brain metabolite quantification has been demonstrated.4-7 However, the estimation of the measurement uncertainty in the machine-predicted metabolite concentrations such as the Cramer-Rao-lower-bounds(CRLB) in the LC model analysis(LCM)9 should also be important,6 but has not been reported.Given that the accuracy of metabolite quantification depends mainly on the degree-of-spectral-overlap(DSO), SNR, and linewidth, the measurement uncertainty may be estimated based on these three parameters. However, whereas the SNR and linewidth are typically estimated from a representative singlet(e.g., tNAA), DSO should be estimated specific to individual metabolites.
To this end, we developed convolutional neural networks(CNNs) specific to each individual metabolites for rat brain at 9.4T, which are capable of spectrally isolating a designated metabolite. Using this approach, the CNN-predicted spectra allow not only for the quantification but also for the direct estimation of the signal-to-background-ratio(SBR) of individual metabolites as a measure of DSO. The CNN-predicted, but error-containing SBR is corrected for by referring to a dictionary built on the big training data, and used for the prediction of the measurement uncertainty in combination with SNR and linewidth. The proposed method was tested on the two groups of simulated spectra.
METHODS
∙ Spectra Simulation: The metabolite basis spectra for 27 metabolites and the baseline basis spectra(10 resonance groups) were simulated first, and used for the simulation of 100,000 spectra7,11(training/validation/test=80,000/10,000/10,000) by randomly varying the relative metabolite concentrations and baseline resonance group amplitudes, SNR, and linewidth within the predefined ranges for normal rat brain at 9.4T. This data set(spectra-set I) was used as the CNN input. The corresponding ground-truth(GT) spectra were generated by including one target metabolite signal to be isolated and tCr signal as a reference for all metabolites per each simulated rat brain spectrum(Fig.1). An additional set of spectra(spectra-set II) was simulated using the spectra acquired from three metabolite phantoms, each of which contained different relative concentrations of 17 key brain metabolites (shown in Fig.2; tCr(=Cr+PCr) used as a reference). These metabolite spectra were combined with metabolite-nulled baseline spectra acquired from three rats using double-inversion.11 The SNR and linewidth of the combined spectra were adjusted with six and three different values, respectively, to simulate 54 spectra(3-linewidth × 6-SNR × 3-spectra).∙ CNN: The CNNs were designed and Bayesian-optimized12,13 for individual metabolites (Tensorflow(Google))(Fig.1). The CNNs were also saved in the middle of training when the validation curve starts deviating from the training curve(avoiding overfitting) and used for the generation of the dictionary for the measurement uncertainty estimation.
∙ Metabolite Quantification: Individual metabolites are quantified from the CNN-predicted spectra by estimating the metabolite ‘signal’ relative to the co-isolated tCr signal(Fig.1). The ‘background’ of the metabolites are measured from the input spectra along with the SNR and linewidth(Fig.2A).
∙ Estimation of Measurement Uncertainty: For an input spectrum, the CNNs predict spectrally isolated individual metabolite signal, from which the SBR of the metabolites are measured(Fig.2A). Then, for each metabolite, a bin corresponding to the SNR-linewidth-SBR(SLS) coordinate is identified from the 3-D SLS space(Fig.2B). For all data points in that bin, the SBRCNN are adjusted to the SBRGT(Fig.2C). Finally, a set of quantitative errors corresponding to the data points with the SBRGT are obtained from the 3-D error space(Fig.2D), among which the maximum error is chosen as the predicted error.
∙ Evaluation of Proposed Method: The proposed method was evaluated on the test set in spectra-set I and the whole spectra in spectra-set II in terms of the mean-absolute-percent-error(MAPE) of the metabolite concentrations. For spectra-set II, the results were compared with the metabolite concentrations(CRLB<50%) and CRLB from LCM.
RESULTS
Using the proposed method, the MAPE from the spectra-set I was 13.30±9.18% and the correlation between the predicted measurement uncertainty and the GT errors were r=0.89±0.11 over the key metabolites.The representative spectra of spectra-set II and the CNN-predicted metabolite spectra are shown in Fig.3. The MAPE from the CNNs(23.07±16.36%) were significantly lower than those from LCM for the majority of the metabolites(Fig.4A). The measurement uncertainty predicted by the proposed method were inclusive of(no less than), and highly correlated with, the GT error for the majority of the metabolites(r~0.7 or higher(0.78±0.05))(Fig.4B, Table.1). For the CRLB from LCM(Fig.4C), only Ala and PE showed statistically significant positive correlations(Table.1).
DISCUSSION
Compared to the results on the spectra-set I, the performance of the proposed method was degraded on the spectra-set II. Nonetheless, the quantitative accuracy of the proposed method was significantly higher than that of LCM(Fig.4). The CRLB is of great help in screening the fitted data before statistical analysis. However, it is also known to be a measure of the fitting precision, not the accuracy,14 as demonstrated also in this study. In contrast, the proposed error prediction, although heuristic and empirical, is based on the GT errors and thus indicative of the accuracy of the CNN-predicted metabolite concentrations as demonstrated by the high correlations between the predicted errors and the GT errors(Table.1).CONCLUSION
The proposed method may be used for metabolite quantification with measurement uncertainty estimation in rat brain at 9.4T by exploiting the target metabolite-specific signal isolation capability of the CNNs and the availability of big spectral data.Acknowledgements
This work was supported by the National Research Foundation of Korea (NRF) grant funded by the Ministry of Education, Science and Technology (2016R1D1A1B03931233) and the Korea government (MSIT) (2019R1A2C1002433), by grant no 800-20180198 from Seoul National University College of Medicine, and by a Data Science Research Grant from the Big Data Institute, Seoul National University.References
- Kyathanahally SP, Doring A, Kreis R. Deep learning approaches for detection and removal of ghosting artifacts in MR spectroscopy. Magn Reson Med. 2018;80(3):851–863.
- Gurbani SS, Schreibmann E, Maudsley AA, et al. A convolutional neural network to filter artifacts in spectroscopic MRI. Magn Reson Med. 2018;80(5):1765–1775.
- Das D, Coello E, Schulte RF, Menze BH. Quantification of metabolites in magnetic resonance spectroscopic imaging using machine learning. International Conference on Medical Image Computing and Computer-Assisted Intervention. Springer, Cham. 2017;462–470.
- Hatami N, Sdika M, Ratiney H. Magnetic resonance spectroscopy quantification using deep learning. International Conference on Medical Image Computing and Computer-Assisted Intervention. Springer, Cham. 2018;467–475.
- Iqbal Z, Nguyen D, Thomas MA, Jiang S. Acceleration and quantitation of localized correlated spectroscopy using deep learning: A pilot simulation study. 2018; arXiv:1806.11068.
- Gurbani SS, Sheriff S, Maudsley AA, Shim H, Cooper LAD. Incorporation of a spectral model in a convolutional neural network for accelerated spectral fitting. Magn Reson Med. 2019;81(5):3346–3357.
- Lee HH, Kim H. Intact metabolite spectrum mining by deep learning in proton magnetic resonance spectroscopy of the brain. Magn Reson Med. 2019;82(1):33–48.
- Kyathanahally SP, Mocioiu V, Pedrosa de Barros N, et al. Quality of clinical brain tumor MR spectra judged by humans and machine learning tools. Magn Reson Med. 2018;79(5):2500–2510.
- Provencher SW. Estimation of metabolite concentrations from localized in vivo proton NMR spectra. Magn Reson Med. 1993;30(6):672–679.
- Mlynárik V, Gambarota G, Frenkel H, Gruetter R. Localized short-echo-time proton MR spectroscopy with full signal-intensity acquisition. Magn Reson Med. 2006;56(5):965–970.
- Lee HH, Kim H. Parameterization of spectral baseline directly from short echo time full spectra in 1H-MRS. Magn Reson Med. 2017;78(3):836–847.
- Snoek J, Larochelle H, Adams RP. Practical bayesian optimization of machine learning algorithms. Advances in neural information processing systems. 2012; 2951–2959.
- Raschka S. Model evaluation, model selection, and algorithm selection in machine learning. 2018;arXiv:1811.12808.
- Pope WB, Prins RM, Albert Thomas M, et al. Non-invasive detection of 2-hydroxyglutarate and other metabolites in IDH1 mutant glioma patients using magnetic resonance spectroscopy. J Neurooncol. 2012;107(1):197–205.
Figures
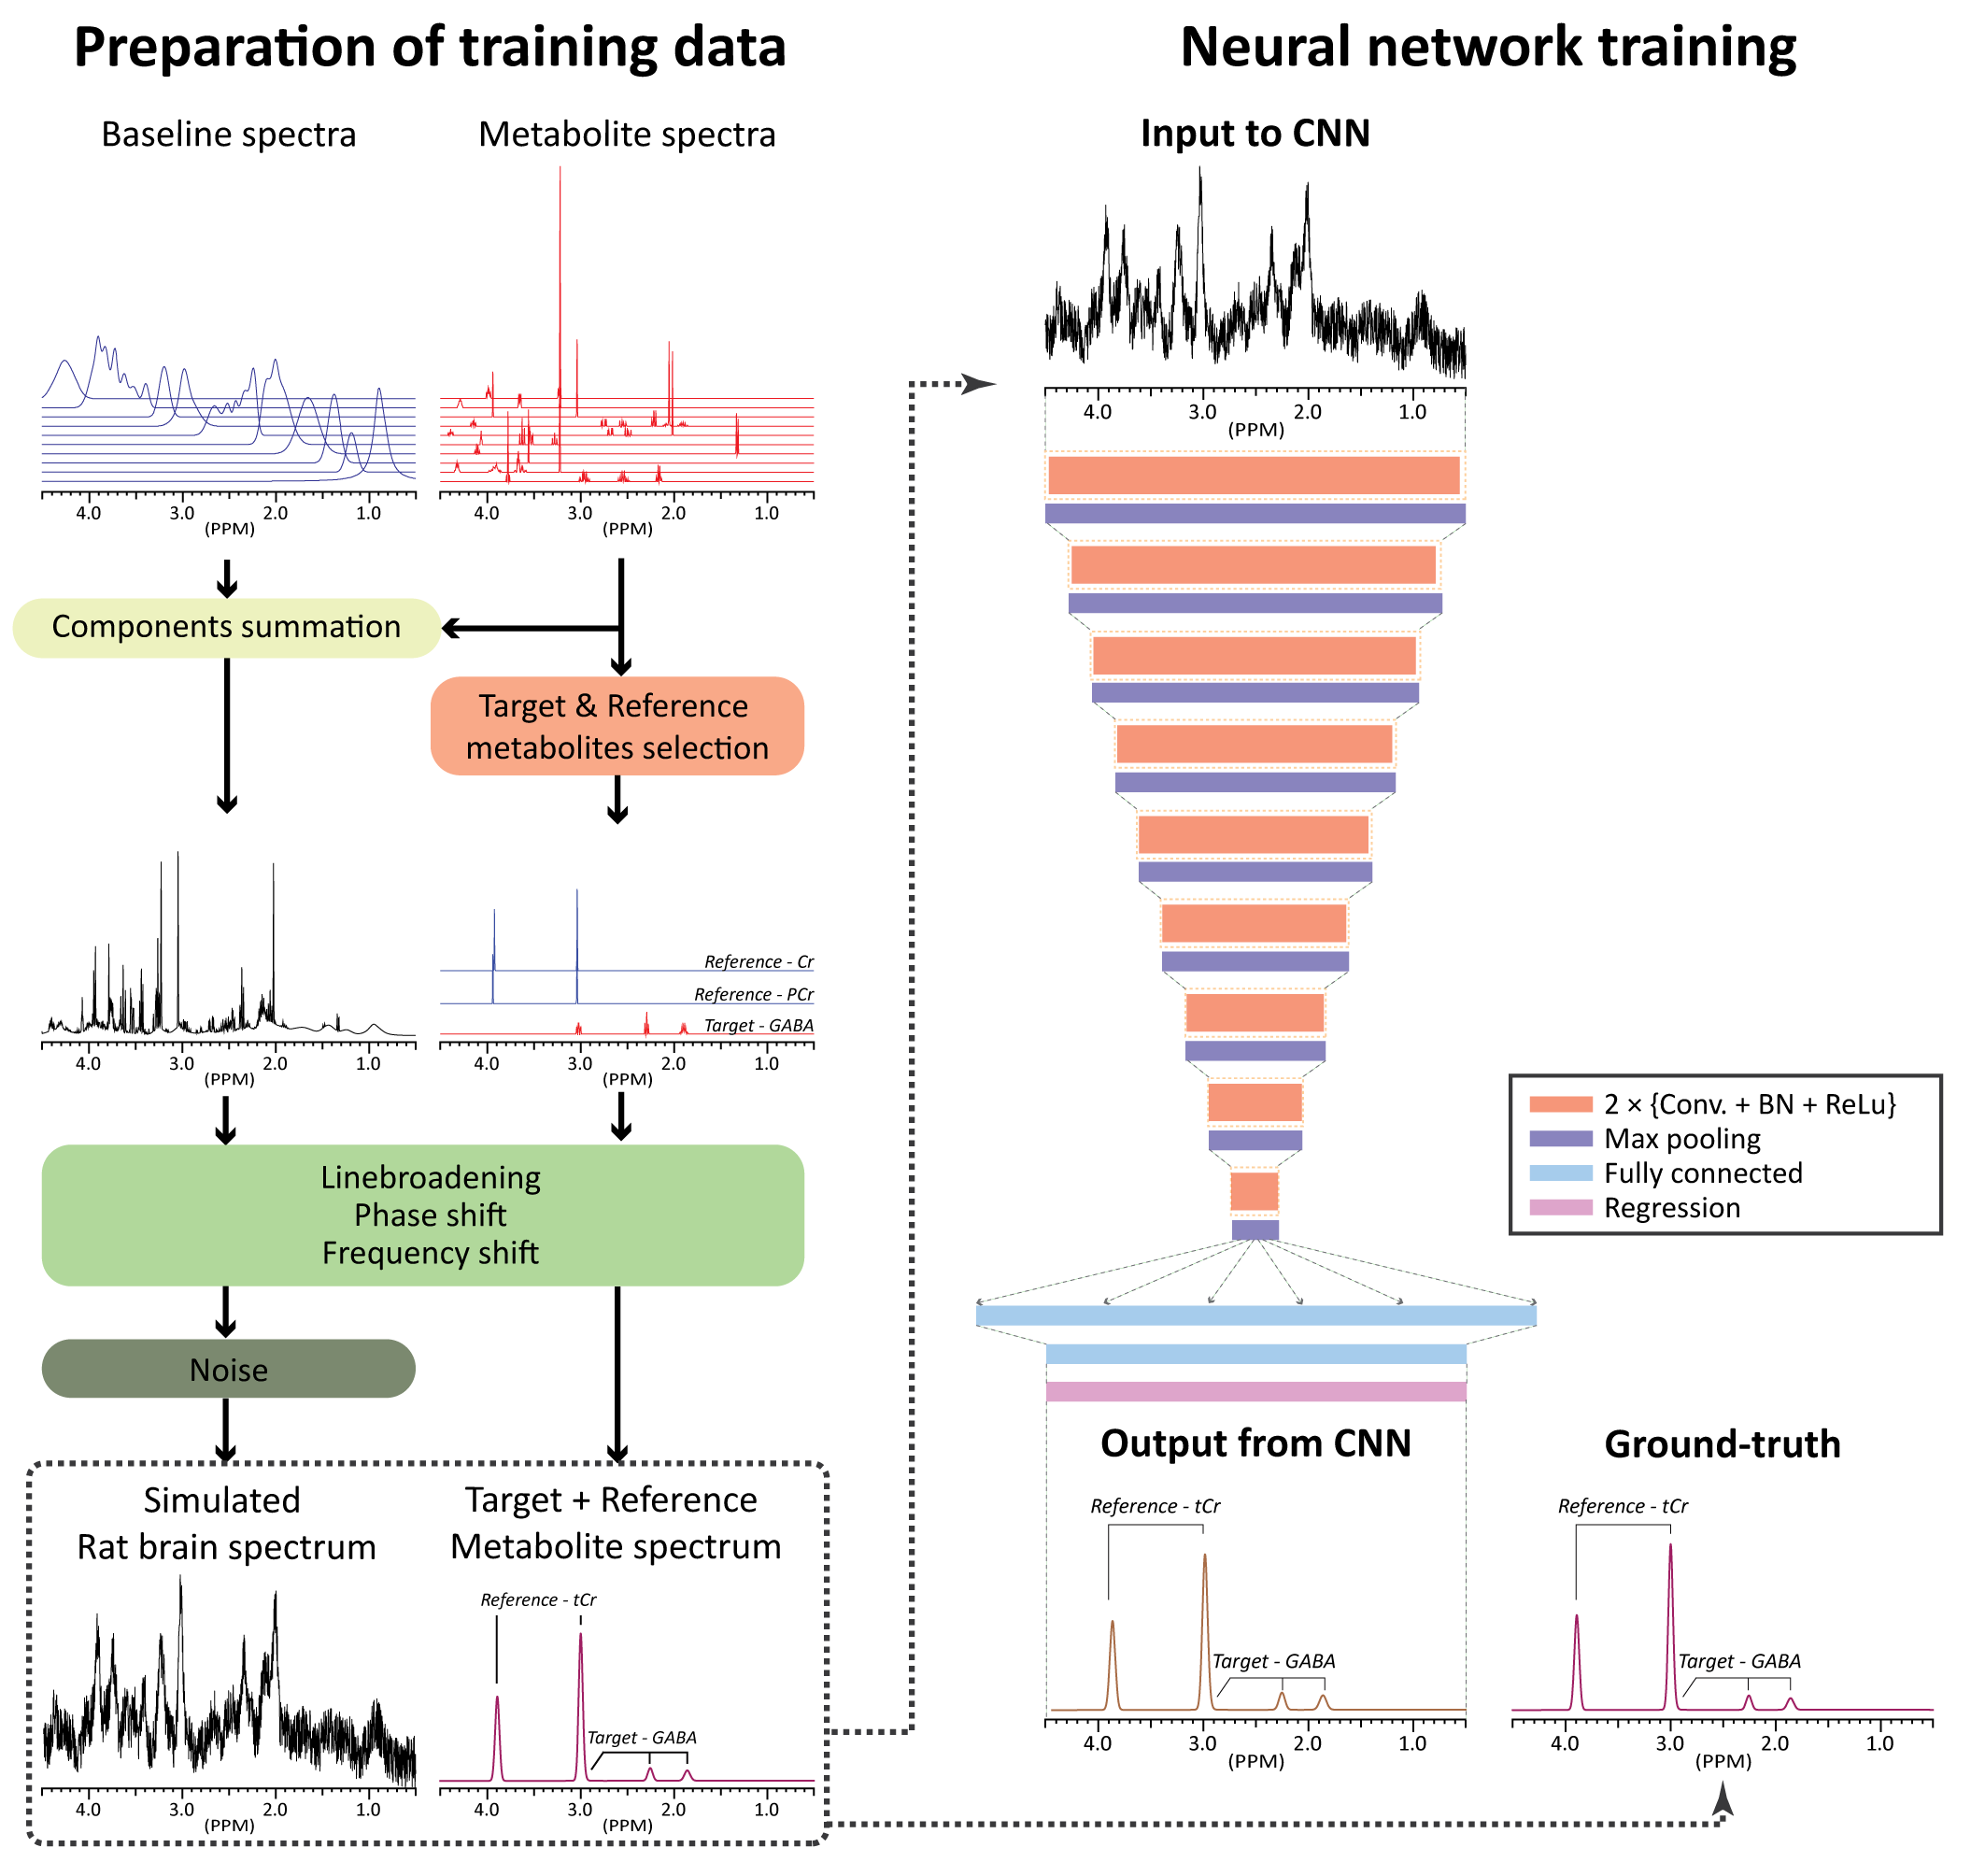
(FIGURE 1) A schematic of the simulation of rat brain spectra at
9.4T and the training of the CNN. CNNs are trained for each individual metabolites
such that each CNN spectrally isolates signals only from a designated target
metabolite (GABA in this example) and tCr as a reference. For quantification, spectra to be analyzed are fed to all
CNNs. Metabolites are quantified from the CNN-predicted spectra relative to the
tCr signal at 3.0 ppm. For those metabolites overlapping with the tCr signal at
3.0 ppm, they are quantified using the tCr signal at 3.9 ppm and scaled
accordingly.
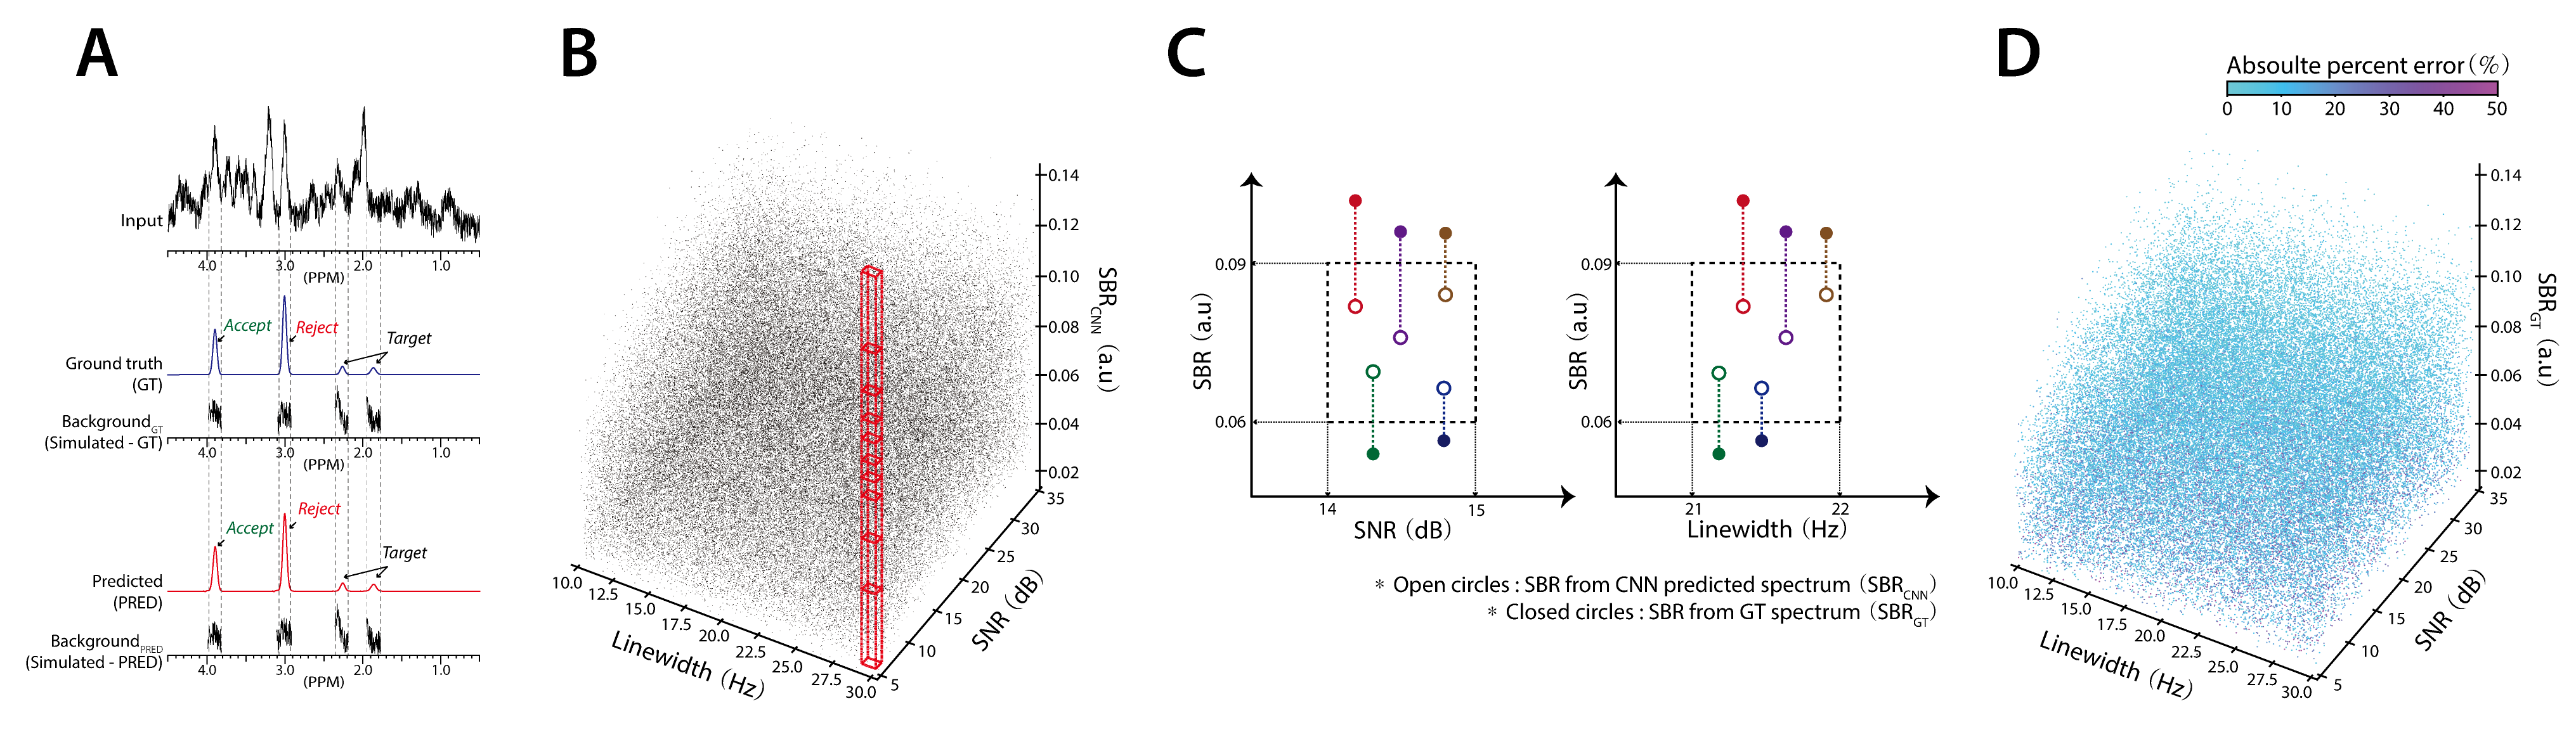
(FIGURE 2) A: Using the CNNs saved in the middle of training,
CNN-predicted spectra are obtained from the whole training data. The SBR
of each metabolite is estimated from the predicted spectra and GT spectra. The
SNR and linewidth are measured from the input spectra. B: The
SNR-linewidth-SBR (SLS) space is constructed per metabolite. The space is
segmented with 3-D bins (heuristically optimized bin size). C: The relationship between the
CNN-predicted SBR (SBRCNN) and GT SBR (SBRGT) are stored.
D: The quantitative error is stored per
metabolite as a function of SNR, linewidth, and SBRGT.
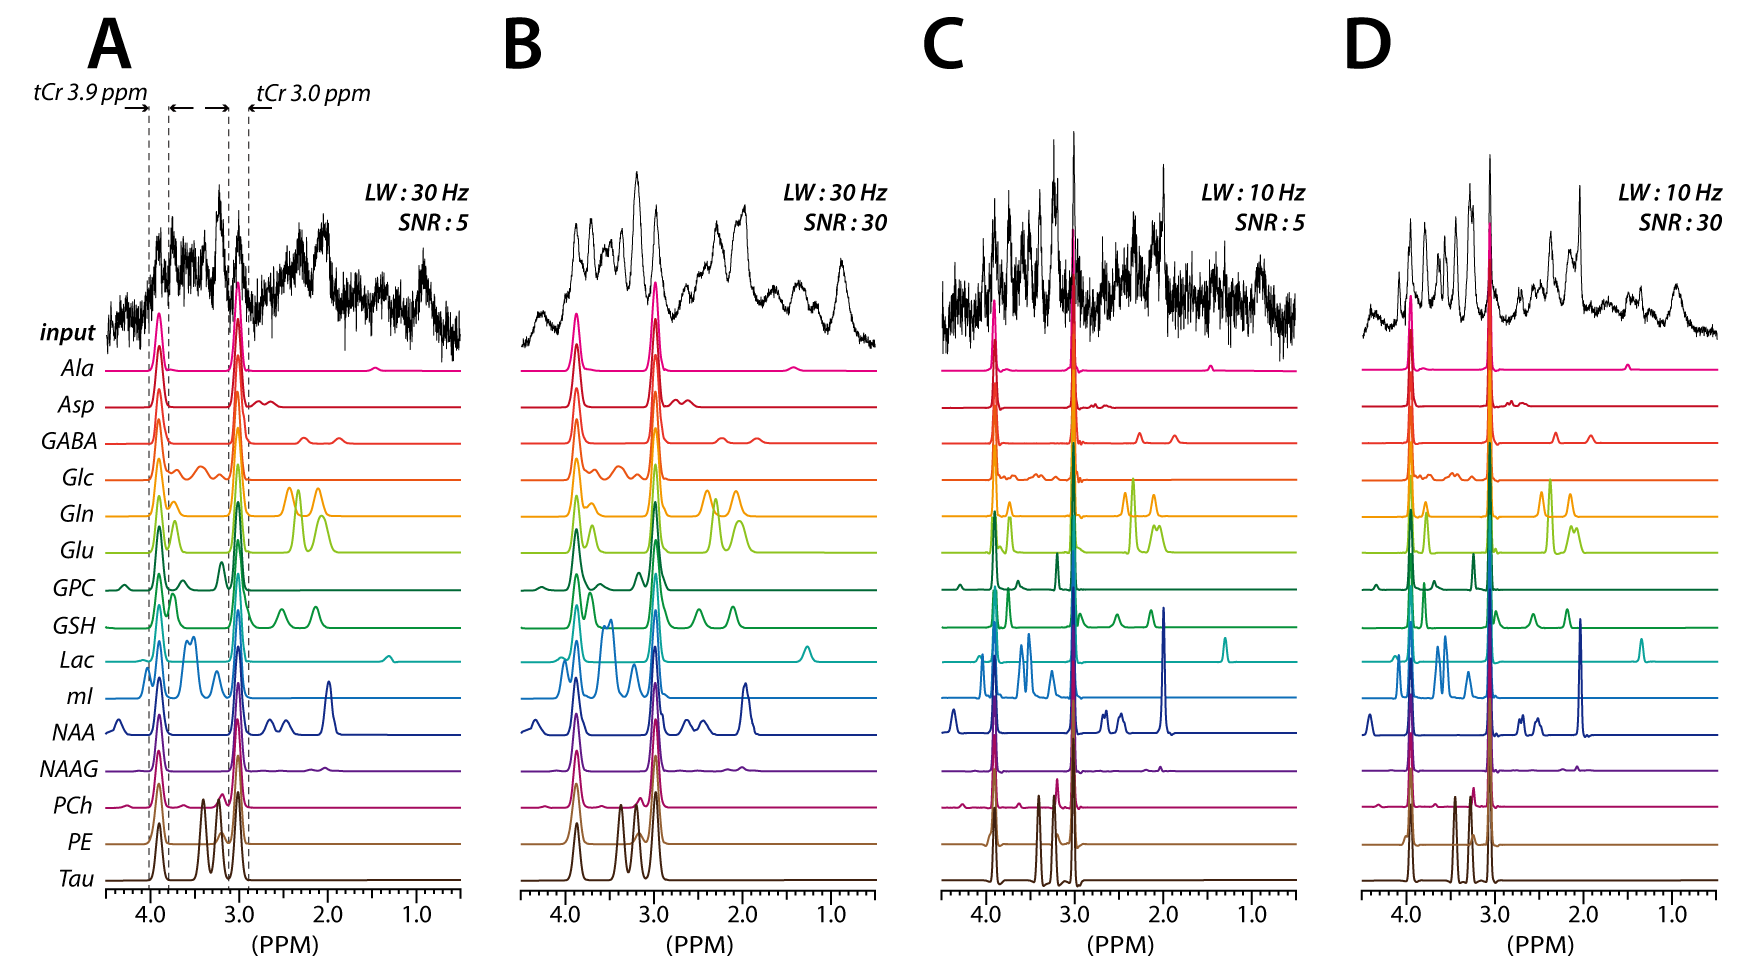
(FIGURE 3) The representative rat brain spectra simulated by
using the metabolite phantom spectra and in vivo baselines (spectra-set II) and the corresponding
CNN-predicted individual metabolite spectra for the key metabolites. All
CNN-input spectra (input) have the same relative metabolite concentrations but
with different combinations of SNR and linewidth (LW). Note the robust
performance of the CNNs against the substantially different SNR.
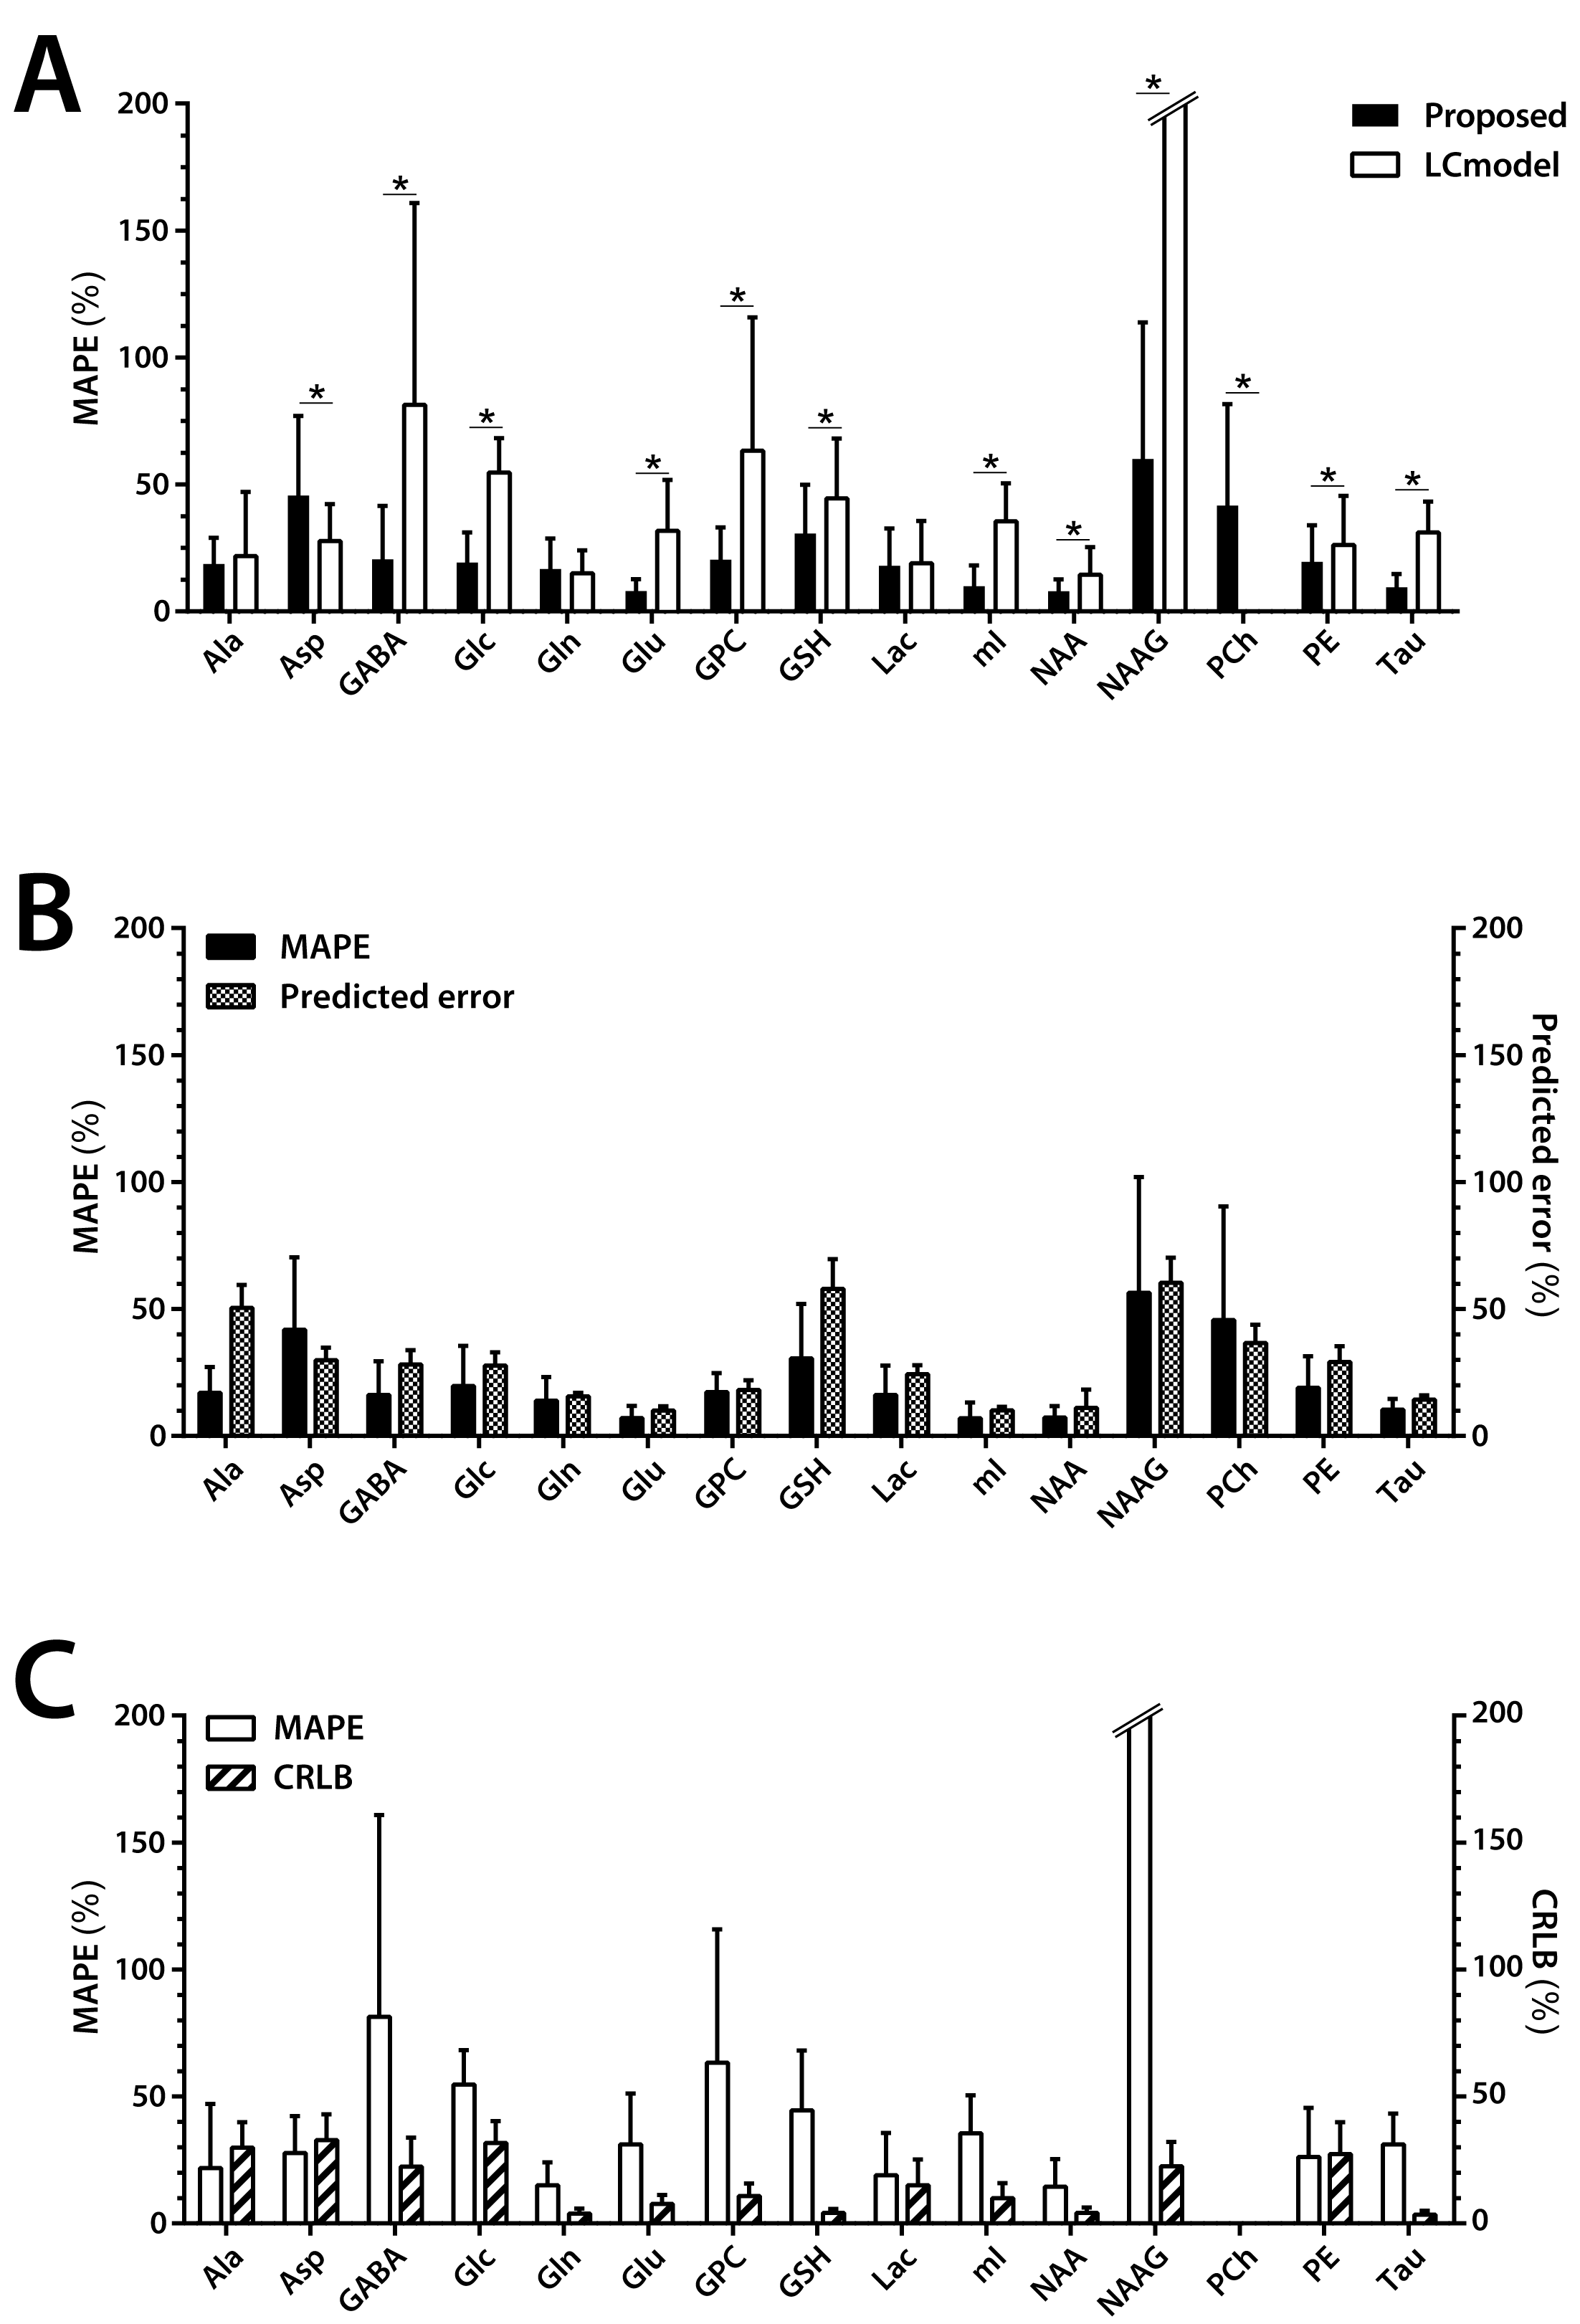
(FIGURE 4) The performance of the proposed method and the LC
model (LCM) on the simulated spectra by using the metabolite phantom spectra
and in vivo baselines (spectra-set II;
N=54). A: Comparison of the mean
absolute percent errors (MAPE) obtained from the proposed method and LCM. *
statistically significant difference. B:
Comparison between the ground truth (GT) errors (MAPE) and the predicted errors
by the proposed method. C:
Comparison between the GT errors (MAPE) and the CRLB from LCM. Note that PCh
was quantified with CRLB>50% for all spectra and thus omitted in A and C.
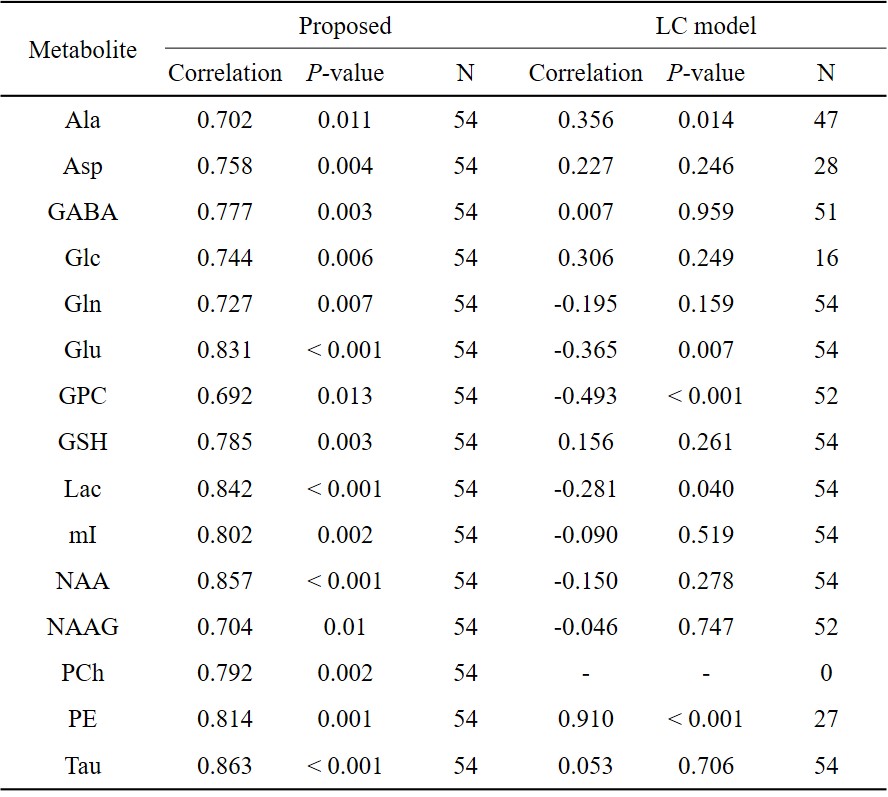
(TABLE 1) Correlations of the ground truth errors (absolute
percent error) with the predicted errors by the proposed method (Proposed) and
with CRLB obtained from the LC model for the key metabolites.