2840
Gadolinium deposition in cortical Bone after repeated administration of Magnevist and Gadovist assessed by ultrashort echotime based T1 mapping1Southern Medical University, Guang Zhou, China, 2Imaging department of Southern Medical University affiliated the third hospital, Guang Zhou, China, 3School of Biomedical Engineering, Guangdong Provincial Key Laborary of Medical Image Processing, Southern Medical University, Guang Zhou, China, 4Philips Healthcare, Guang Zhou, China, 5Department of Radiology, University of California San Diego, San Diego, CA, United States
Synopsis
In this preclinical study, we assessed feasibility of evaluating Gadolinium deposition in cortical bone by using recently developed actual flip angle variable repetition time 3D ultrashort echotime technique in rabbit model at 7T. Twenty times of administration of clinical equivalent dose of Magnevist and Gadovist that normalized according to body surface by U.S. FDA recommendation, and three times the dose of Gadovist (high-dose group) were investigated. Significant lower T1 values were observed in Magnevist administration group, Gadovist administration group and high-dose Gadovist administration group compared to control group, suggested T1 mapping might be a potential biomarker for evaluating Gadolinium deposition.
Introduction
Gadolinium(Gd) retention in body after administration of Gadolinium based contrast agents(GBCAs) in clinical routinely contrast enhanced MRI attracts attentions of clinicians and scientists, and bone is reported major target of Gd retention(1,2). Delayed release of Gd from bone would lead to potential chronic toxicity to body(3). Thus, assessing deposited Gd in bone would benefit clinical decision and management of this risk factor in body. To date, noninvasive assessing Gd deposition in bone is still lacking(4). In this work, we aimed to investigate the feasibility of assessing Gd deposition in rabbit cortical bone by using MRI based T1 mapping.Method
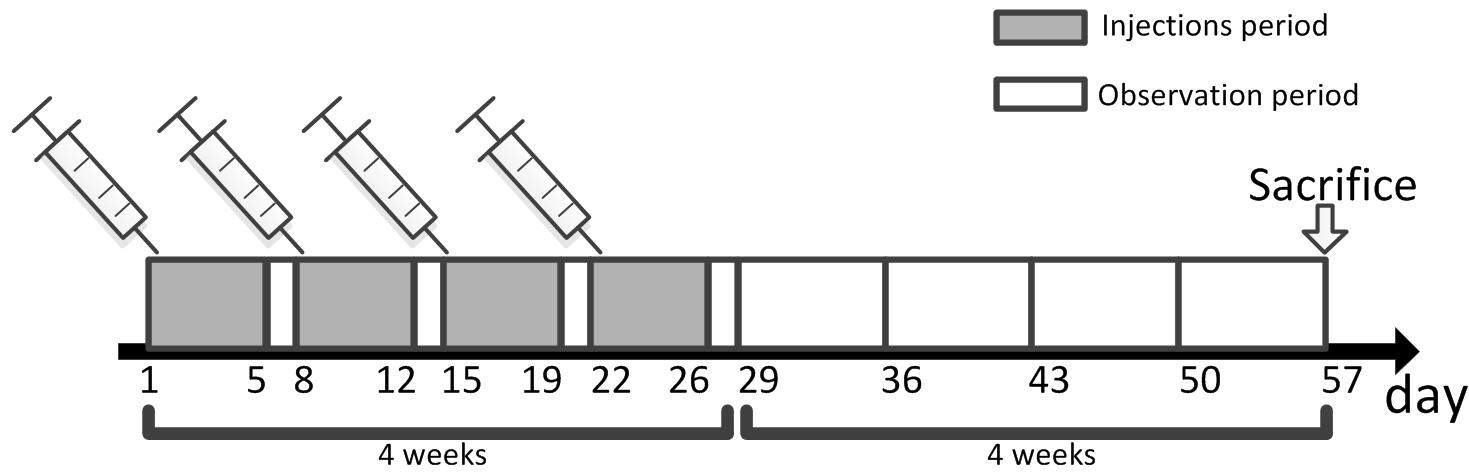
Animals: This study was approved by local Ethics Review Board. Twenty-eight male adult rabbits(3-3.5 Kg) were involved and randomly allocated into: control group, linear GBCAs group, macrocyclic GBCAs group and high-dose macrocyclic GBCAs group(n=7 for each group), and daily administrated by 0.9ml/kg bodyweight saline, 0.3 mmol/kg bodyweight Magnevist, 0.3mmol/kg bodyweight Gadovist and 0.9 mmol/kg bodyweight Gadovist, respectively, for 5 consecutive days per week over period of 4-weeks. Rabbits were then allowed for 4-week rest and sacrificed for left-tibia collection(Figure 1).Sample preparation: Harvested tibias were cleared of external muscle and soft tissues, and bone marrows were removed by a scalpel. Tibias were cut into segments with approximate length of 4 cm, and then froze at -20℃ in an freezer for short-term storage. Samples were allowed to thaw in phosphate buffered saline solution at 4℃ for 24 hours prior MR imaging. Each bone sample was immersed in Fomblin in a 5 ml centrifuge tube during MR imaging to minimize susceptibility effects at bone-air interface.
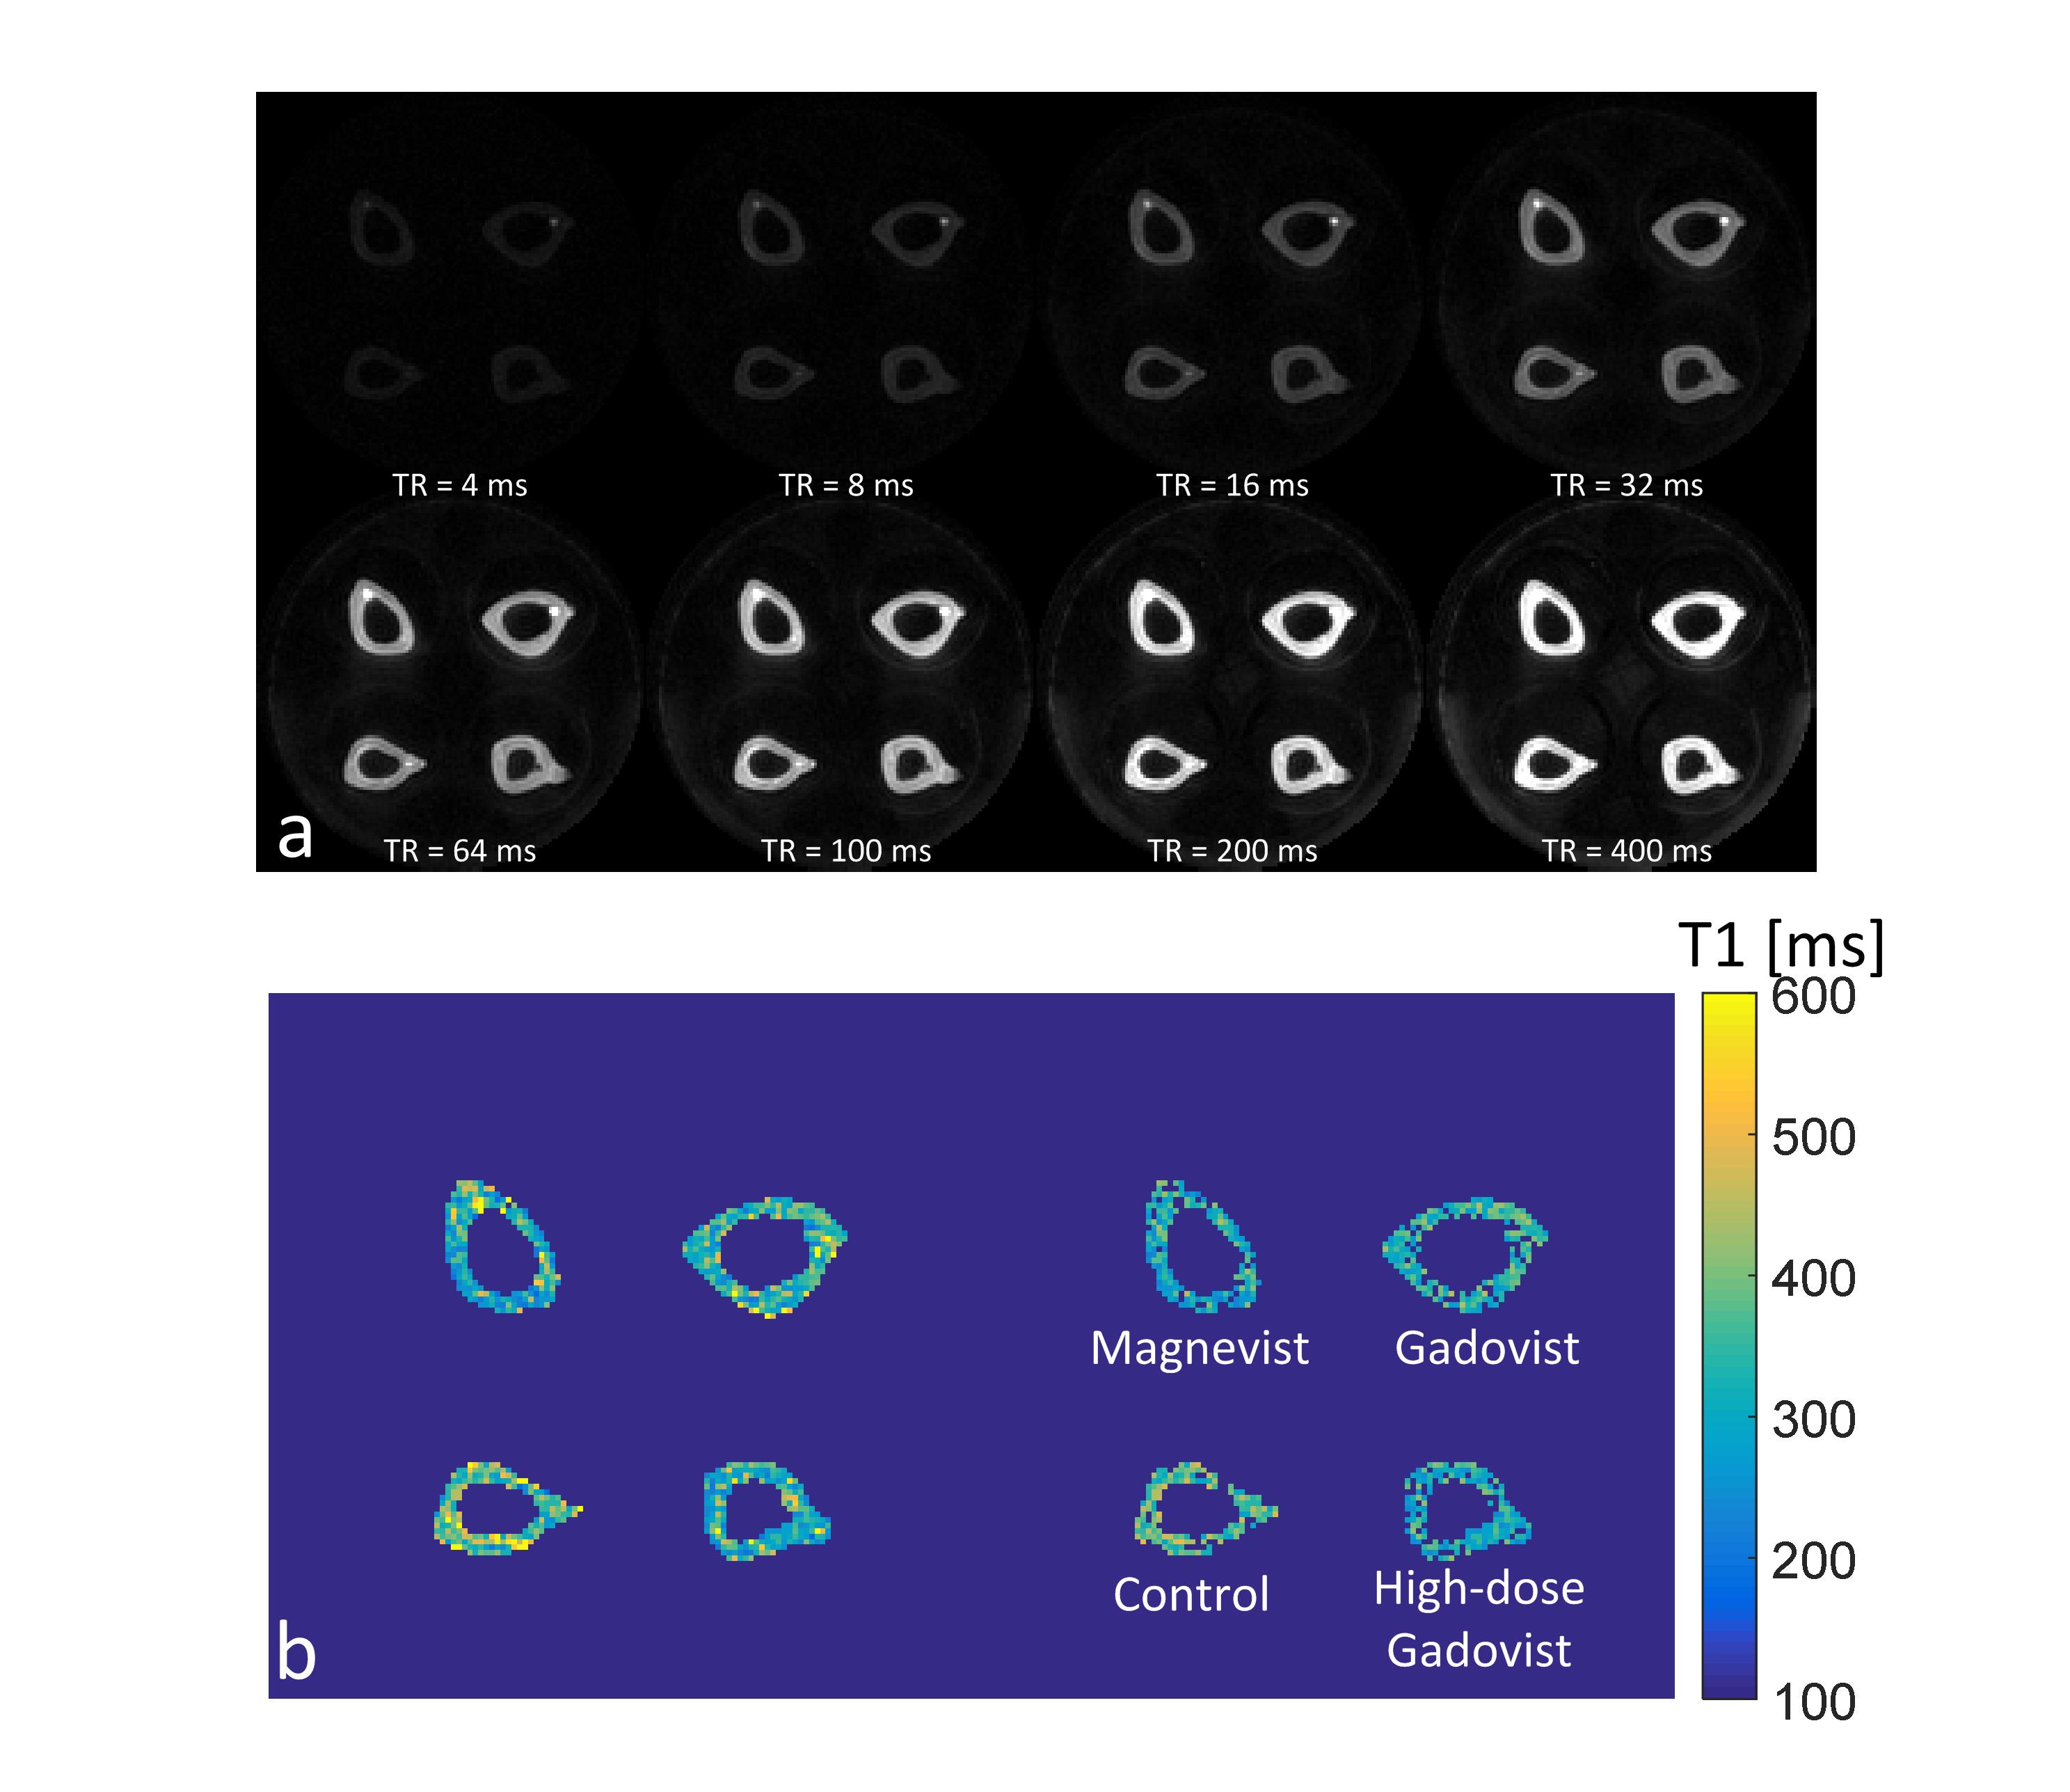
MR imaging: MRI data were acquired with volumetric transceiver coil on a 7T animal MR scanner(PharmaScan, Bruker BioSpin, Ettlingen, Germany) whose equipped gradient system have a maximum gradient strength of 380 mT/m and a maximum slew rate of 3420 mT/m/ms. Non-selective rectangular pulse with maximum available power of 329 W and duration of 10 us was employed for signal excitation. Central-out radial trajectory based 3D UTE sequence, whose data sampling started at k-space center and acquired along gradient ramp via non-linear sampling, with a nominal TE of 11 us was implemented for signal readout. 3D UTE with variable repetition time(TR) was implemented for T1 quantification according to VTR-UTE scheme. Details of MR parameters were: TR = 4, 8, 16, 32, 64, 100, 200, 400 ms, TE = 11 us, nominal flip angle = 35 degree, field of view = 40Х40Х60 mm3, matrix = 128Х128Х128, under-sample factor = 1.5, number of projections = 34242, band-width = 500kHz,. For B1 field correction, 3D UTE based AFI which interleaved acquired signals at two TRs, i.e. TR1 = 20 ms and TR2 = 100 ms, was implemented with same excitation pulse and geometry parameters as VTR-UTE.
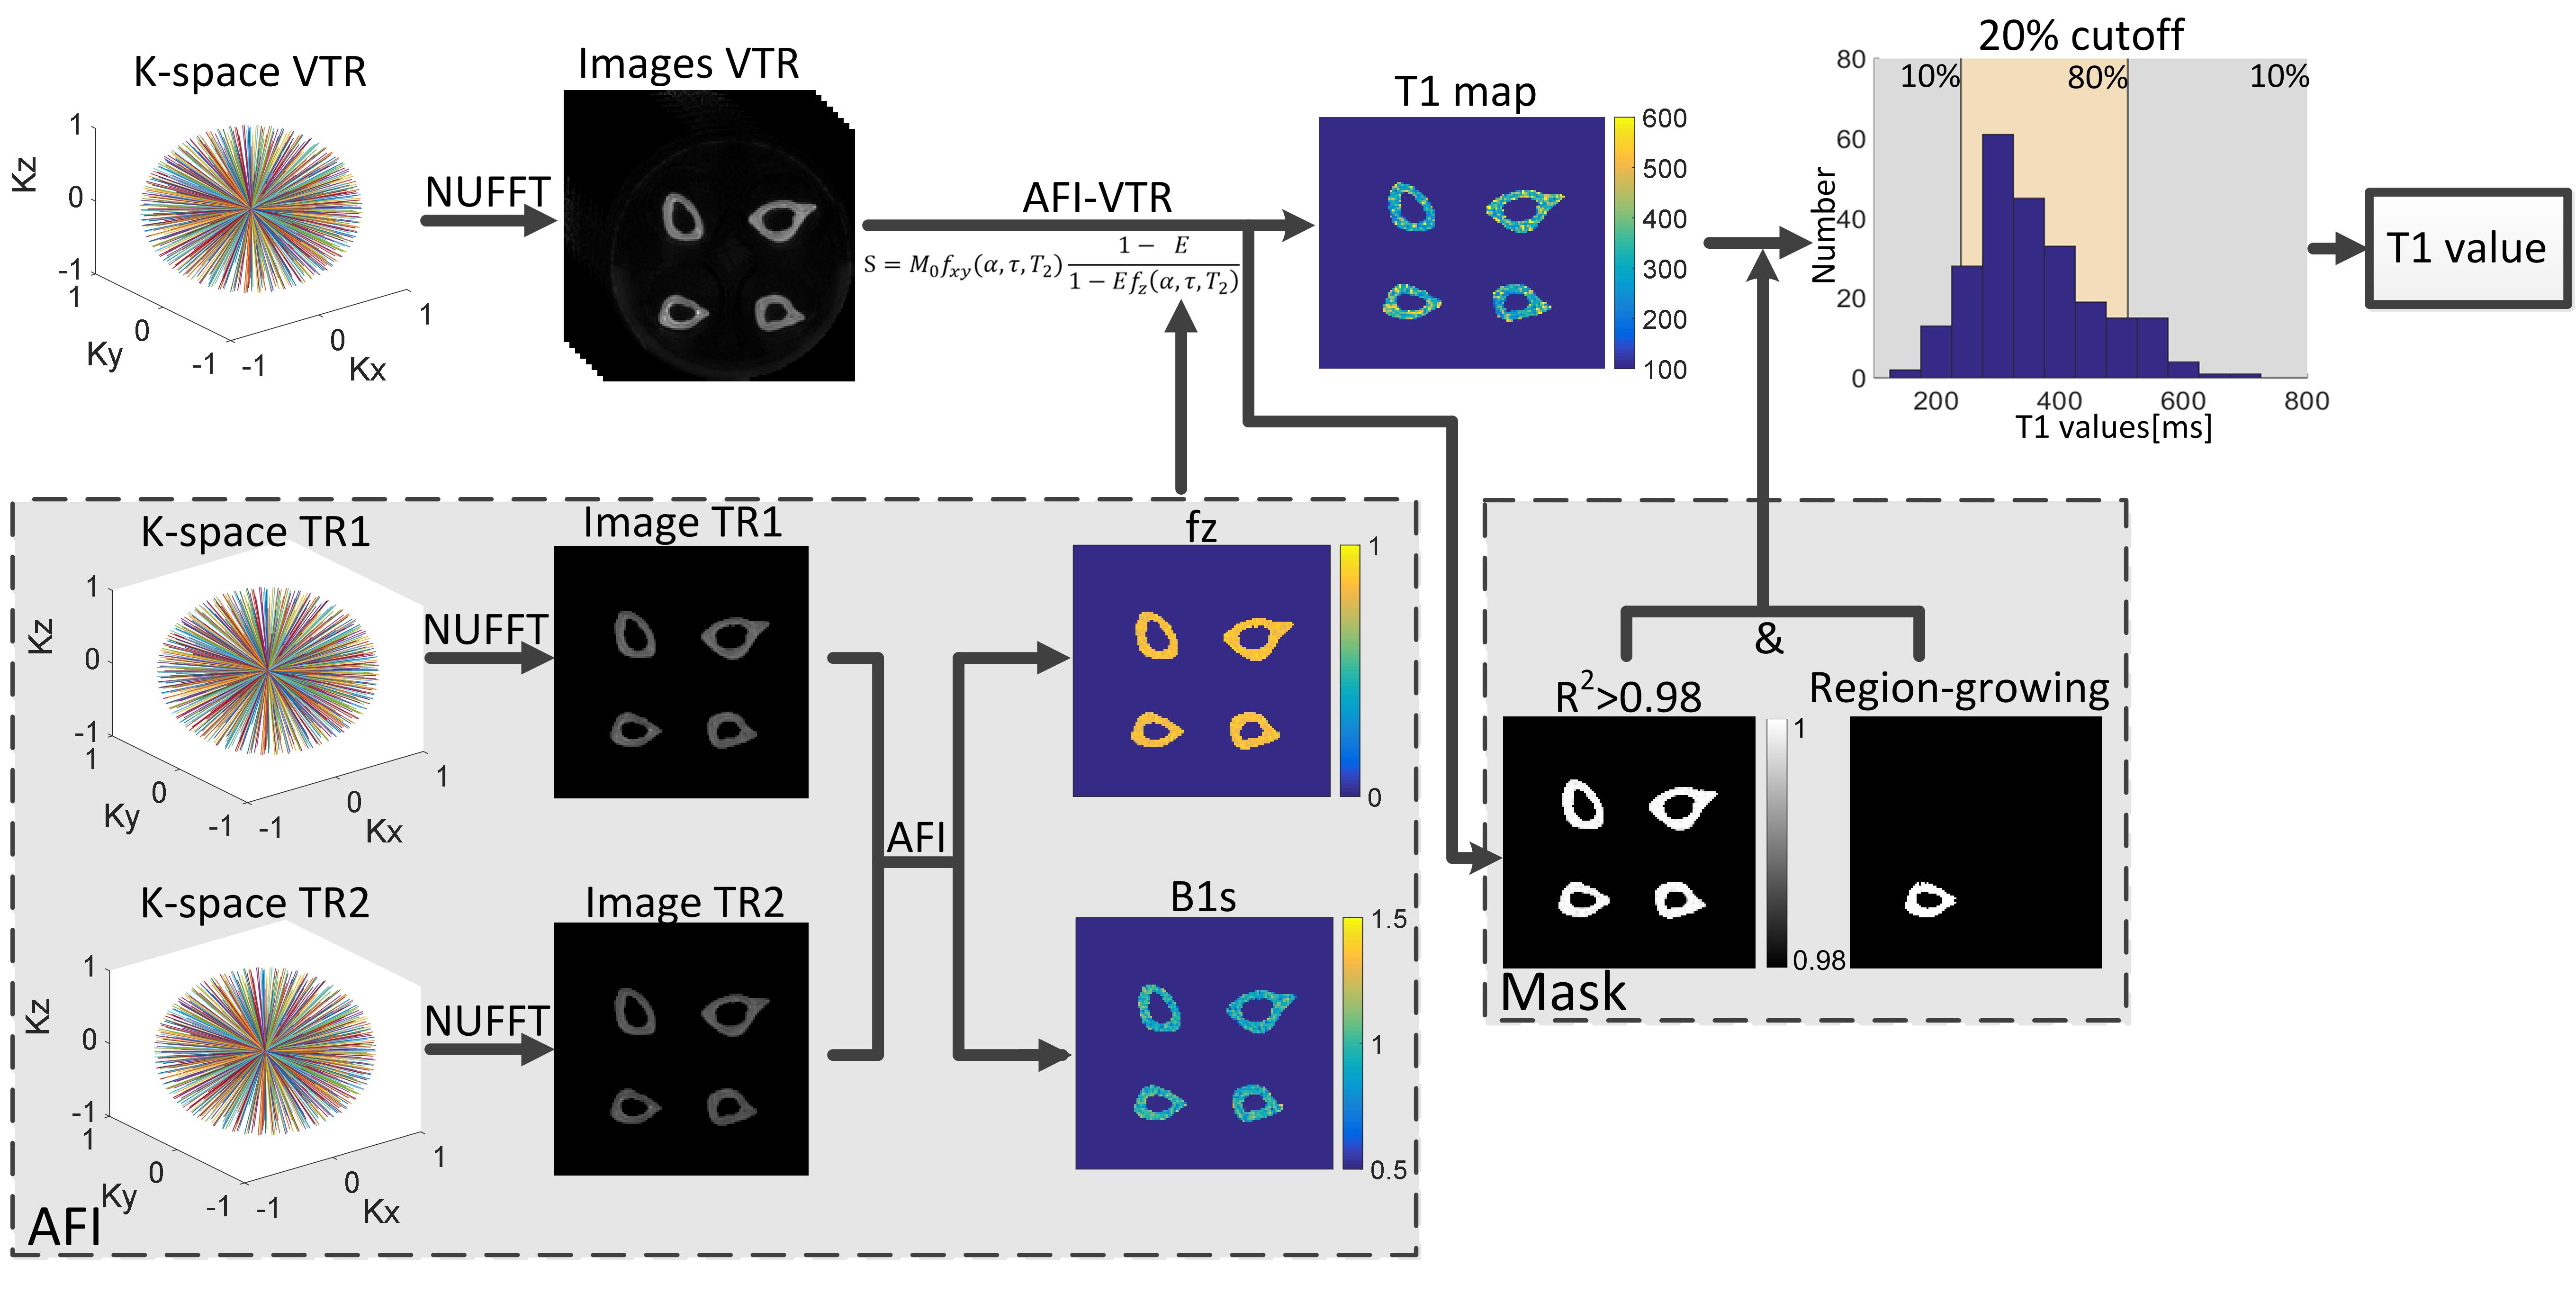
Data analysis: Flow chart of MR images analysis is shown in Figure 2. 3D VTR-UTE images and 3D AFI-UTE images were reconstructed from acquired k-space data by non-uniform fast Fourier transform(5). Bone T1 maps were generated according to articles by Ma et.al(6).
First, longitudinal magnetization mapping function $$$f_{z\left ( \alpha ,\tau ,T_{2} \right )}$$$ was estimated in 3D AFI-UTE according to:
$$f_{z\left ( \alpha ,\tau ,T_{2} \right )}\approx \frac{rn-1}{n-r}$$
Where $$$r$$$ is ratio of steady state signal acquired in $$$TR_{2}$$$ and $$$TR_{1}$$$, $$$n$$$ is the ratio of $$$TR_{2}$$$ and $$$TR_{1}$$$.
Second, because of same RF pulse was implemented in both VTR-UTE and AFI-UTE, estimated longitudinal magnetization mapping function therefore can be substituted to signal expressions of VTR-UTE, which is same as signals of steady-state spoiled gradient echo(SPGR) sequence:
$$S=M_{0}f_{xy}\left ( \alpha ,\tau ,T_{2} \right )\frac{1-E}{1-Ef_{z}\left ( \alpha ,\tau ,T_{2} \right )}$$
Where $$$E=e^{-\frac{TR}{T_{1}}}, f_{xy}\left ( \alpha ,\tau ,T_{2} \right )$$$ denotes the transverse magnetization mapping function. Combining TR-independent parameters $$$M_{0}$$$ and $$$f_{xy}\left ( \alpha ,\tau ,T_{2} \right )$$$ into single unknown parameters, T1 can be determined through non-linear least square (Levenberg-Marquardt(7,8)) optimization by in-house developed scripts in Matlab(Matlab 2014, MathWorks, Natick, MA). Fitting quality was indicated by the coefficient of determination $$$R^{2}$$$.
Regions of interest(ROIs) was first delineated by region-growing algorithm to semi-automatic generate mask over interested bone, and pixels with fitting quality $$$R^{2}<0.98$$$ was neglected. Histogram of T1 values was generated according to generated mask, and mean of center 80% T1 in the histogram was considered as T1 values for the interested bone at current slice. Same operations was repeated for other center slices and total 30 slices were analyzed. Mean T1 value over these 30 slices was considered as the T1 value for the interested bone.
Result
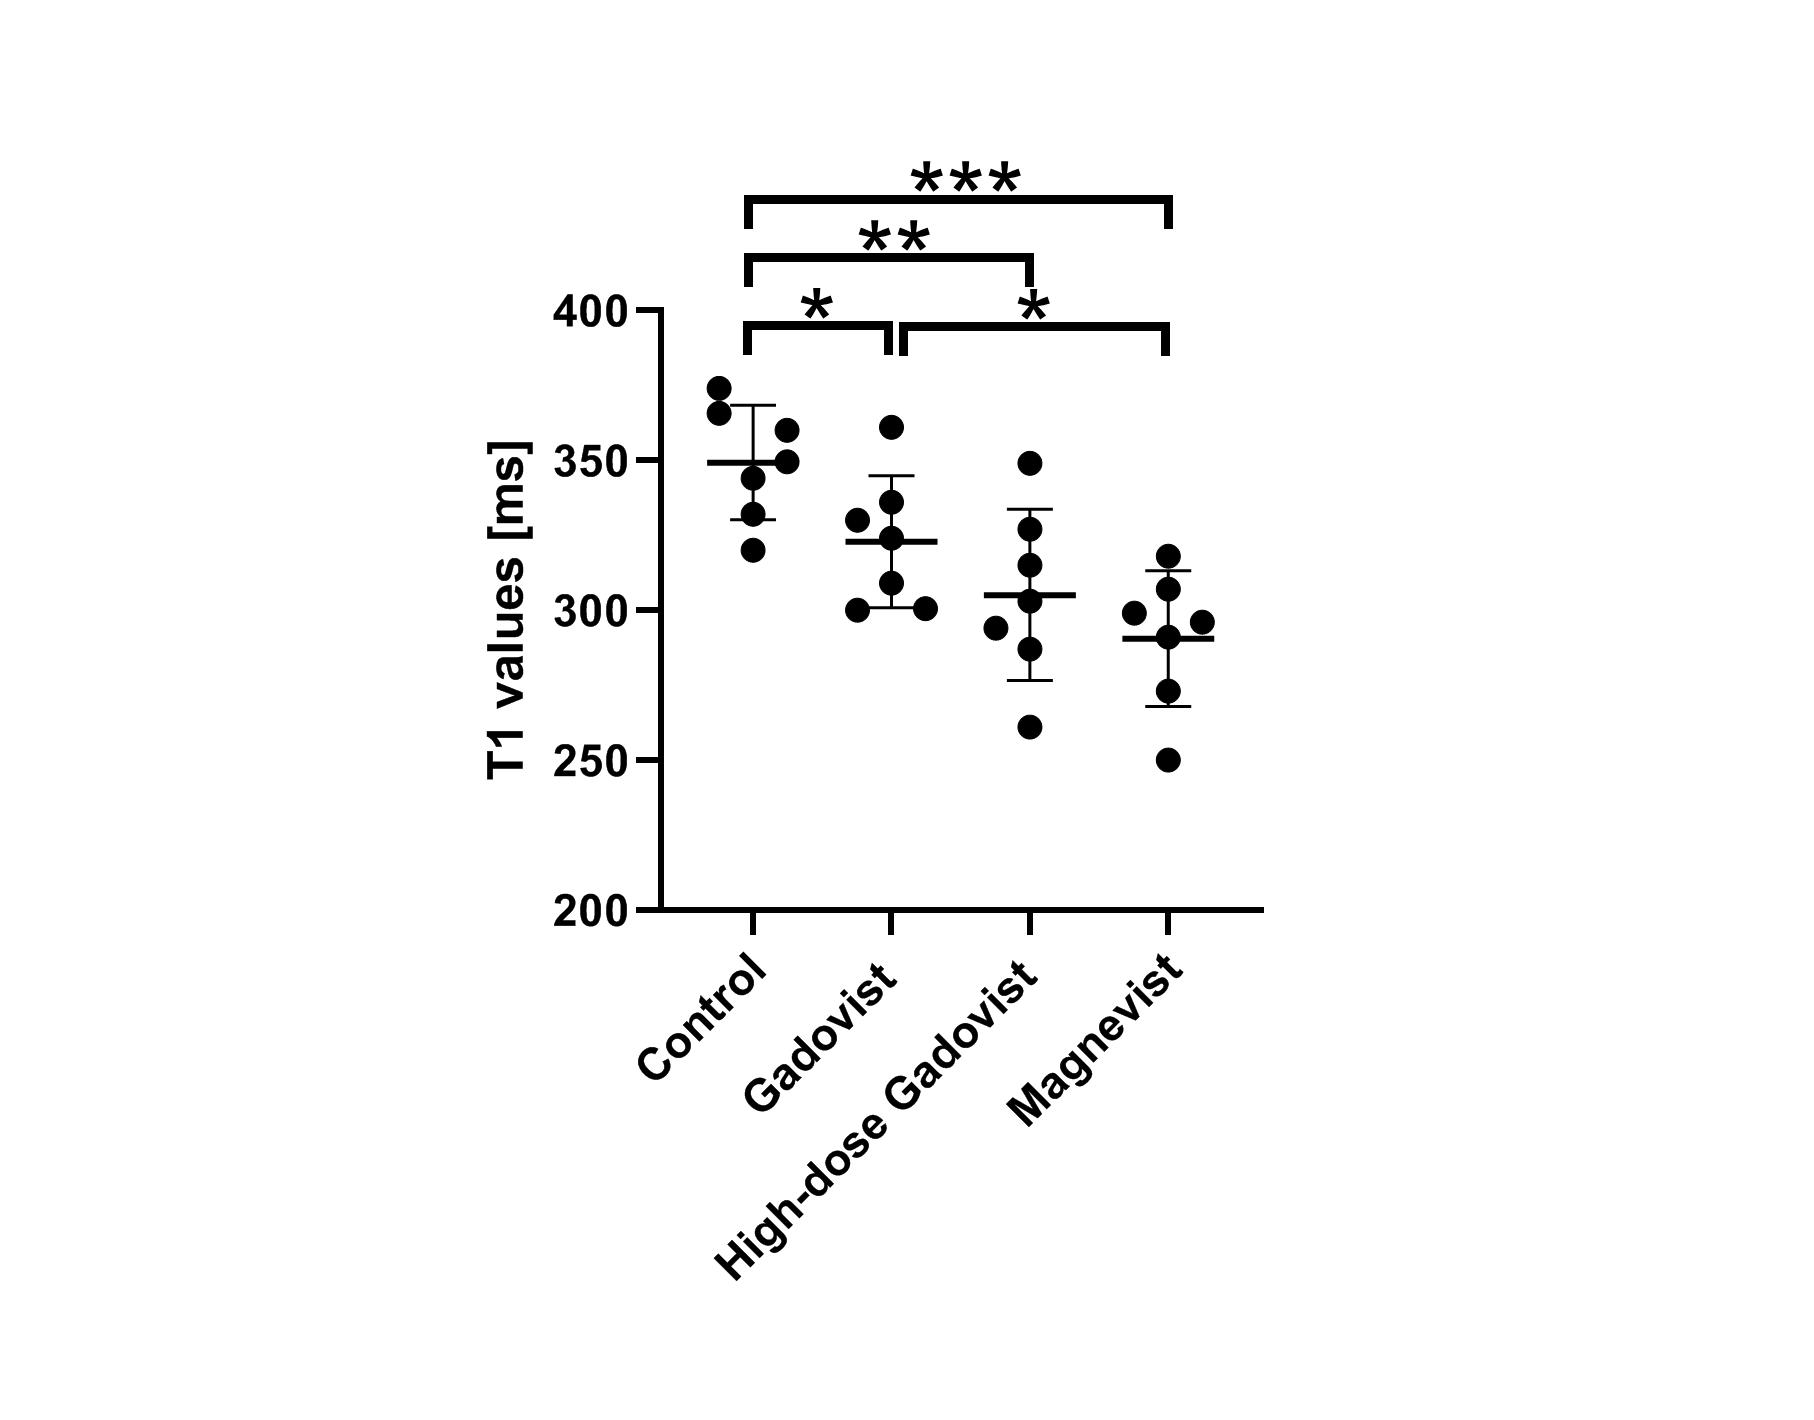
Figure 3 shows representative images at different TR, and quantified T1 map and R2 map. Figure 4 plots bone T1 values of all specimens. Significant lower bone T1 value was observed in macrocyclic group(323±22,P<0.05), high-dose macrocyclic group(305±28ms,P<0.01) and linear GBCAs group(290±22ms,P<0.001) than that in control group(349±19ms). In addition, T1 values in linear GBCAs group was observed significant higher than that in macrocyclic group(P<0.05).Discussion & Conclusion
Preliminary results demonstrated bone T1 values in GBCAs exposure group is significant lower than that in control group, suggested T1 values might be a potential biomarker for evaluating Gadolinium deposition. Further research is required to investigate the correlation between quantitative Gd assessment by inductively coupled plasma mass spectrometry and T1 values.Acknowledgements
No
References
1. Murata N, Gonzalez-Cuyar LF, Murata K, Fligner C, Dills R, Hippe D, Maravilla KR. Macrocyclic and Other Non-Group 1 Gadolinium Contrast Agents Deposit Low Levels of Gadolinium in Brain and Bone Tissue: Preliminary Results From 9 Patients With Normal Renal Function. Investigative radiology 2016;51(7):447-453.
2. Runge VM. Critical Questions Regarding Gadolinium Deposition in the Brain and Body After Injections of the Gadolinium-Based Contrast Agents, Safety, and Clinical Recommendations in Consideration of the EMA's Pharmacovigilance and Risk Assessment Committee Recommendation for Suspension of the Marketing Authorizations for 4 Linear Agents. Investigative radiology 2017;52(6):317-323.
3. Murata N, Murata K, Gonzalez-Cuyar LF, Maravilla KR. Gadolinium tissue deposition in brain and bone. Magnetic resonance imaging 2016;34(10):1359-1365.
4. Lord ML, Chettle DR, Grafe JL, Noseworthy MD, McNeill FE. Observed Deposition of Gadolinium in Bone Using a New Noninvasive in Vivo Biomedical Device: Results of a Small Pilot Feasibility Study. Radiology 2018;287(1):96-103.
5. Fessler JA. On NUFFT-based gridding for non-Cartesian MRI. Journal of magnetic resonance 2007;188(2):191-195.
6. Ma YJ, Lu X, Carl M, Zhu Y, Szeverenyi NM, Bydder GM, Chang EY, Du J. Accurate T1 mapping of short T2 tissues using a three-dimensional ultrashort echo time cones actual flip angle imaging-variable repetition time (3D UTE-Cones AFI-VTR) method. Magnetic resonance in medicine 2018;80(2):598-608.
7. Levenberg K. A method for the solution of certain non-linear problems in least squares. Quarterly of applied mathematics 1944;2(2):164-168.
8. Marquardt DW. An algorithm for least-squares estimation of nonlinear parameters. Journal of the society for Industrial and Applied Mathematics 1963;11(2):431-441.
Figures