2837
Assessment of skeletal muscle pathology in Dystrophin-deficient mice using structural and functional Diffusion MRI1Department of Radiology, Faculty of Health Sciences, Tokyo Metropolitan University, Tokyo, Japan, 2Live Imaging Center, Central Institute for Experimental Animals, Kanagawa, Japan, 3Jikei University School of Medicine, Tokyo, Japan, 4Keio University School of Medicine, Tokyo, Japan
Synopsis
To analyze the disease of muscular dystrophy noninvasively, we assessed the degeneration of skeletal muscle and the distinction depending on types of muscle fibers, with changing parameters based on the sequence of diffusion weighted imaging. The mdx mice were used for longitudinal evaluation at the age from 5 to 10 weeks. We confirmed conventional diffusion tensor imaging could evaluate the pathological structure. Moreover, by applying the advanced imaging such as time-dependent diffusion MRI, we could demonstrate the functional characteristics of skeletal muscle cell and to detect micro-level condition of degeneration in mdx-mice.
Introduction
The muscular dystrophy is a genetic muscle disease and causes muscle wasting and weakness by the degeneration of muscle fiber. Some studies with magnetic resonance imaging have found that : using a contrast agent could examine hallmark pathological features of the disease1, and individual muscles had different distribution of signal intensity.2 However, histological characteristics of skeletal muscle due to dystrophin deficiency have not been detected by MRI yet. In recent years, new techniques have been developed to visualize macroscopic cell structures using q space imaging (qsi)3,4, and the water molecule permeability of cell membranes using time-dependent diffusion MRI (td-dMRI)5. Thus, in this study, by applying diffusion tensor imaging (DTI), qsi and td-dMRI,we evaluated how the skeletal muscle of mdx mice was affected at the micro-level in terms of cell structure and cell membrane function.Methods
For the data acquisition, 7.0-Tesla magnetic resonance scanner (Biospec 70/16 MRI; Bruker BioSpin, Ettlingen, Germany) and a cryogenic 2ch probe (Bruker BioSpin AG, Fallanden, Switzerland) were used. Four mdx-mice and four control-mice were longitudinally observed (C57BL/10, age; 5-11 weeks). The target area was the largest diameter of the right lower leg. The imaging parameters were as follows: one is; sequence, diffusion tensor imaging with echo planar imaging (DtiEpi); repetition time, 2000 ms; echo time, 15.8 ms; field of view, 20 × 12 mm2; pixel resolution, 300 ×300 μm2; slice thickness, 1.2 mm; b-values, 0, 48, 192, 432, 768, 1201, 1729, 3891 s/mm2; diffusion time, 50,100, 200, 300, 400, 500, 600, 700, 800, 900, 1000 (echo time, 14.8 ms b-values, 1000,2000 s/mm2) for diffusion weighted imaging (DWI). The other is; sequence, rapid acquisition with relaxation enhancement (RARE); repetition time, 2500 ms; echo time, 40.6 ms; field of view, 20 × 12 mm2; pixel resolution, 80 × 80 μm2; slice thickness, 1.2 mm for T2 weighted imaging (T2WI). The DWI were reconstructed by using Diffusion Toolkit (Ruopeng Wang et al. 2007). Five regions of interests (ROIs) were drawn at lateral Tibialis Anterior Muscle (lTA), medial Tibialis Anterior Muscle (mTA), Soleus (SOL), lateral Gastrocnemius (lGA), and medial Gastrocnemius (mGA) for comparing by types of skeletal muscles. Subsequently, apparent diffusion coefficient (ADC; λ1, λ2, λ3) and fractional anisotropy (FA) were measured by ImageJ (Wayne Rasband, NIH). This study was approved by the local Animal Experiment Committee and conducted in accordance with the Guidelines for Conducting Animal Experiments of the CIEA.Results
According to Figure 2, T2WI showed the high intensity at any timepoint in the mdx-mice while control-mice did not. In particular, the difference was significant during the period of 5 to 6 weeks. Furthermore, the difference between control and mdx-mice at the distribution of ADC and FA was also apparent. In particular, there was same tendency of degeneration at TA and sol from 5 to 7 weeks, but TA regenerates while sol remain degenerated from 8 to 11 weeks. These are confirmed by Figure 1. As the diffusion time was changed, the value of ADC in control-mice was more than that in mdx-mice (Figure 3). In addition, functional characteristics were well reflected at short diffusion time such as 50 and 100 ms (Figure 4).Discussion
This study was performed to detect the process of degeneration with skeletal muscle growth of mdx-mice using DTI, qsi, and td-DWI, which are able to analyze from the data of DWI. It has been proposed that the transverse relaxation time constant (T2) in mdx-mice is higher than that in control-mice at any week of age, and the change is caused by accumulation of fatty tissue, edematous tissue, and fibrotic tissue.6 We could confirm the signal intensity in some muscle regions of mdx-mice (Figure 2), therefore it is assumed that the mdx-mice used in this study is equivalent to other models of muscular dystrophy. DTI metrics (FA, AD, and RD) can evaluate quantifiable difference between mdx-mice and control-mice.7,8 The DTI result indicates the muscle got edematous and fibrotic in mdx-mice, which suggested development delay would occur. Therefore the difference would increase chronologically and reach maximum at the period of 10-11 weeks or more. (Figure 1) Td-DWI can reflect permeable barrier of water molecule, especially at long diffusion time.9 Regarding the permeability, there is less Aquaporin-4 (AQP4) expression in SOL (slow muscle fiber), whereas there is more AQP4 expression in TA (fast muscle fiber).5 In the present study, there was almost no difference between mdx-mice and control-mice in sol, however the difference appeared in TA (Figure 3). It would be due to decline of the number of water-exchange proteins such as AQP4 by the result of td-DWI, which was consistent with the previous research.10 This study indicated DWI using multiple parameters enables to evaluate the structure and function of skeletal muscle cell and to detect micro-level condition of degeneration in mdx-mice.Conclusion
This research was successfully conducted to analyze the characteristics of skeletal muscle quantitatively in mdx-mice by DTI, qsi, and td-DWI. It was clarified that new DWI analysis method is effective to evaluate the structure and function at the skeletal muscle in mdx-mice.Acknowledgements
We thank Dr. Masahiko Yasuda, Dr. Takuma Mizusawa and Dr. Riichi Takahashi (Central Institute for Experimental Animals) for preparation and supply of disease model animals.References
1. Volker Straub. Et al. Contrast agent‐enhanced magnetic resonance imaging of skeletal muscle damage in animal models of muscular dystrophy. Magnetic Resonance in Medicine, vol 44, issue 4, pp655-659, 2000
2. Antti E. Lamminen. Magnetic resonance imaging of primary skeletal muscle diseases: patterns of distribution and severity of involvement. The British Journal of Radiology 63(756), pp946-950, 1990
3. Martin D. King Ph. D. Et al. Localized q-space imaging of the mouse brain. Magnetic Resonance in Medicine 38(6), pp930-937, 2006
4. Henry H. Ong. Et al. Indirect measurement of regional axon diameter in excised mouse spinal cord with q-space imaging: Simulation and experimental studies. NeuroImage 40(4), pp1619-1632, 2008
5. Junichi Hata. Et al. Noninvasive technique to evaluate the muscle fiber characteristics using q-space imaging. PLoS ONE 14(4), e0214805, 2019
6. Ravneet S. Vohra, PhD. Et al. Age-Related T2 Changes in Hindlimb Muscles of mdx Mice. Muscle Nerve 53, pp84-90, 2016
7. Joshua S. Park. Et al. Non-invasive tracking of disease progression in young dystrophic muscles using multiparametric MRI at 14T. PLoS ONE 13(10), e0206323, 2018
8. Junichi Hata. Et al. Semiquantitative Evaluation of Muscle Repair by Diffusion Tensor Imaging in Mice JBMR Plus 2(4), pp227-234, 2018
9. Kerryanne V. Winters. Et al. Quantifying myofiber integrity using diffusion MRI and random permeable barrier modeling in skeletal muscle growth and Duchenne muscular dystrophy model in mice. Magnetic Resonance in Medicine 80, pp2094-2108, 2018
10. Antonio Frigeri. Et al. Aquaporin-4 deficiency in skeletal muscle and brain of dystrophic mdx mice. The FASEB Journal Vol. 15, 2001
Figures
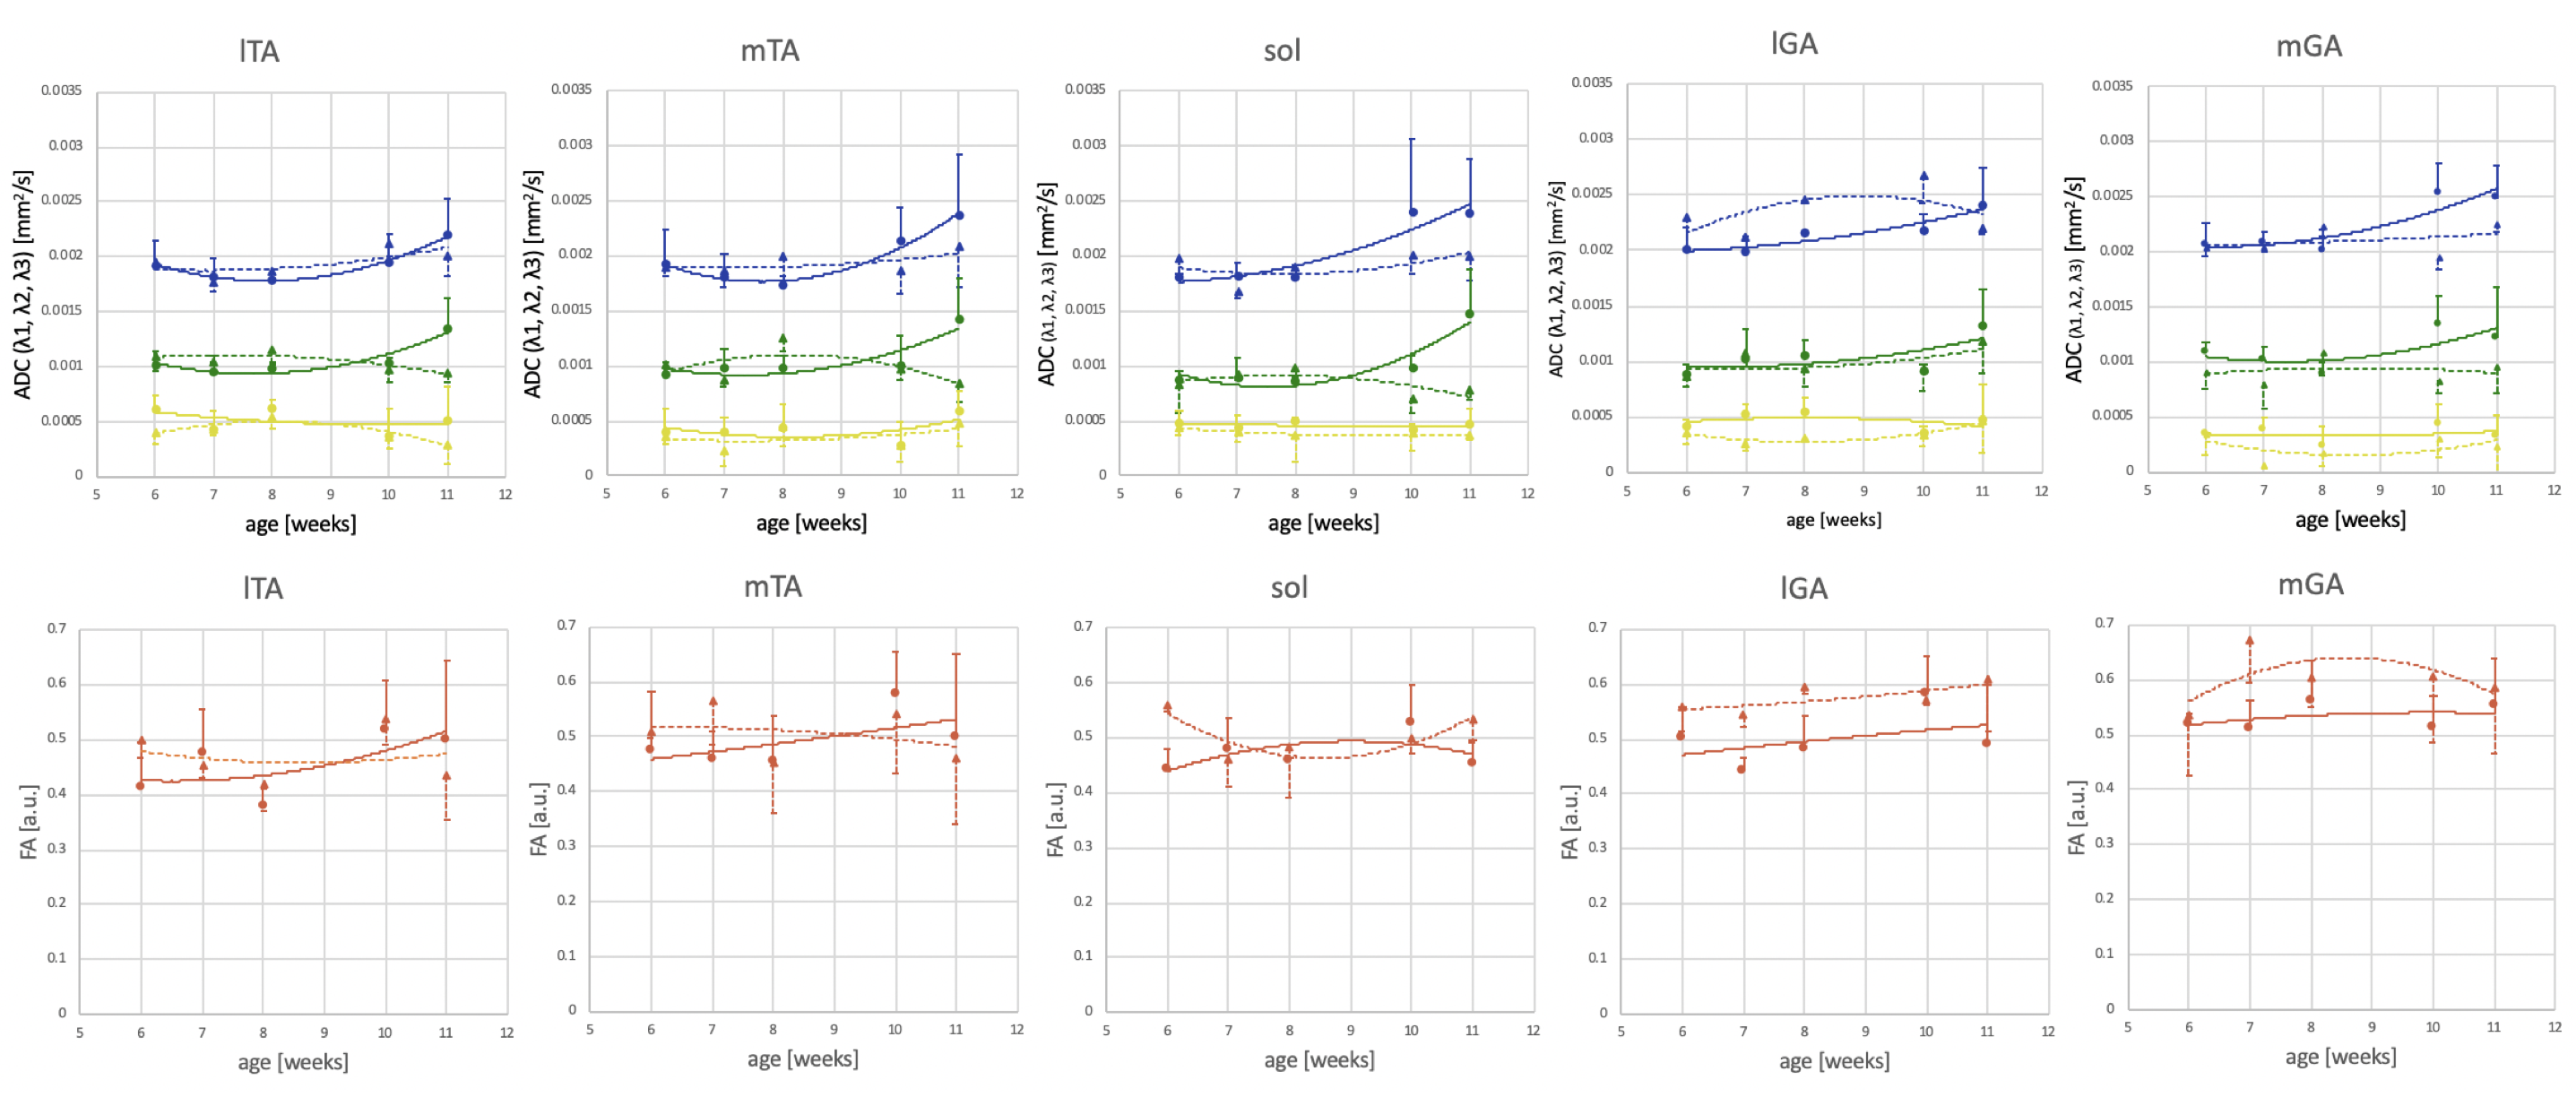
Figure 1. Measured value by weeks of age
The changing value of ADC and FA with the development of skeletal muscle depending on the five areas of muscle fibers is shown. The power approximation is drawn on each plots. The solid line is control-mice, and the dotted line is mdx-mice. (blue: λ1, green: λ2, yellow: λ3, orange: FA)
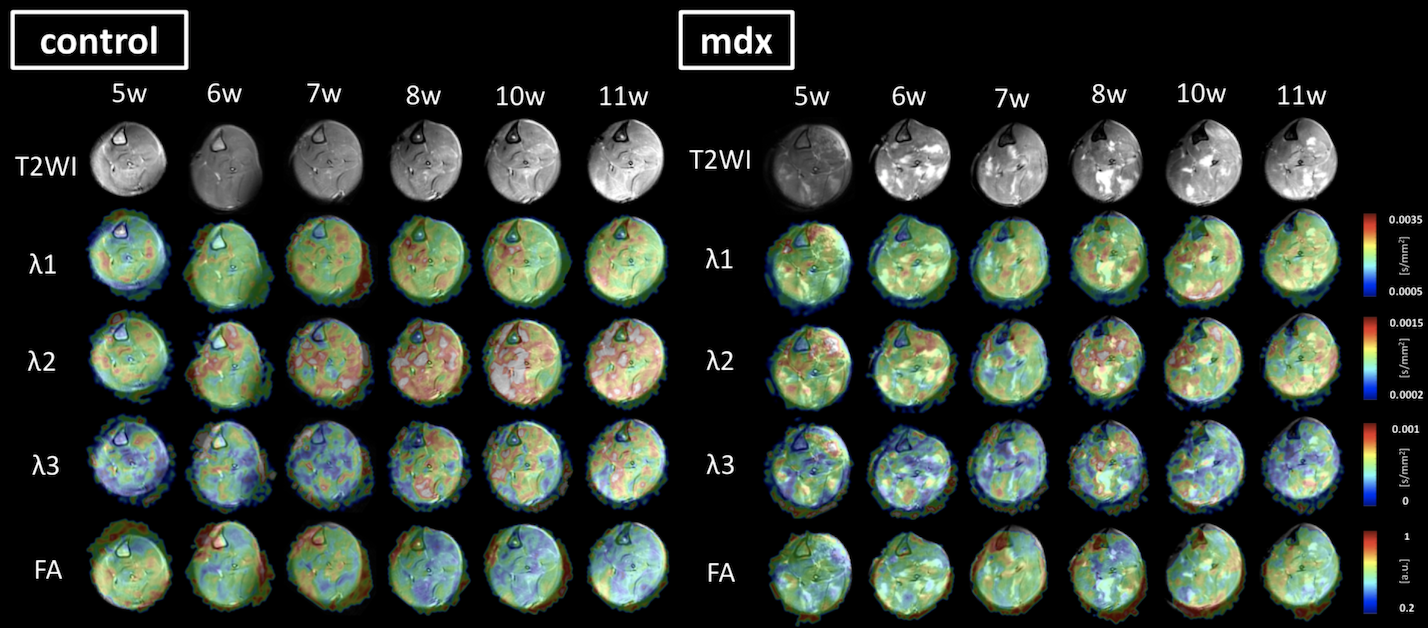
Figure 2. Images of distribution by weeks of age
The images of control-mice and mdx-mice are compared at 5-11 weeks of age. The upper image shows T2WI, and the rest images are reflected the distribution of ADC and FA. It is graphic overlay with T2WI. The scale bar is put on right side.
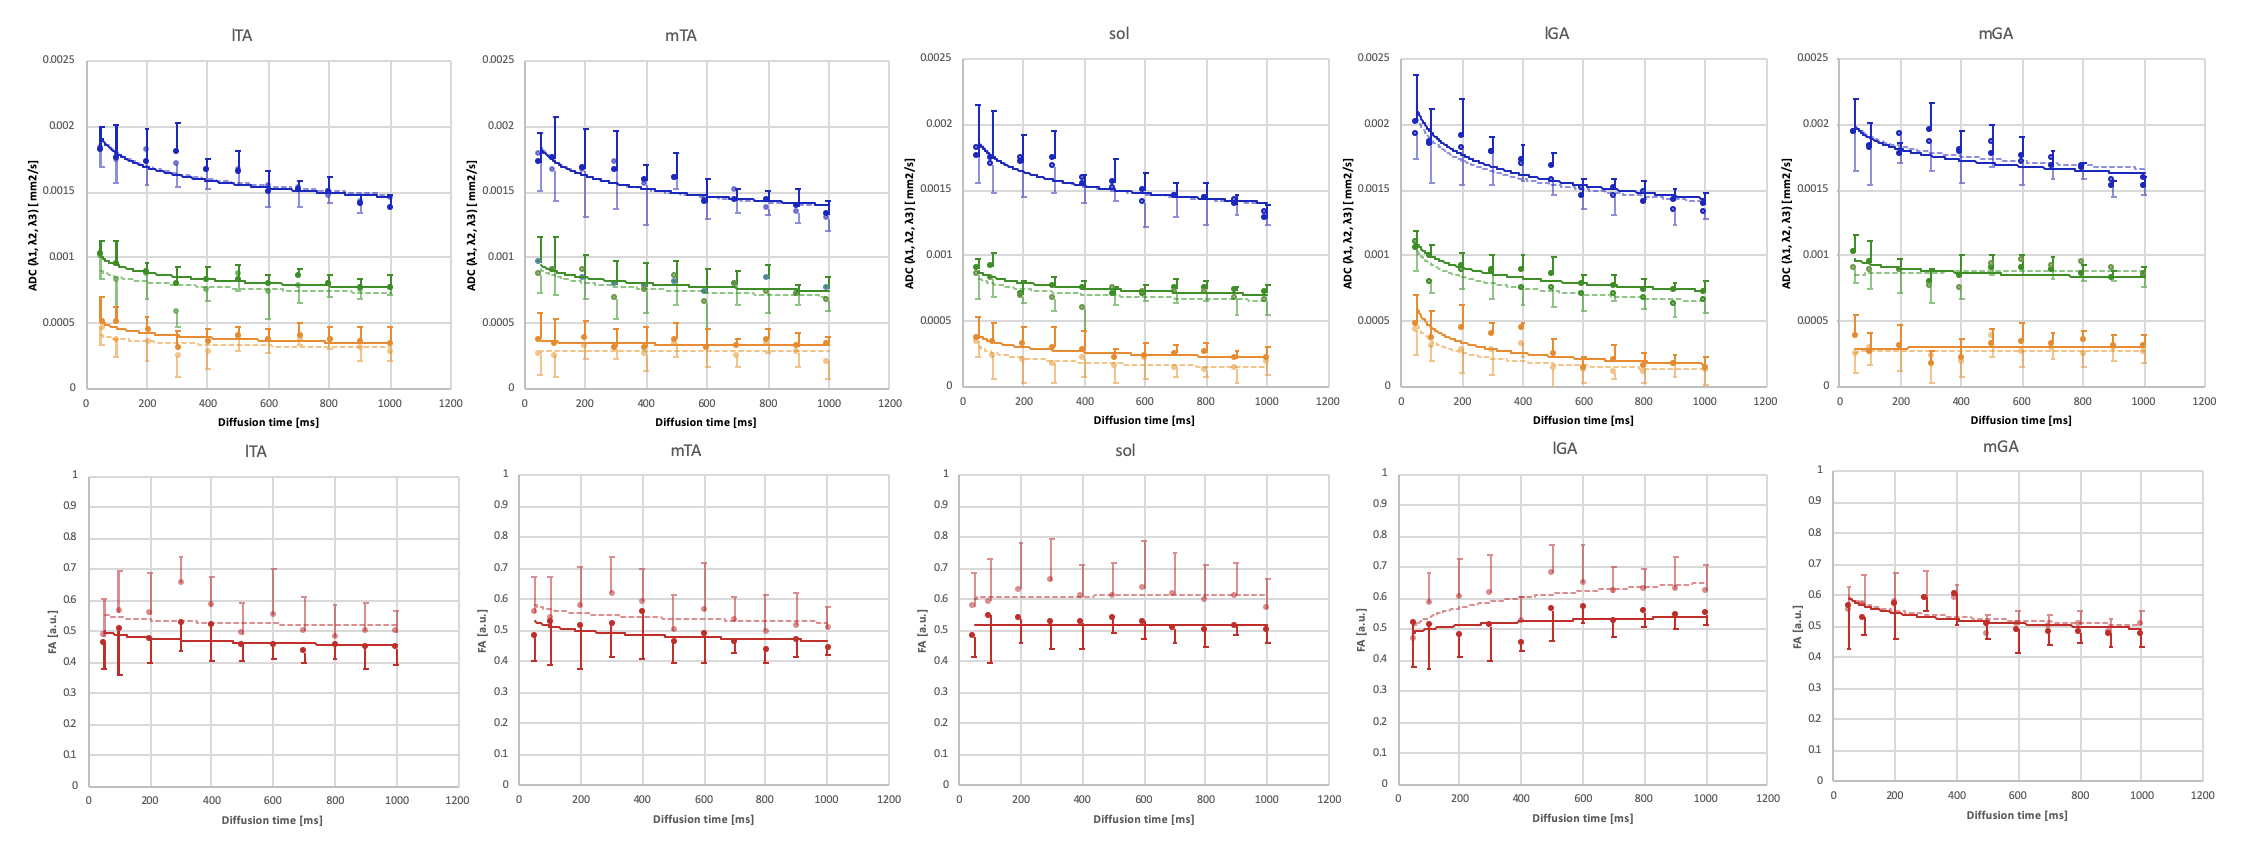
Figure 3. Measured value by diffusion time
The value of ADC and FA on time-dependent for each five areas of muscle fibers is shown. The power approximation is drawn on each plots. The solid line is control-mice, and the dotted line is mdx-mice. (blue: λ1, green: λ2, orange: λ3, red: FA)
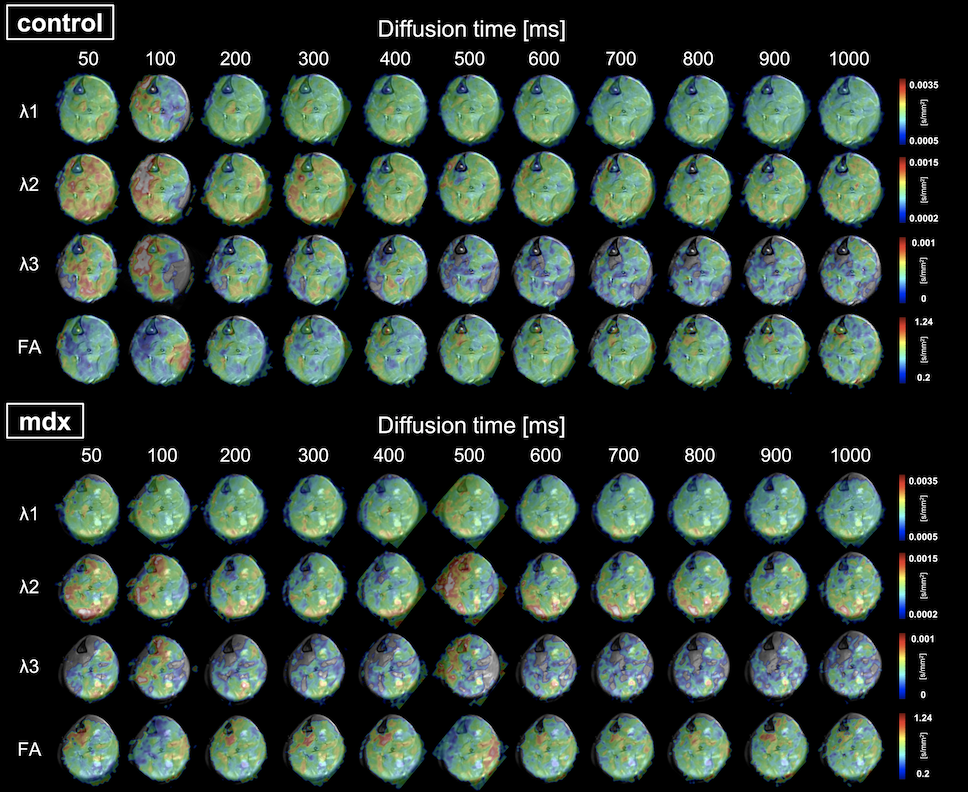
Figure 4. Images of distribution by diffusion time
The images of control-mice and mdx-mice are compared for each diffusion time (50-1000 ms). The distribution of ADC and FA were overlaid T2WI. The scale bar is put on right side.