2836
Investigating relationship between creatine kinase kinetics and total NAD levels in human skeletal muscle in vivo using 31P MRS at 7.0T1Radiology, University of Pennsylvania, philadelphia, PA, United States
Synopsis
Nicotinamide adenine dinucleotide (NAD) plays an important role in cellular metabolism and it is important to study its correlation with other metabolites of the skeletal muscle. Phosphocreatine (PCr) present in abundant amount in the skeletal muscle facilitates the generation of ATP by conversion into creatine. 31P-MRS is a common technique used to study PCr recovery kinetics and its application has been shown in various diseases related to mitochondrial disorders. In this study, we aim to investigate the relationship between PCr recovery kinetics, total NAD concentration, and age.
INTRODUCTION
The cellular phosphocreatine (PCr) level present in different tissues such as skeletal muscle, heart, and brain etc., serves as a rapidly mobilizable energy reservoir 1. Since the skeletal muscle of lower leg contains the highest amount of PCr 1, it is feasible to study the PCr recovery kinetics in this muscle region. The creatine kinase (CK) kinetics mechanism involves conversion of PCr into creatine (Cr) with the release of ATP during plantar flexion exercise (PFE) 2-4. After exercise, mitochondrial ATP is used to recover the amount of PCr in a favored reversible way 2. This PCr recovery varies in diseased populations such as primary mitochondrial disorders due to abnormality in CK function 3,4. Quantification of PCr recovery kinetics is currently only possible through the use of 31P-MRS, a common technique used to study the muscle synergetic 3-7. However, the correlation between aging and PCr recovery is yet unknown. Nicotinamide adenine dinucleotide (NAD), present in all living cells, acts as a coenzyme in redox reactions and its concentration influences the rate of mitochondrial energy production 8,9. Total NAD was found to be declined with aging in the human brain 10,11. However, the correlation between skeletal muscle total NAD concentration prior to PFE and PCr recovery kinetics following PFE is yet unknown. The objective of this study is to evaluate the medial gastrocnemius (MG) muscle group of lower leg to understand the correlation of PCr recovery kinetics with total NAD concentration and age in healthy human volunteers at 7.0T using 31P-MRS.Methods
This study was carried out at 7.0T (MAGNETOM Terra, Siemens Healthcare, Erlangen, Germany) using a 7-cm diameter dual tuned (31P-1H) surface coil. 5 healthy volunteers aged (24- 40 years old; 1 female, 4 males) were scanned in multiple sessions on different days to collect data in the central part of the lower leg. The surface coil was positioned in such a way that we could perform acquisition focused on the MG muscle group of the calf muscle. A small vial containing 3-Aminopropylphosphonic acid (3-APP) solution was placed in the middle of the coil as a reference sample. 31P-MRS was performed using pulse acquire sequence with the following parameters for baseline scan: spectral width = 8 kHz, number of points = 1024, averages = 128, and TR = 5s, TE = 0.23s. This baseline scan was intended to use for quantifying total NAD concentration. This experiment involved 10.5 minutes of baseline pre scan, followed by 2 minutes of PFE and then 8 minutes of post exercise scan. The parameters for the post exercise scan were same as like pre scan, except number of points = 1, measurements/repetitions = 96. The MRI-Compatible and pneumatically controlled foot pedal against resistance of 7.5 PSI was used for PFE inside the MRI scanner. Patients were instructed to use the right foot to fully press the pedal and bring it back to normal position with each beep of metronome which was played for 2 minutes at a rate of 45 repetitions per minute, making a total of 90 repetitions for PFE 2-4. All data processing was performed using in-house Matlab (version R2019a) scripts. In the post-exercise data, we were interested only in PCr peak at 0 ppm. 31P-MRS spectra were phase and baseline corrected and fitted using nonlinear least squares method with Lorentzian functions.Results
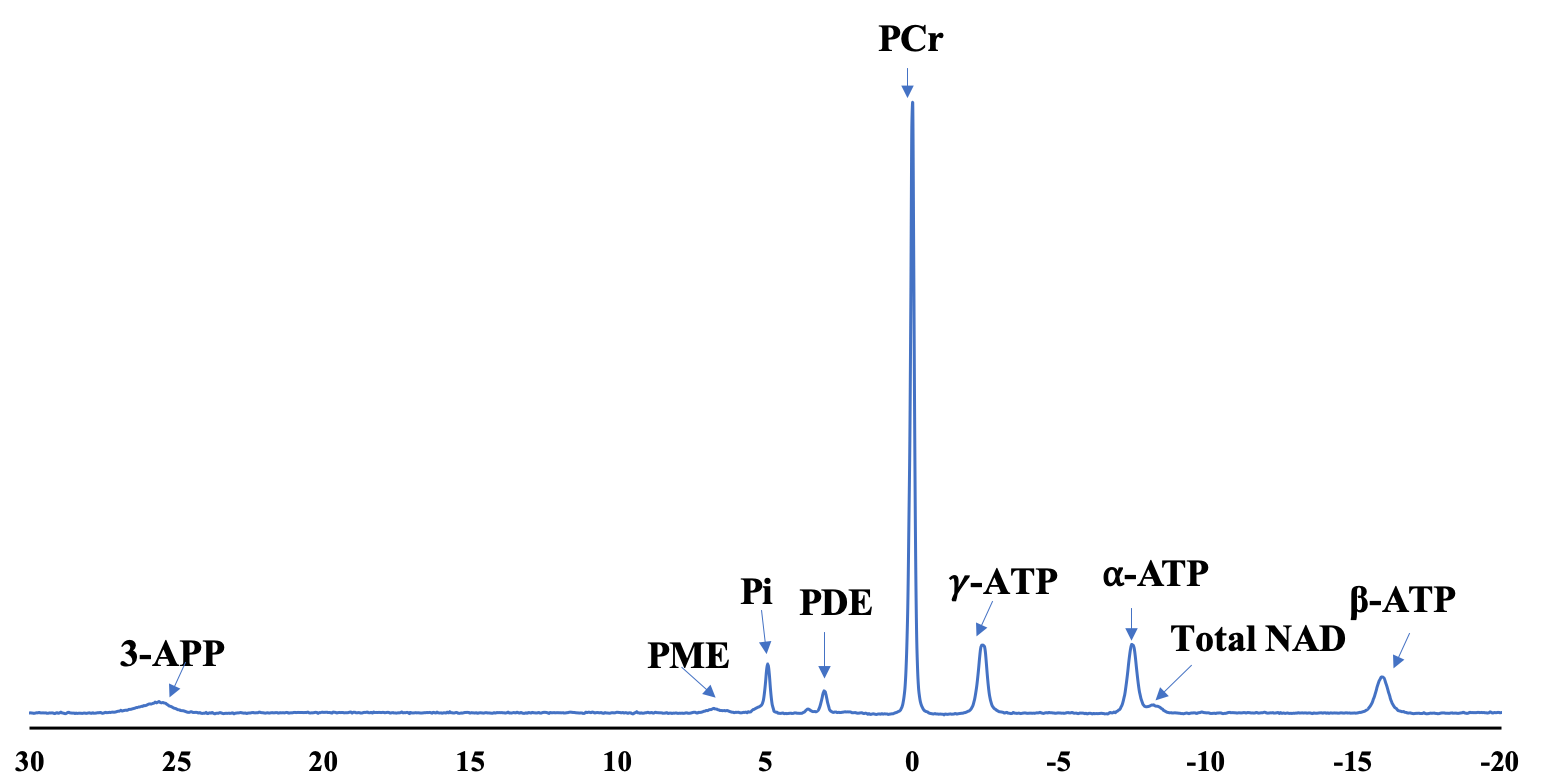
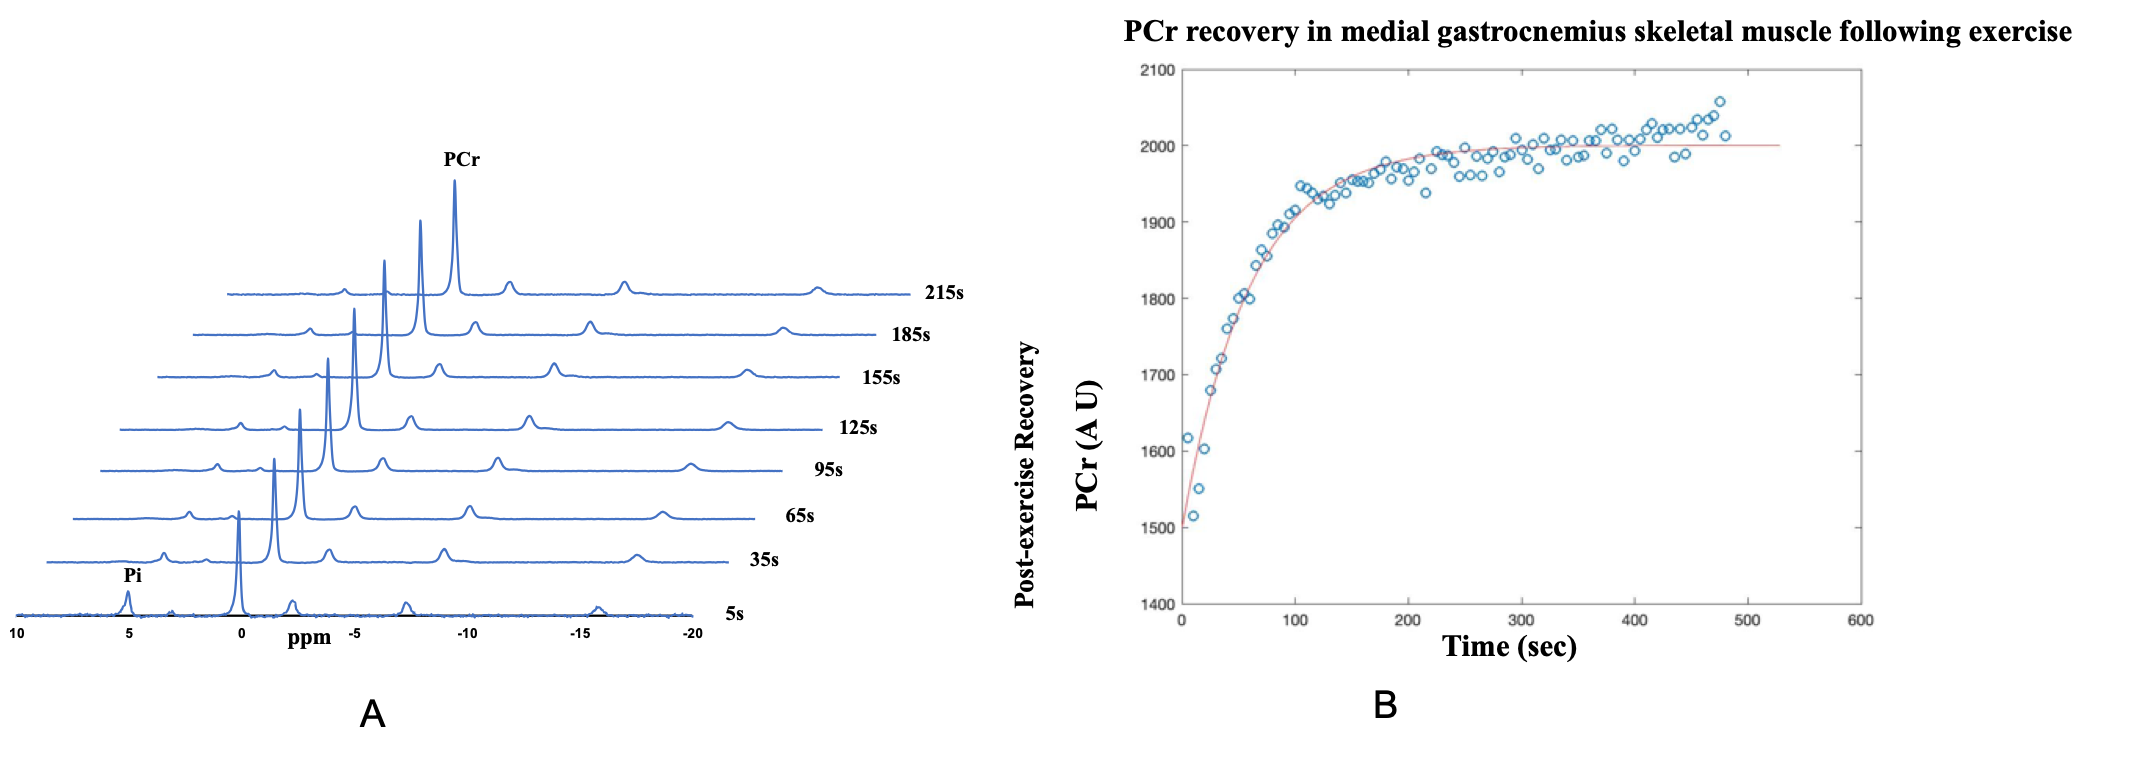
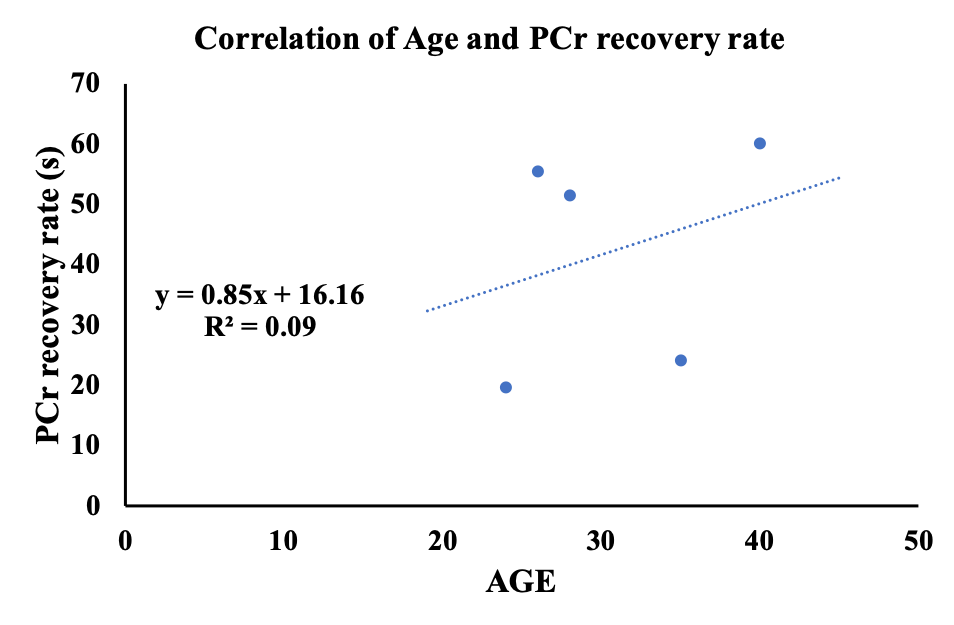
Fig 1 showed labeled spectra of various metabolites in the MG muscle of a 24 years old subject before PFE, and total NAD concentration was quantified using the pre scan data. The post exercise PCr recovery curves stacked in Fig 2A showed that PCr to be recovering until 215 secs time points and this was further reflected in Fig 2B. There was a concomitant decrease in inorganic phosphate (Pi) as shown in Fig 2A. It was found that with the increase in concentration of total NAD, PCr recovery rate decreased suggesting that PCr recovery is faster in younger subjects (Fig 3). Moreover, PCr recovery rate was found to be higher in older subjects (Fig 4) suggesting that PCr recovery rate is slower in aging populations.Discussion
31P-MRS spectrum in Fig 1 shows spectra of various metabolites in the MG muscle of a 24 years old healthy subject prior to PFE and all these metabolites were fitted including NAD at -8.6 ppm. The post exercise PCr recovery rate stacked in Fig 2 suggests that PCr peak decreased right after exercise (5s time point) and slowly recovered (slope in the curve) back to normal (215 s). As expected, the Pi peak (5s time point) was elevated immediately following exercise, and it also returned back to normal around 215 secs time frame. As the PCr recovery process was found to be slow in older subjects with lesser amount of total NAD compared to younger subjects, future work should include both intramuscular and intermuscular variability in gastrocnemius muscles (lateral and medial). While these preliminary results help in understanding the correlation of PCr recovery kinetics with total NAD concentration and age, additional data from more volunteers is required.Acknowledgements
This project was supported by the National Institute of Biomedical Imaging and Bioengineering of the National Institute of Health under award number P41EB015893.References
1. Fitch CD. Significance of abnormalities of creatine metabolism. Rowland P, editor. Amsterdam: Exerpta Medica; 1977.
2. Kogan F, Haris M, Debrosse C, et al. In vivo chemical exchange saturation transfer imaging of creatine (CrCEST) in skeletal muscle at 3T. J Magn Reson Imaging. 2014;40(3):596-602.
3. DeBrosse C, Nanga RPR, Wilson N, et al. Muscle oxidative phosphorylation quantitation using creatine chemical exchange saturation transfer (CrCEST) MRI in mitochondrial disorders. JCI Insight. 2016;1(18): e88207.
4. Kogan F, Haris M, Singh A, et al. Method for high-resolution imaging of creatine in vivo using chemical exchange saturation transfer. Magn Reson Med. 2014;71(1):164-172.
5. Chance B, Bank W. Genetic disease of mitochondrial function evaluated by NMR and NIR spectroscopy of skeletal tissue. Biochim Biophys Acta. 1995;1271(1):7–14.
6. Matthews PM, Allaire C, Shoubridge EA, et al. In vivo muscle magnetic resonance spectroscopy in the clinical investigation of mitochondrial disease. Neurology. 1991;41(1):114–120.
7. Arnold DL, Taylor DJ, Radda GK. Investigation of human mitochondrial myopathies by phosphorus magnetic resonance spectroscopy. Ann Neurol. 1985;18(2):189–196.
8. Stein LR, Imai S. The dynamic regulation of NAD metabolism in mitochondria. Trends Endocrinol Metab. 2012; 23: 420– 428.
9. Pryde KR, Hirst J. Superoxide is produced by the reduced flavin in mitochondrial complex I: a single, unified mechanism that applies during both forward and reverse electron transfer. J Biol Chem. 2011; 286:18056–18065.
10. Zhu XH, Lu M, Lee BY, et al. In vivo NAD assay reveals the intracellular NAD contents and redox state in healthy human brain and their age dependences. Proc Natl Acad Sci U S A. 2015; 112:2876–2881.
11. Bagga P, Hariharan H, Wilson NE, et al. Single‐Voxel 1 H MR Spectroscopy of Cerebral Nicotinamide Adenine Dinucleotide (NAD) in Humans at 7T Using a 32‐Channel Volume Coil. Magn Reson Med. 2019; doi:10.1002/mrm.27971.
Figures