2834
Phase-cycling diffusion-sensitized driven-equilibrium (pcDSDE) for MR neurography of the crus1Diagnostic Radiology and Radiation Oncology, Graduate School of Medicine, Chiba University, Chiba, Japan, 2Radiology, Eastern Chiba Medical Center, Togane, Japan, 3Philips Japan, Tokyo, Japan, 4Radiology, Chiba University Hospital, Chiba, Japan
Synopsis
MR neurography for the crus is challenging because signals of the vessels and subcutaneous edema interrupt visualization of the nerve, and the water content of the nerve is small. Phase-cycling diffusion-sensitized driven-equilibrium (pcDSDE) can reduce signals of the neighboring structures including the vesssels, and visualize the nerves with diffusion contrast. pcDSDE was better than 3D-NerveVIEW for visualizing the tibial and sural nerves in the crus. The contrast ratio between the tibial nerve and neighboring muscle was significantly higher on pcDSDE than on 3D-NerveVIEW in both the proximal and distal crura.
INTRODUCTION
3D-NerveVIEW is a T2-weighted image-based sequence and achieves good visualization of the brachial and lumbosacral plexus.1,2 However, when trying to visualize the nerves in the crus, signals of the vessels and subcutaneous edema interrupt signals of the nerve. There are two hypothesized reasons why the nerves in the crus are challenging to be visualized. First, standard MR neurography sequences such as 3D-NerveVIEW cannot suppress venous signals sufficiently. Second, the distal part of the nerves has lower free-water content than the proximal part. Therefore, a sequence for MR neurography with high blood signal suppression and diffusion contrast has been desired.Phase-cycling diffusion-sensitized driven-equilibrium (pcDSDE) is a sequence designed to enhance diffusion contrast.3 The purpose of the present study was to compare the abilities to visualize the nerves in the crus between pcDSDE and 3D-NerveVIEW.
METHODS
15 volunteers (median age 27, age-range 22-49, 13 men and 2 women) were included in this study. MR neurography with pcDSDE and 3D-NerveVIEW was acquired in the proximal part of the crus using a trousseau coil on 3.0-Tesla MR system (Philips Ingenia 3.0T). Also, the distal part of the right crus was scanned using a knee coil. The scanning parameters are summarized in Figure1.A neuroradiologist (12 years of experience for neuroradiology) tried to detect the tibial nerves. The contrast ratio (CR) was calculated between the nerve and neighbor muscle as follows: CR = [SI (nerve) – SI (muscle)] / [SI (nerve) + SI (nerve)], where SI (nerve) is the signal intensity of the nerve and SI (muscle) is the signal intensity of the neighbor muscle.1,2 The CR was tested with the Wilcoxon signed-rank test. Also, the CR of the right tibial nerve in the proximal and distal crura was compared using the Mann-Whitney U test on pcDSDE and 3D-NerveVIEW, respectively. P-values less than 0.05 were considered significant. Moreover, visualization of the sural nerve, which runs in the calf region of the distal crus,4,5 was checked. The nerves in the distal crus were confirmed with axial T2-weighted image.
RESULTS
In the proximal crus of all 15 cases, the bilateral tibial nerves were clearly visualized with pcDSDE, whereas they were difficult to be recognized only with 3D-NerveVIEW due to the remaining signals of the veins (Fig. 2). The nerves could be detected on 3D-NerveVIEW with reference to pcDSDE. There was a significant difference in the CR between pcDSDE and 3D-NerveVIEW (median 0.282 [IQR 0.246-0.297] vs. 0.243 [0.220-0.264], P<0.001) in the proximal crus (Fig. 3). In the distal crus, the tibial nerve and its branches, including the medial and lateral plantar nerves, were recognized well only on pcDSDE (Fig. 4). The CR on pcDSDE was better than that on 3D-NerveVIEW (0.291 [0.251-0.330] vs. 0.171 [0.139-0.188], P=0.002).There was no significant difference of the CR between the proximal and distal crura on pcDSDE (P=0.857), whereas the CR was decreased on 3D-NerveView in the distal crus compared with the proximal (P=0.004) (Fig. 3). The sural nerve was visualized on pcDSDE in 10 of 15 cases (66.7%), whereas it was not detected on 3D-NerveVIEW (Fig. 5).
DISCUSSION
pcDSDE visualized the tibial nerves significantly better than 3D-NerveVIEW in both the proximal and distal crura. pcDSDE can be a standard sequence to visualize the peripheral nerves in the crus.pcDSDE consists of DSDE pre-pulse and 3D phase-cycled T1 turbo field echo.3 DSDE is a variation of motion-sensitized driven-equilibrium (MSDE) applied in 3D-NerveVIEW. MSDE uses low b-value motion probing gradient (MPG), whereas DSDE uses high b-value MPG. The MPG pulse can suppress signals from vessels. Also, DSDE and MSDE are based on T2 preparation pulse, so that they can suppress muscle signals of the background. Phase cycling cancels signals derived from T1 effects, so that diffusion contrast is enhanced. Moreover, modified DSDE was applied to this study. This DSDE pre-pulse included adiabatic refocusing pulses, eddy-current preparation, and motion-compensated MPG. Strong MPGs were applied perpendicular to the course of the nerves (anteroposterior and right-left directions) to suppress signals of the vein, and week MPG was applied parallel to the nerves (superoinferior direction) to visualize the nerve. As a result, pcDSDE accomplished visualization of the tibial nerve in the crus.
3D-NerveVIEW was almost useless especially in the distal crus. This result should be according to the low T2 value of the nerve in the distal part implying low free-water content. Diffusion-based sequences are essential to visualize the nerve in such regions.
The sural nerve was visualized in the majority of the cases on pcDSDE. The sural nerve is the main target for peripheral nerve biopsy. Thus, there is a possibility that the correlation between pathological and imaging findings is realized.
The weak points of pcDSDE are low signal-to-noise ratio and long scan time. Spatial resolution is limited to keep signal-to-noise ratio. Also, phase cycling is vulnerable for motion during acquisition. However, the nerves in the crus could be visualized only with a diffusion-based sequence and conventional diffusion-based MR neurography lose anatomical information and the resolution is worse than pcDSDE.
CONCLUSION
pcDSDE was better than 3D-NerveVIEW for visualizing the tibial and sural nerves in the crus. Especially in the distal crus, only pcDSDE could visualize the nerves clearly.Acknowledgements
No acknowledgement found.References
- Hiwatashi A, Togao O, Yamashita K, et al. Evaluation of chronic inflammatory demyelinating polyneuropathy: 3D nerve-sheath signal increased with inked rest-tissue rapid acquisition of relaxation enhancement imaging (3D SHINKEI). Eur Radiol. European Radiology; 2017;27(2):447–453.
- Hiwatashi A, Togao O, Yamashita K, et al. Lumbar plexus in patients with chronic inflammatory demyelinating polyneuropathy: Evaluation with 3D nerve-sheath signal increased with inked rest-tissue rapid acquisition of relaxation enhancement imaging (3D SHINKEI). Eur J Radiol; 2017;93(May):95–99.
- Yoneyama M, Obara M, Ozawa Y, et al. High-Resolution 3D MR Neurography of the Wrist using Phase-Cycling Diffusion-Sensitized Driven-Equilibrium (pcDSDE). Proceeding in ISMRM2015.
- Garagozlo C, Kadri O, Atalla M, et al. The anatomical relationship between the sural nerve and small saphenous vein: An ultrasound study of healthy participants. Clin Anat. 2019;32(2):277–281.
- Gu H, Xiong Z, Xu J, Li G, Wang C. Clinical and anatomical study of the distally based lesser saphenous veno-lateral sural neurocutaneous flap for lower extremity coverage. J Orthop Sci. Elsevier Masson SAS; 2013;18(5):740–748.
Figures
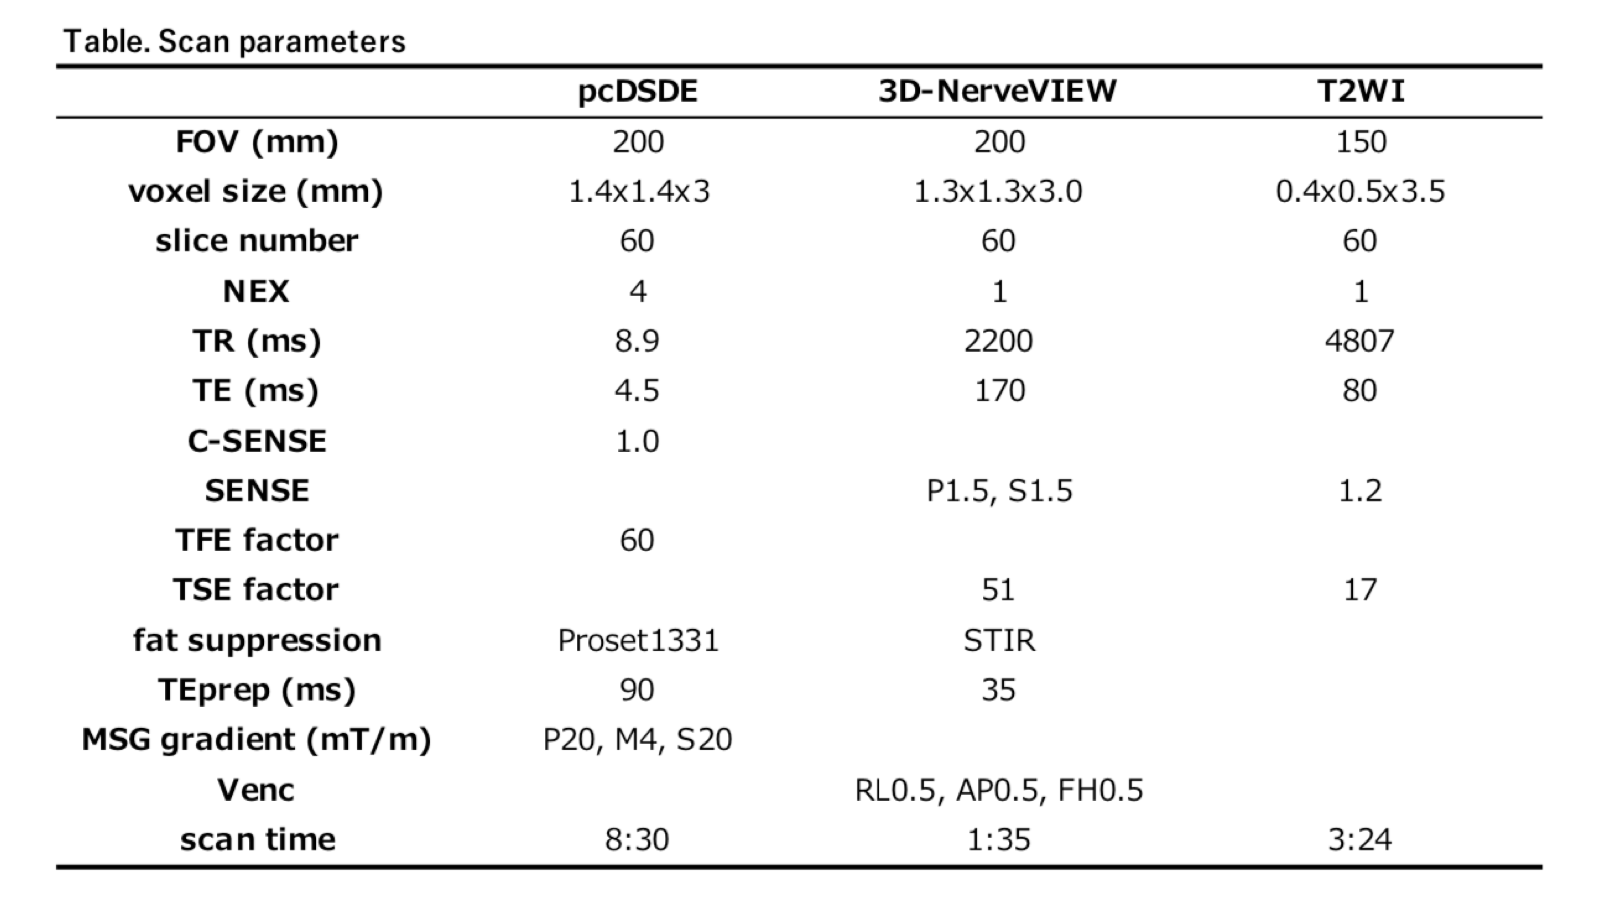
Figure 1. Scan parameters

Figure 2. pcDSDE and 3D-NerveVIEW of the proximal crus
On DSDE, the bilateral tibial nerves are visualized clearly. On 3D-NerveVIEW, the tibial nerves are inconspicuous due to the remaining signals of the vein.
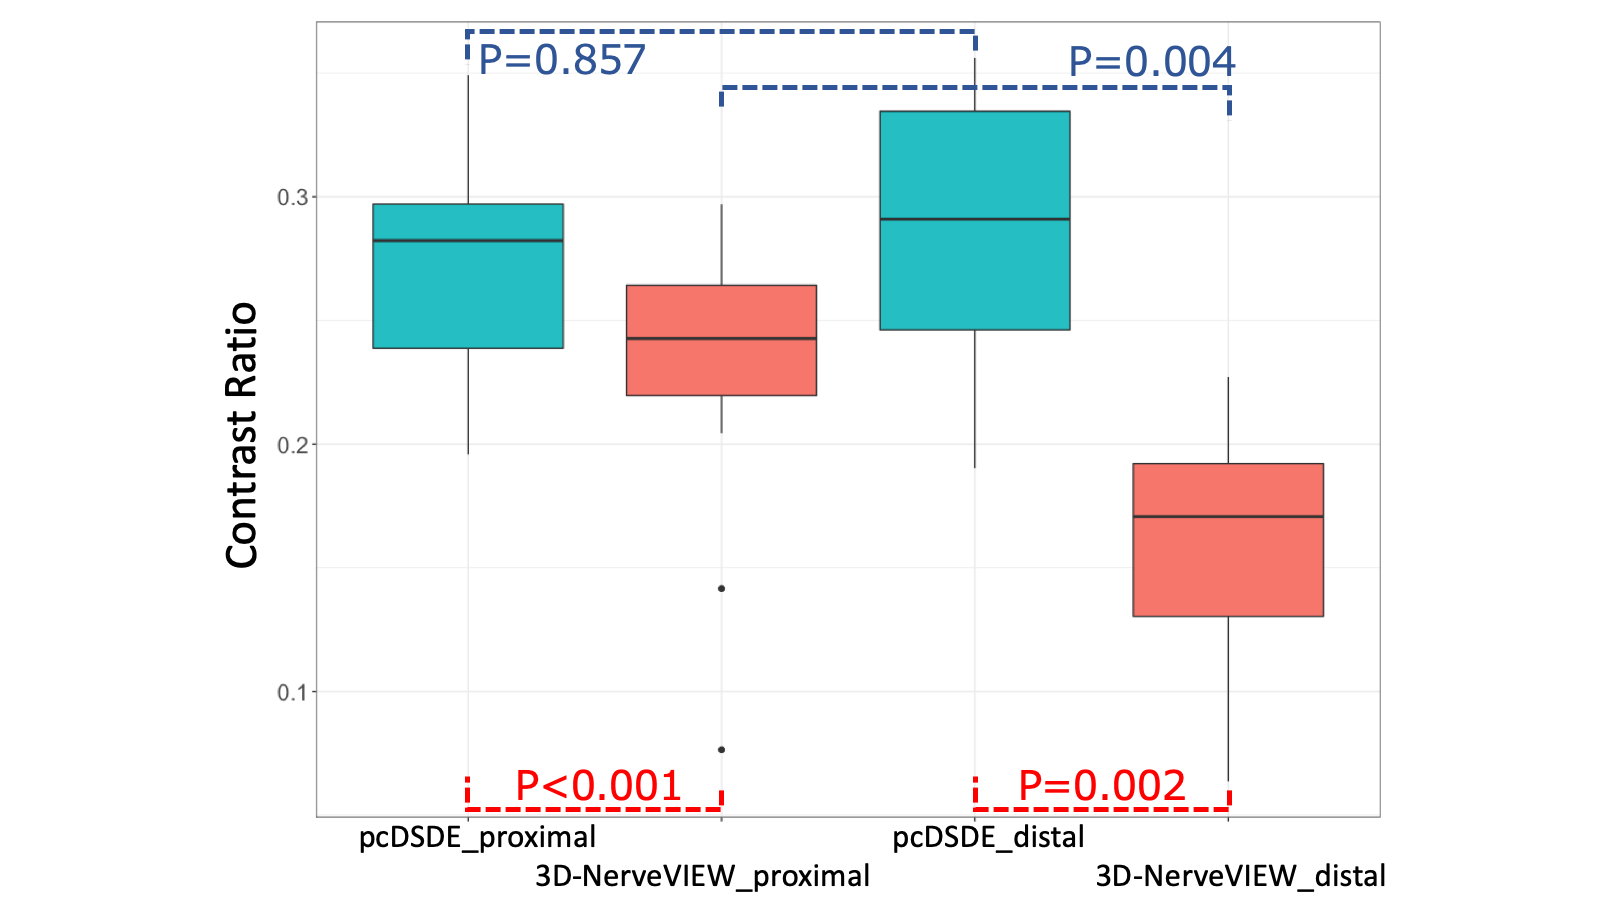
Figure 3. Box plot of the contrast ratio between the tibial nerve and neighboring muscle
The contrast ratio (CR) on pcDSDE are significantly higher than that on 3D-NerveVIEW in the proximal and distal crura (Red, P<0.001 and P=0.002). There is no difference in the CR between the proximal and distal crura on pcDSDE (Blue, P=0.857). In contrast, the CR in the distal crus is significantly decrease compared with the CR in the proximal on 3D-NerveVIEW (Blue, P=0.004).
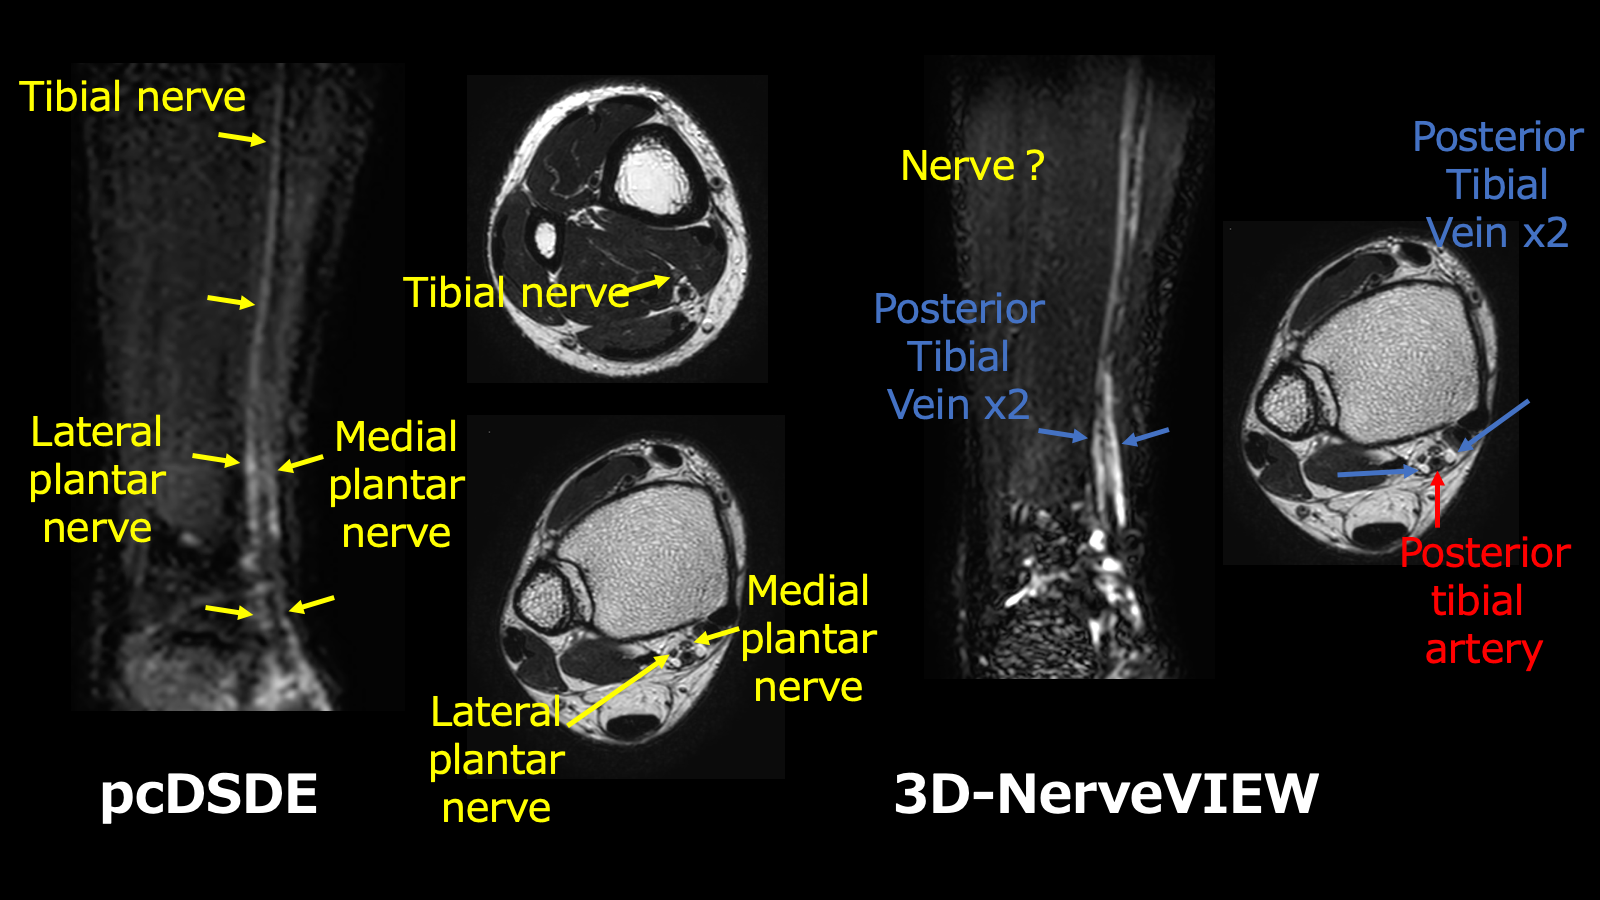
Figure 4. pcDSDE and 3D-NerveVIEW of the distal crus
pcDSDE visualize the right tibial nerve and its branches such as the lateral and medial plantar nerves, whereas only veins are detected on 3D-NerveVIEW at a glance.
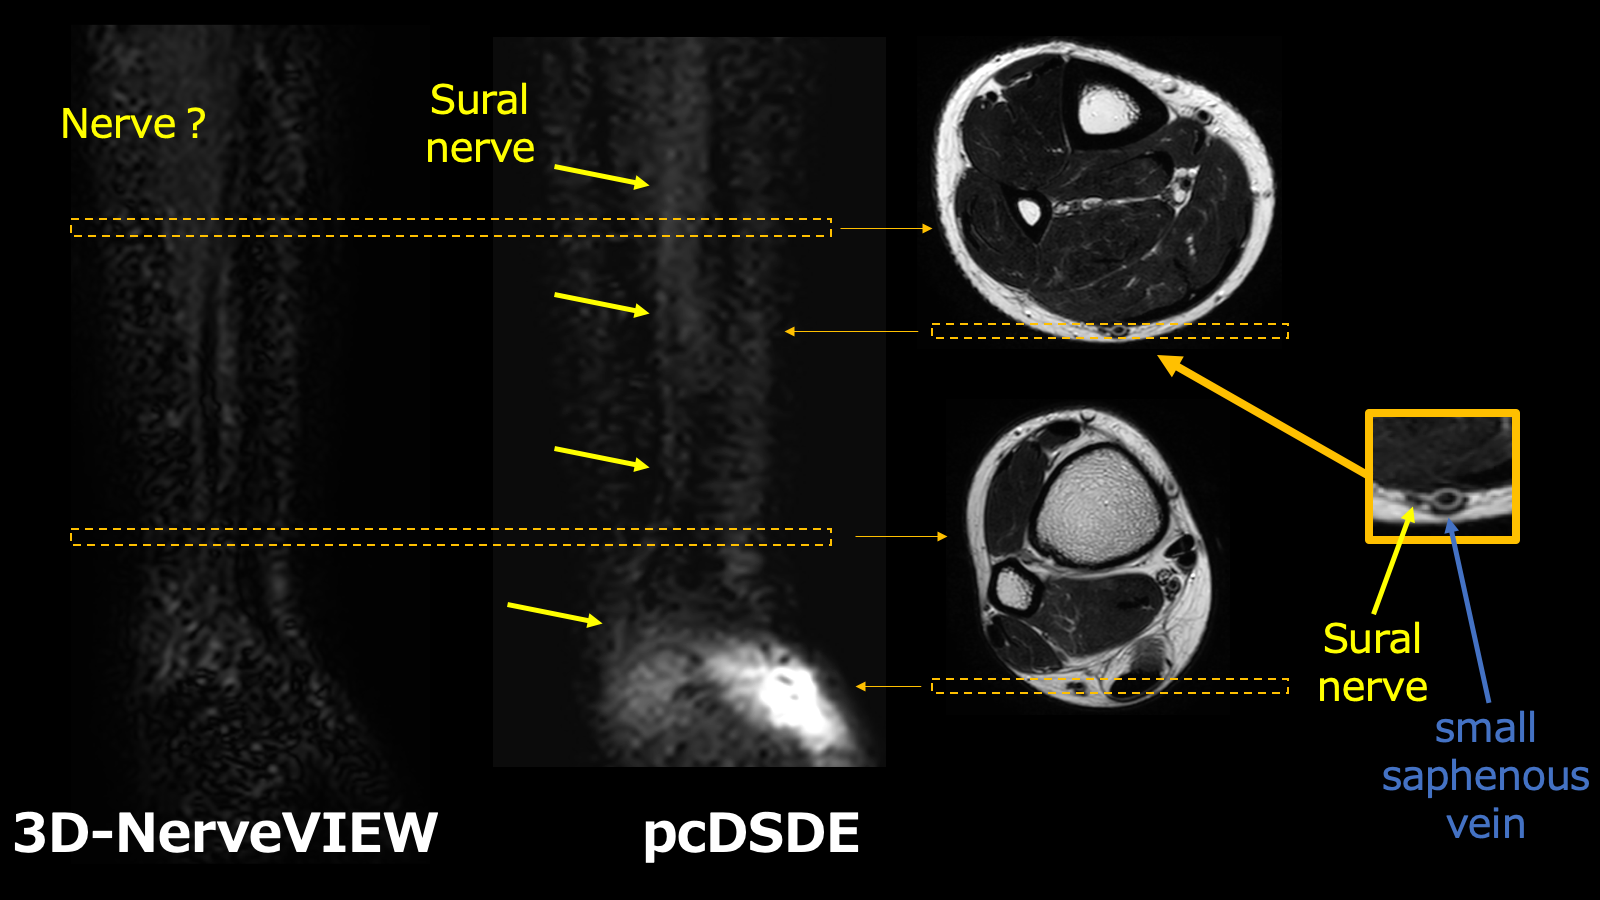
Figure 5. Visualization of the sural nerve on pcDSDE and 3D-NerveVIEW
The sural nerve running along the small saphenous vein is visualized only on pcDSDE. The nerve is confirmed with axial T2-weighted images.