2832
Study on the optimization of BOLD magnetic resonance ischemia-reactive hyperemia model of skeletal muscle of calf1The Third Hospital of Hebei Medical University, Shijiazhuang, China
Synopsis
In BOLD-MRI studies, cuff compression was often used to establish the ischemia-reactive hyperemia model of calf muscle.We found some BOLD signals did not decrease during ischemia, but increased or stay the same.This study was to find the reasons why BOLD signal showed multiple trends in ischemic period and to optimize the ischemia model. BOLD scan was performed on volunteers under two cuff pressures.BOLD signals of all muscles showed a downward trend in the P1 model of partly reduced blood supply. However, in P2 model of blood supply blocked completely, BOLD signals had mostly gone up during ischemia ,unexpectedly.
INTRODUCTION
In recent years, the morbidity of peripheral arterial occlusive disease (PAOD) has increased rapidly.1 However, there are limitations in methods of evaluating the microcirculation perfusion and the oxygenation of skeletal muscle, which can more accurately reflect the severity of PAOD.1-6Blood oxygen level-dependent MR(BOLD-MR) has gained attention for evaluation of skeletal muscle tissue oxygenation.7-10 Studies found BOLD signal intensity of calf muscle during ischemia and hyperemia was positively and linearly correlated with transcutaneous oxygen pressure (TcPo2) and microcirculation perfusion measured by Laser Doppler Flowmetry (LDF).10 Most studies used the tourniquet to compress the thigh with the pressure from 50mmHg above systolic pressure to 220mmHg to establish a ischemia-reactive hyperemia model of calf muscles to provoke measurable BOLD signal alterations.8-14 However, tourniquet pressure with 220mmHg in our previous study,BOLD time signals during ischemia presented a variety of trends, not all downward trends as that in other studies, also including upward trends and fluctuating around baseline.This couldn't be explained according to existing theories.8,10,15We hypothesized this might be due to poor repeatability of the ischemia-reactive hyperemia model of calf muscle, because of the compression pressure. However, the high repeatability of the model was important because the evluation of vascular reserve function in PAOD was based on the characteristics of the BOLD signal during ischemia and hyperemia.11-13,15 Ultrasound doppler was introduced to ensure the effectiveness of the ischemic model in the present study. The purpose was to investigate the causes of multiple trends of BOLD signal during ischemia and optimize the ischemia-reactive hyperemia model.
METHODS
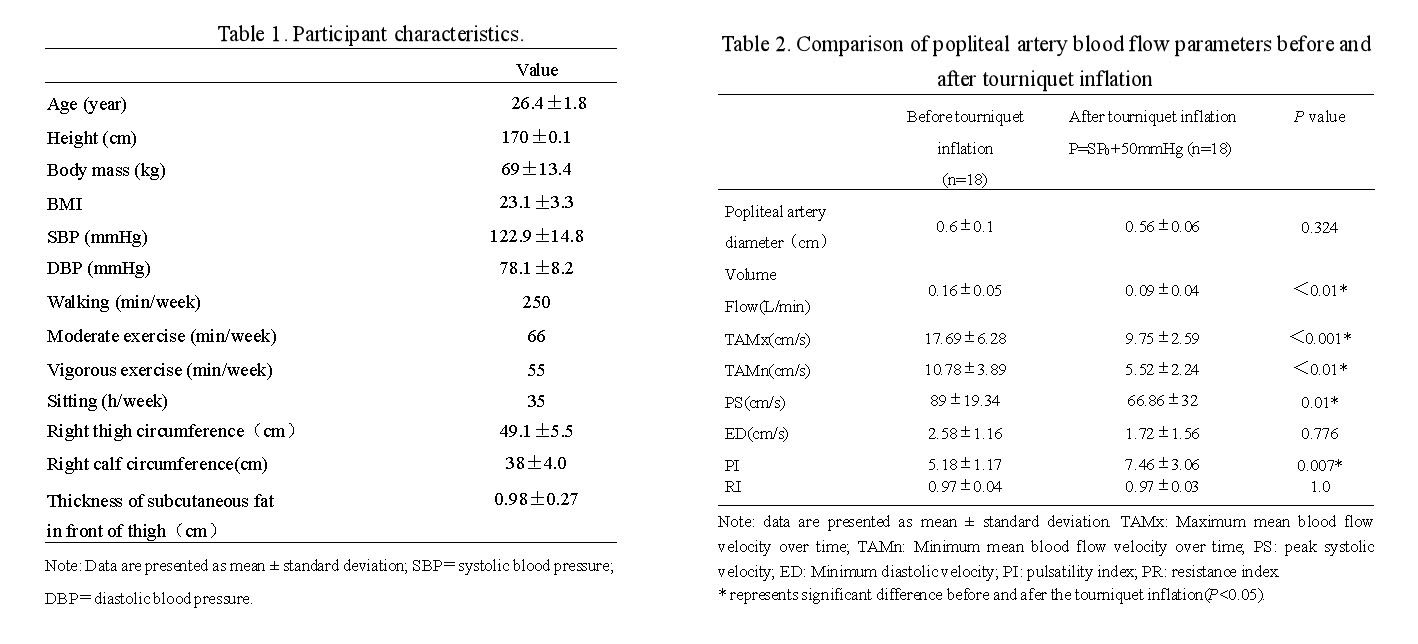
18 healthy volunteers uderwent BOLD-MRI of calf muscle, using a 3T scanner.The ischemia - reactive hyperemia model was established by banding an automatic pneumatic tourniquet to the middle of the right thigh. Two different tourniquet pressures were set to create two models in each volunteer:P1 model (The pressure was 50mmHg higher than individual brachial systolic pressure )and P2 model( The pressure was set to the pressure of popliteal artery blood flow interrupted completely, based on doppler ultrasound monitoring popliteal artery). The scanning process was in order resting period, ischemia period, and hyperemia period. Five volunteers repeated the scans in a month.After data normalization, BOLD signal of tibialis anterior, tibialis posterior, soleus, gastrocnemius, and peroneus was measured and BOLD time course data was obtained. BOLD time course data was evaluated for five parameters including minimum ischemic value(MIV), peak hyperemia value(PHV), medium value in ischemia period(MEV), end value(EV), time to peak(TTP). The cox-stuart trend test was used to analyze the trend of BOLD signal. Paired t-test was used to analyze the differences of BOLD time course data parameters between two models.
Seven popliteal artery blood flow parameters were measured using ultrasonic doppler to analyze the correlation between blood flow parameters and BOLD signals.
RESULTS
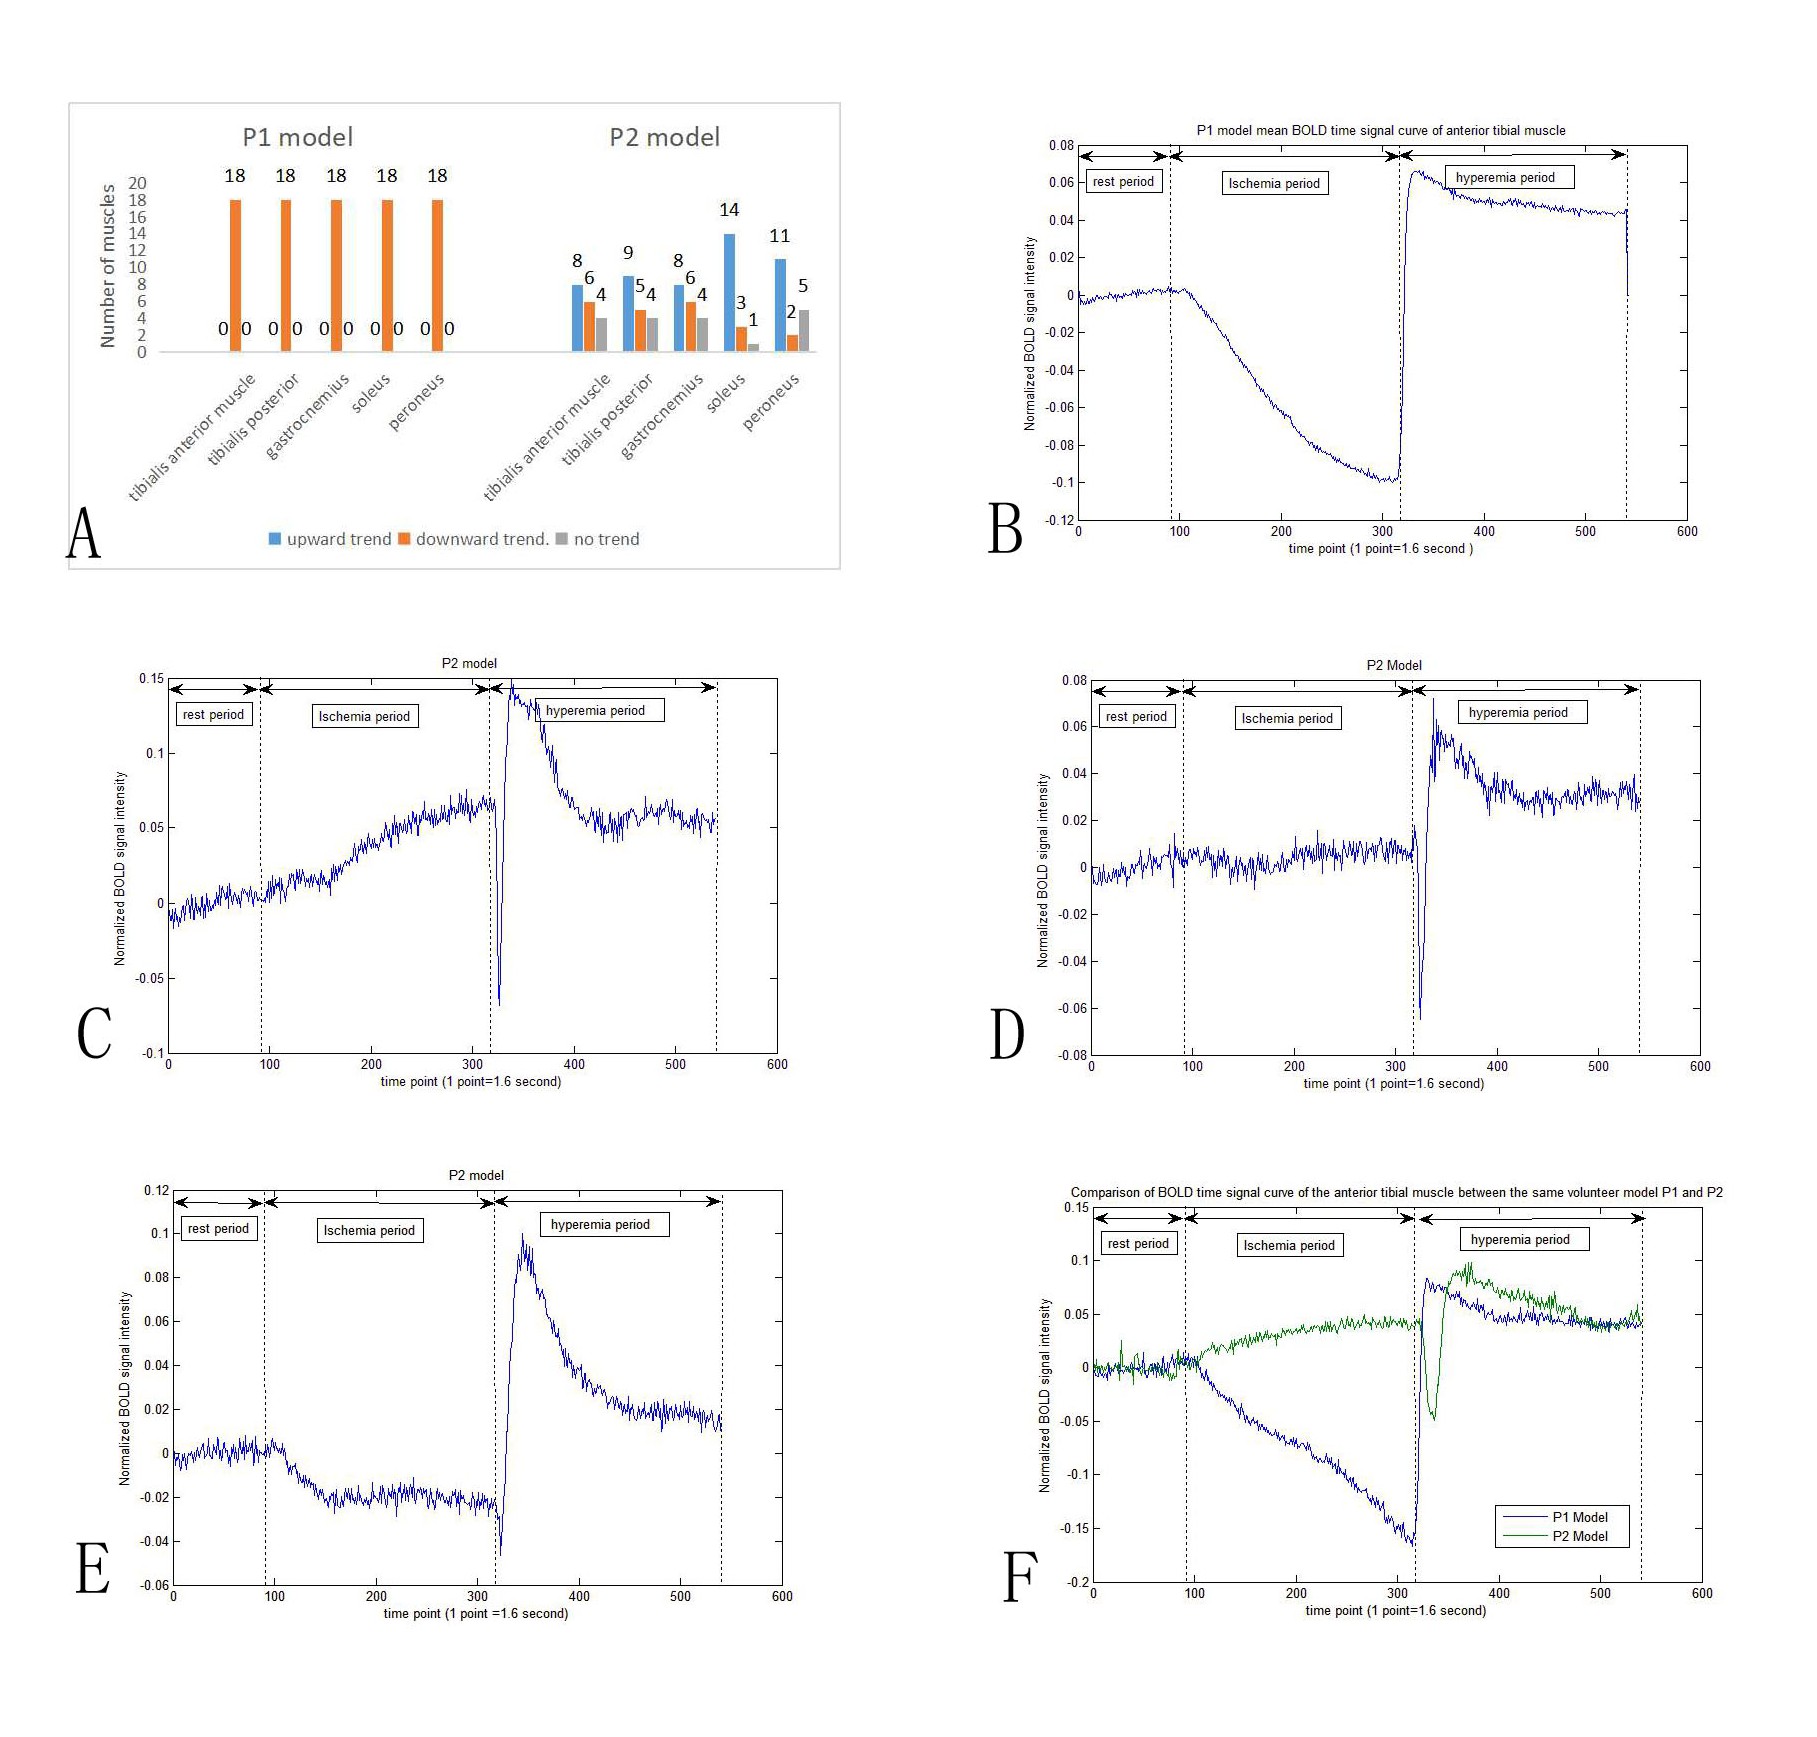
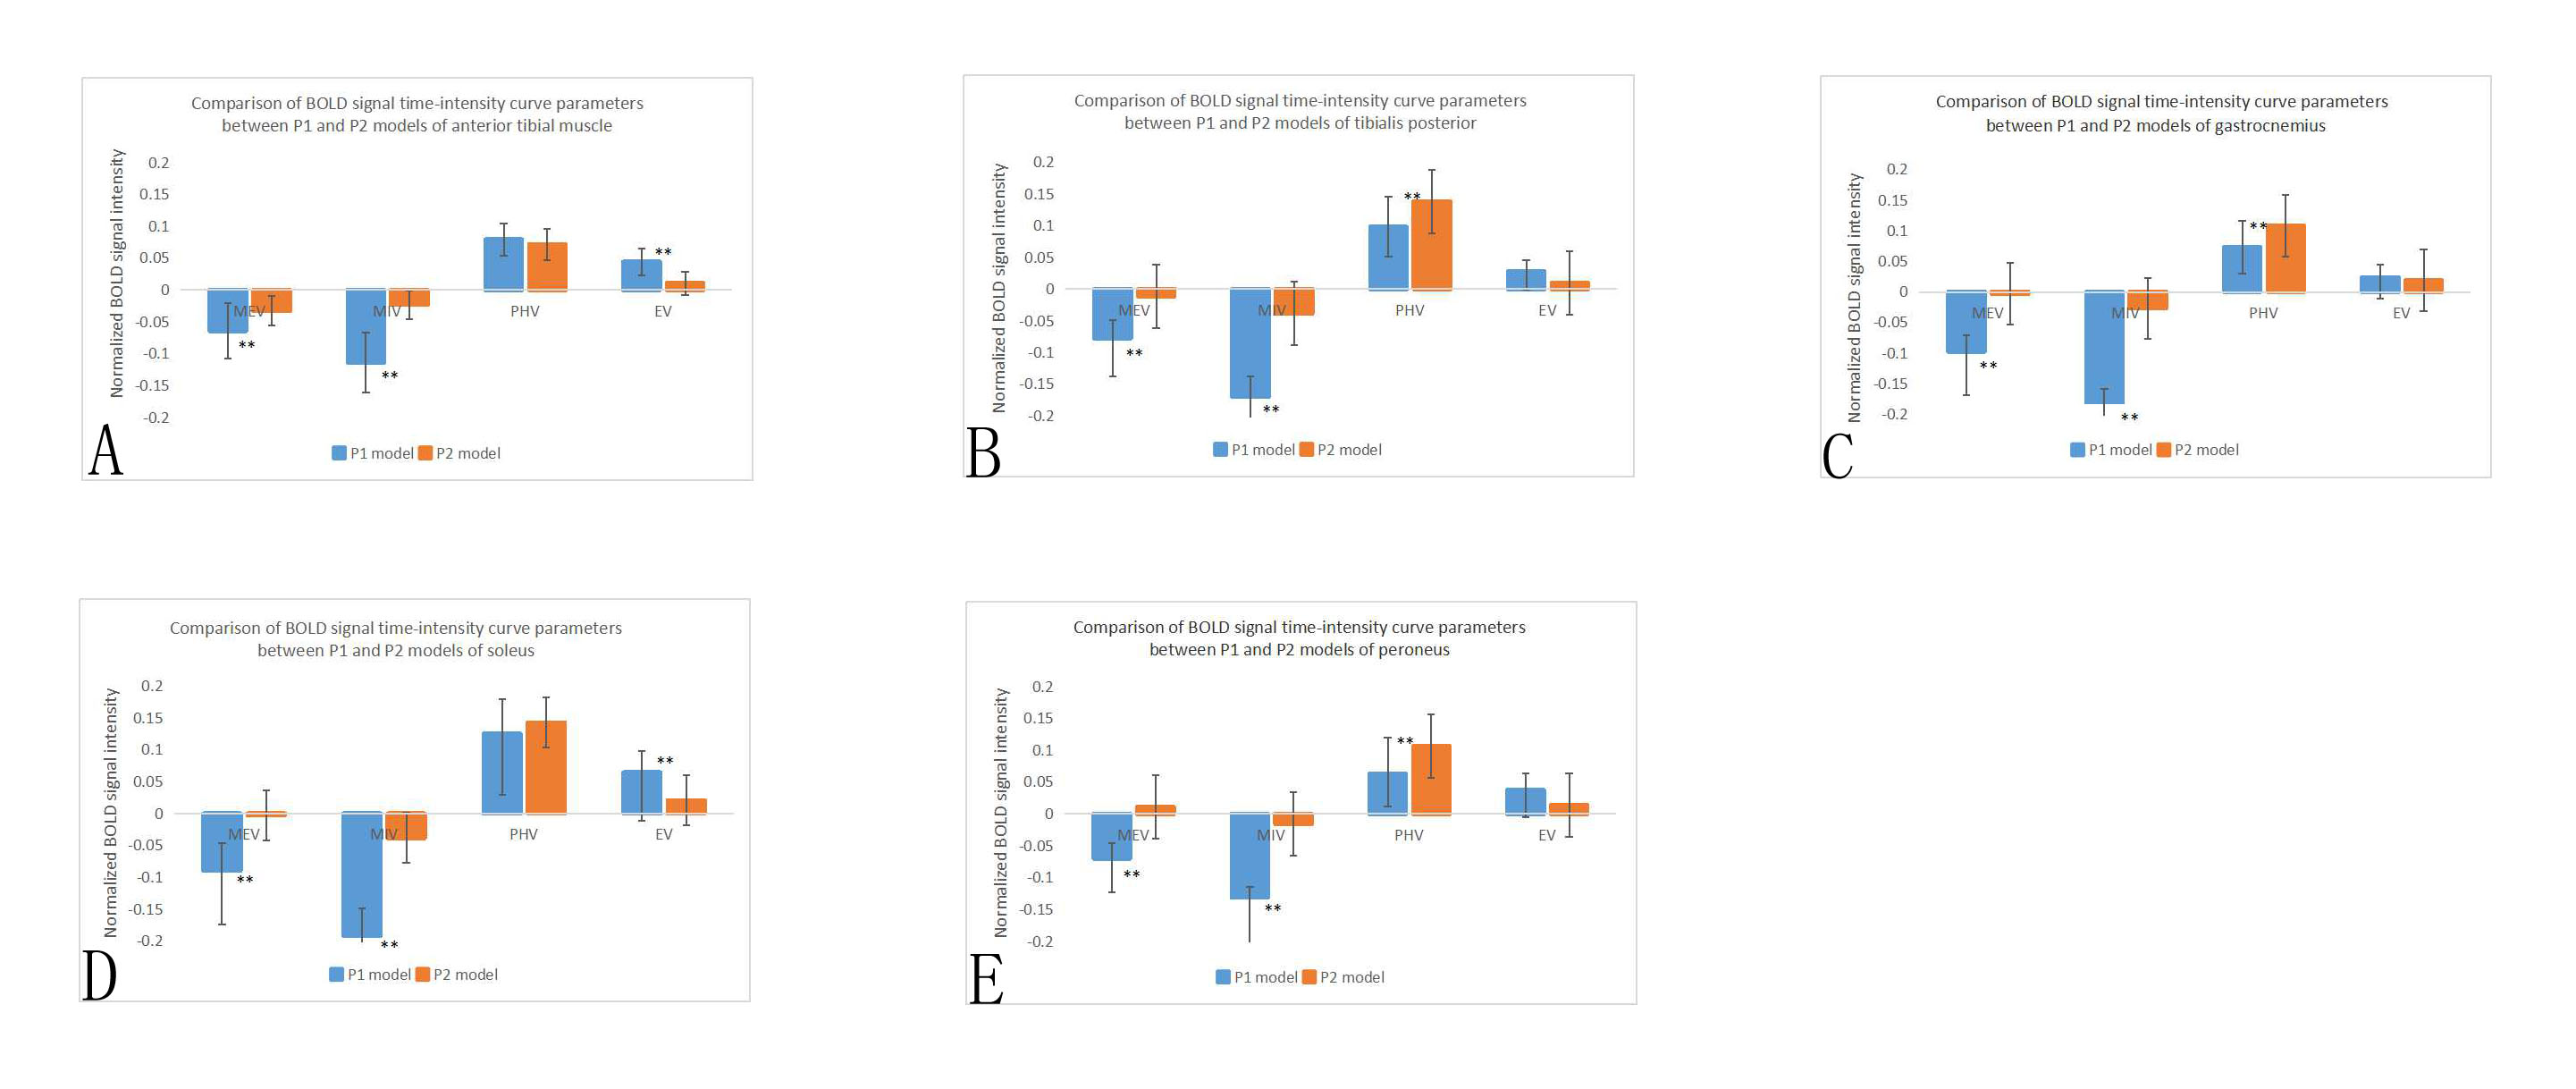
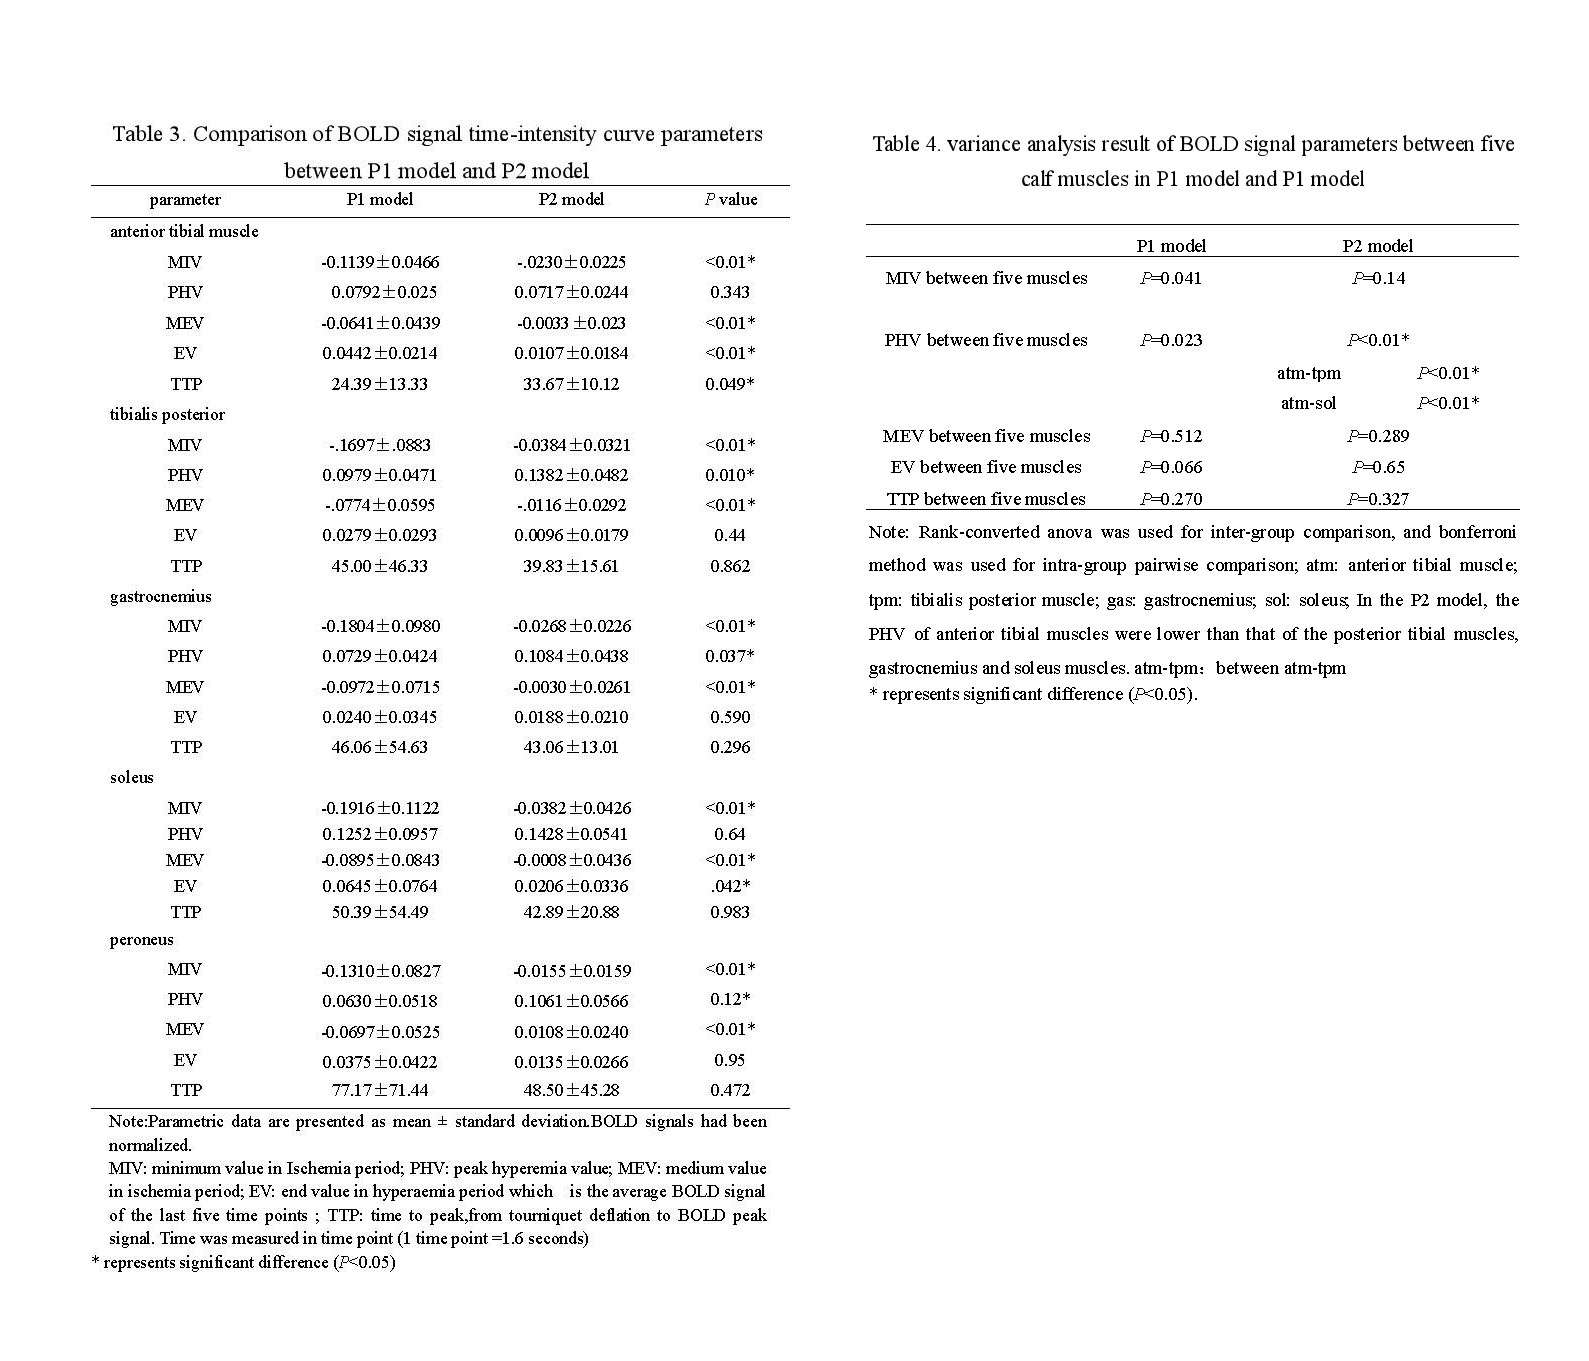
In P1 model, ultrasound spectrum showed the popliteal blood flow was decreased but not interrupted during ischemia (Figure 1).There was a significant difference in BOLD signal trends in the ischemia stage between two models.In P1 model, all BOLD time course data in ischemic stage showed downward trend, and signals were all below the baseline.In P2 model, the BOLD time course data in ischemia stage presented various trends including upward trend(accounted for 55.6%), downward trend (24.4%)and fluctuation near the baseline(20%) (Figure 2).MEV and MIV of all muscles were significantly lower in P1 model than that in P2 model. The results of MIV, PHV, MEV, EV and TTP of each muscle were shown in Figure 3 and Figure 4. Popliteal artery blood flow parameters and BOLD signal parameters of some muscles had a linear correlation, but there was no significant regularity (Figure 5).Intraclass correlation coefficient was greater than 0.85.
DISCUSSION
Ultrasound doppler was introduced in this study. The tourniquet pressure in P1 model couldn’t interrupt the femoral artery, which was different from previous speculations on this model.10,11,13The BOLD time course data in P1 and P2 models showed a significantly different trend during ischemia.BOLD signal in P1 model was mainly affected by tissue perfusion and oxygen consumption. 10,15-17 During the ischemia period, decreased oxygen supply and continuous tissues oxygen consumption resulted in oxyhemoglobin decreasing in microcirculation, so BOLD signal decreased. During hyperemia, the recovery of blood supply and rapid outflow of deoxyhemoglobin accumulated in vein lead to the peak of BOLD signal.10 BOLD signal in P1 model reflect the tissue perfusion. P1 model was superior to P2 model in skeletal muscle BOLD.
In P2 model, the blood supply was completely interrupted, while the BOLD signal rose unexpectedly.16 This phenomenon couldn’t be explained from the perspective of tissue perfusion. This might be related to anaerobic metabolism and anaerobic threshold.16 Glycolysis might be the most important reason for the increase of BOLD signal.16-18 The exact mechanism was unclear. The BOLD signal differences between muscles in P2 model might be because of muscle fibers types,20,21 uncoupling protein 3,21-23 and degree of glycolysis.16-18
CONCLUSION
The application of a ischemia-reactive hyperemia model with good repeatability in BOLD-MRI may provide possibility of evaluation vascular reserve function and the severity of PAOD. Future investigations should focus on that to elucidate fully the clinical potential of BOLD-MRI. Besides, the specific mechanism of BOLD signal in P2 model needed further study.Acknowledgements
This work is supported by Graduate School of Hebei Medical University.I thank my advisor Professor Jianling Cui for helpful conversation about scientific ideas and research methods, and Dr. lisha Duan and Dr. Ruiqing Shi for assistance with the the data processing.References
1. Lawall H, Huppert P, Espinola-Klein C, et al. The Diagnosis and Treatment of Peripheral Arterial Vascular Disease. Deutsches Aerzteblatt Online 2016;113(43):729-36.
2. Rooke TW, Hirsch AT, Misra S, et al. 2011 ACCF/AHA Focused Update of the Guideline for the Management of Patients With Peripheral Artery Disease (updating the 2005 guideline): a report of the American College of Cardiology Foundation/American Heart Association Task Force on Practice Guidelines. J AM COLL CARDIOL 2011;58(19):2020-45.
3. Aboyans V, Criqui MH, Abraham P, et al. Measurement and interpretation of the Ankle-Brachial Index: A scientific statement from the American Heart Association(Article). CIRCULATION 2012(No.24):2890-909.
4. HH F, JJ B, van Waning VH, et al. The long-term prognostic value of the resting and postexercise ankle-brachial index. Archives Of Internal Medicine 2006(No.5):529-35.
5. Gerhard-Herman MD, Gornik HL, Barrett C, et al. 2016 AHA/ACC Guideline on the Management of Patients With Lower Extremity Peripheral Artery Disease: Executive Summary: A Report of the American College of Cardiology/American Heart Association Task Force on Clinical Practice Guidelines. J AM COLL CARDIOL 2017;69(11):1465-508.
6. Assessment SCOH. Peripheral Arterial Disease - Diagnosis and Treatment: A Systematic Review. Stockholm: Swedish Council on Health Technology Assessment (SBU), 2008.
7. Aschwanden M, Partovi S, Jacobi B, et al. Assessing the end-organ in peripheral arterial occlusive disease—from contrast—enhanced ultrasound to blood-oxygen-level-dependent MR imaging. Cardiovasc Diagn Ther 2014;4(2):165-72.
8. Stacy MR, Qiu M, Papademetris X, et al. Application of BOLD Magnetic Resonance Imaging for Evaluating Regional Volumetric Foot Tissue Oxygenation: A Feasibility Study in Healthy Volunteers. EUR J VASC ENDOVASC 2016;51(5):743-9.
9. Jacobi B, Bongartz G, Partovi S, et al. Skeletal muscle BOLD MRI: from underlying physiological concepts to its usefulness in clinical conditions. J MAGN RESON IMAGING 2012;35(6):1253-65.
10. Ledermann HP, Heidecker H, Schulte A, et al. Calf Muscles Imaged at BOLD MR: Correlation with TcPo2 and Flowmetry Measurements during Ischemia and Reactive Hyperemia—Initial Experience. RADIOLOGY 2006;241(2):477-84.
11. Ledermann HP, Schulte AC, Heidecker HG, et al. Blood oxygenation level-dependent magnetic resonance imaging of the skeletal muscle in patients with peripheral arterial occlusive disease. CIRCULATION 2006;113(25):2929-35.
12. Bajwa A, Wesolowski R, Patel A, et al. Blood Oxygenation Level-Dependent CMR-Derived Measures in Critical Limb Ischemia and Changes With Revascularization 2016;67(4):420-31.
13. Potthast S, Schulte A, Kos S, et al. Blood Oxygenation Level-Dependent MRI of the Skeletal Muscle during Ischemia in Patients with Peripheral Arterial Occlusive Disease. RöFo - Fortschritte auf dem Gebiet der Röntgenstrahlen und der bildgebenden Verfahren 2009;181(12):1157-61.
14. Duteil S, Wary C, Raynaud JS, et al. Influence of vascular filling and perfusion on BOLD contrast during reactive hyperemia in human skeletal muscle. MAGN RESON MED 2006;55(2):450-4.
15. Partovi S, Karimi S, Jacobi B, et al. Clinical implications of skeletal muscle blood-oxygenation-level-dependent (BOLD) MRI. Magnetic Resonance Materials in Physics, Biology and Medicine 2012;25(4):251-61.
16. Damon BM, Gregory CD, Hall KL, et al. Intracellular acidification and volume increases explain R(2) decreases in exercising muscle. MAGN RESON MED 2002;47(1):14-23.
17. Damon BM, Gore JC. Physiological basis of muscle functional MRI: predictions using a computer model. J Appl Physiol (1985) 2005;98(1):264-73.
18. Fung BM, Puon PS. Nuclear magnetic resonance transverse relaxation in muscle water. BIOPHYS J 1981;33(1):27-37.
19. Porter C, Reidy PT, Bhattarai N, et al. Resistance Exercise Training Alters Mitochondrial Function in Human Skeletal Muscle. Med Sci Sports Exerc 2015;47(9):1922-31.
20. Schiaffino S, Reggiani C. Molecular diversity of myofibrillar proteins: gene regulation and functional significance. PHYSIOL REV 1996;76(2):371-423.
21. Hesselink MK, Keizer HA, Borghouts LB, et al. Protein expression of UCP3 differs between human type 1, type 2a, and type 2b fibers. FASEB J 2001;15(6):1071-3.
22. Boss O, Samec S, Paoloni-Giacobino A, et al. Uncoupling protein-3: a new member of the mitochondrial carrier family with tissue-specific expression. FEBS LETT 1997;408(1):39-42.
23. Russell AP, Somm E, Praz M, et al. UCP3 protein regulation in human skeletal muscle fibre types I, IIa and IIx is dependent on exercise intensity. J Physiol 2003;550(Pt 3):855-61.
Figures