2827
Trabecular Bone Microarchitecture: A Comparative Analysis between High Field, Ultra High Field MRI and X-ray micro CT in human anatomical samples1IUSTI, AixMarseille, Marseille, France, 2ISM, AixMarseille, Marseille, France, 3CRMBM, AixMarseille, Marseille, France
Synopsis
It has been previously suggested that trabecular bone could be assessed using ultra-high and high-field MRI. In the present study, human femurs head were scanned using with MRI at 3T and 7T MRI and the corresponding metrics were compared to those obtained using high resolution X-ray micro tomography.
Introduction
Osteoporotic bones are weak and more sensitive to fractures due to a low bone mass and a microarchitectureal deterioration of bone tissue [1]. In Europe in 2010, 22 millions women and 5.5 millions men had osteoporosis corresponding to an economic burden estimated at 37 billions euros which is expected to increase by 25% in 2025 [2]. Osteoporosis is currently diagnosed either on the basis of fragility fractures occurrence or by bone mineral density (BMD) using dual energy x-ray absorptiometry (DXA). Recently, it has become possible to assess bone microstructure non-invasively using magnetic resonance imaging (MRI) and high-resolution quantitative computed tomography (qCT). Most of the MRI studies has been performed at 1.5T or 3T and assessed superficial bones such as distal radius or tibia [1, 3, 4, 5] both in-vivo and on small anatomic samples. Recently, deeper bones such as the proximal femur have been assessed using ultra-high magnetic field. So far, very few comparative analysis have been reported and the issue of partial volume effects has been scarcely assessed.In the present study, we compared metrics of bone microarchitecture obtained using high field (3T) MRI, ultra-high field (7T) MRI and microtomography (µCT).
Methods
Sample preparation:In order to acquire MR images of cadaveric femurs without artefacts errors due to air bubbles present inside the bone, we developed an original sample preparation technique [6].
µCT measurements:
µCt images were acquired using Rx-Solution EasyTom XL ULTRA microtomograph [7], with a 150 kV X-Ray Hamamatsu Tube allowing a focus spot size of 5 μm. To completly acquire the femur head a voxel size of 51 µm has been used.
MRI measurements:
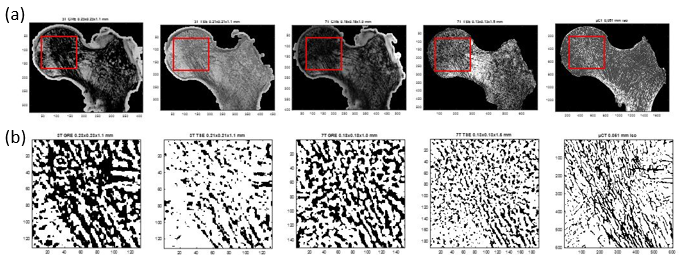
Four different MRI acquisitions were performed i.e. turbo spin echo and gradient echo at 3T and 7T. 3T acquisitions were performed using a 16Ch Heart coil, while 7T MRI was performed using a 28Ch Knee coil. The corresponding sequence parameters were similar to those used in the literature [8, 9, 10] and adapted to our samples (fig. 1). Coronal planes of the four different MRI acquisitions and µCT are illustrated in figure 2(a). For all the MRI acquisitions we increased the resolution as much as possible keeping the acquisition time at 14±4 min, an acceptable exposure time for patients.
Image analysis:
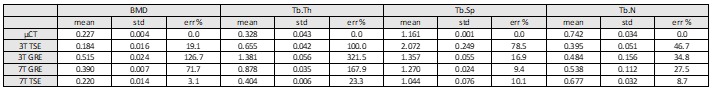
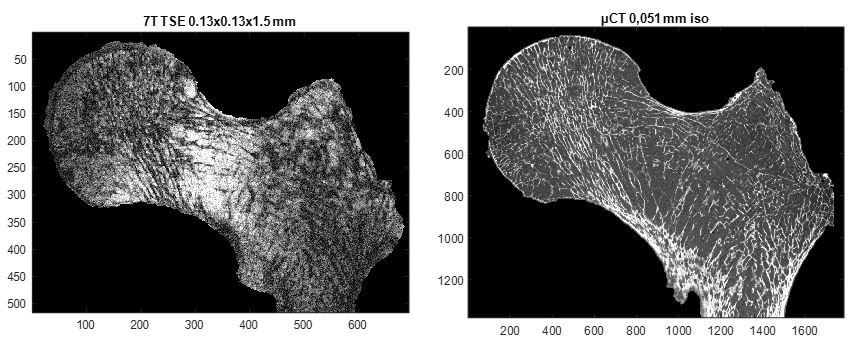
MRI and µCT images (fig. 3) were co-registered in the coronal plane using a 3D registration tool. Conventional histomorphometric parameters were quantified and compared fort µCT and MR images keeping the native resolution of each image. As the binarization of the solid part is not trivial in MR images, we applied an automatic local threshold [11]. The µCT binarization is straightforward as the contrast is high and the voxel size is smaller than the trabecular thickness. figure 4 summarizes bone volume fraction (BVF), trabecular thickness (Tb.Th), trabecular spacing (Tb.Sp) and trabecular number (Tb.N) [8, 12] computed for the same 2D region of interest (ROI) of several planes extracted from the different acquired volumes (fig. 2b).
Results
As indicated in figure 4, parameters quantified from the TSE images provided more accurate results than GRE images when considering values from the µCT images as the ground truth and so in agreement with previous results,[3]. Krug et al. reported that TSE techniques were less susceptible to partial volume effects. Interestingly and as illustrated in figure 4 and 5, histomorphometric metrics quantified from the TSE images recorded at 7T were similar to those quantified from µCT images. the BMD obtained with 7T TSE is very close to the µCT with an error close to 3%. For the other parameters as Tb.Sp or Tb.N the error is less than 10%. As expected, the worst result is obtained for the Tb.Th due to the lack of resolution but this error (23%) is still inferior to those obtained with the others MRI sequences. This work carried on raw data is promising and could provide more accurate results in the future with image enhancement techniques.Conclusions
In vivo MRI of human head femur further confirmed that Turbo Spin Echo sequences are less prone to partial volume effects as compared to GRE sequences. Ultra High field (UHF) MRI can provide histomorphometric metrics comparable to those obtained with µCT imaging thereby indicating that UHF MRI could be considered as the new non invasive imaging modality for the assessment of bone microarchitecture and more particularly for osteoporosis risk stratification.Acknowledgements
This project has received funding from the European Union’s Horizon 2020 research and innovation program under the Marie Skodowska-Curie grant agreement No713750. Also, it has been carried out with the financial support of the Regional Council of Provence- Alpes-Côte d’Azur and with the financial support of the A*MIDEX (n° ANR- 11-IDEX-0001-02), funded by the “Investissements d'Avenir” project funded by the French Government, managed by the French National Research Agency (ANR).References
[1] Chang et al., “3T MR imaging of proximal femur microarchitecture in subjects with and without fragility fracture and nonosteoporotic proximal femur bone mineral density”, Radiology, 2018 May; 287(2):608-619.
[2] E. Hernlund et al., “Osteoporosis in the European Union: medical management, epidemiology and economic burden. A report prepared in collaboration with the International Osteoporosis Foundation (IOF) and the European Federation of Pharmaceutical Industry Associations (EFPIA)”. Arch Osteoporosis, 2013; 8(1-2): 136.
[3] R. Krug et al., “Assessment of trabecular bone structure comparing magnetic resonance imaging at 3 Tesla with high resolution peripheral quantitative computed tomography ex vivo and in vivo”, Osteoporosis Int (2008) 19:653-661.
[4] JF Magmand et al., “Spin-echo micro-MRI of trabecular bone using improved 3D FLASE”, Magn Reason Med., 2009 May ; 61(5): 1114-1121.
[5] C.S. Rajapakse et al., “Magnetic resonance imaging based assessment of bone microstructure as a non-invasive alternative to histomorphometry in patients with chronic kidney disease”, Bone 114, (2018) 14-21.
[6] E. Soldati et al., “MRI assessment of bone microarchitecture in Human Bone samples: The issue of air bubbles artefacts”, ISMRM 2020.
[7] RX Solutions SAS, 3D X-Ray tomography systems.
[8] G. Chang et al., “Finite element analysis applied to 3T MR imaging of proximal femur architecture: lower bone strength in patients with fragility fracture compared with control subjects”, Radiology, vol. 272: Number 2-August 2014.
[9] F.W. Wehrli et al., “Implications of pulse sequence in structural imaging of trabecular bone”, Journal of Magnetic Resonance Imaging 22:647-655 (2005).
[10] Majumdar et al., “In vivo ultra-high-field magnetic resonance imaging of trabecular bone microarchitecture at 7T”, Journal of Magnetic Resonance Imaging 27:854-859 (2008).
[11] J R.P. Dougherty et al., “Computing local thickness of 3D structures with imageJ”, Microsc Microanal 13(Suppl 2),2007.
[12] S. Majumdar et al., “Correlation of trabecular bone structure with age, bone mineral density, and osteoporotic status: in vivo studies in the distal radius using high resolution magnetic resonance imaging”, Journal of Bone and Mineral Research, vol. 12, Number 1, 1997.
Figures