2824
Imaging Cartilaginous Endplates Herniation in the Lumber Spine using ZTE-MRI1GE Healthcare, Taipei, Taiwan, 2Department of Radiology, Tri-Service General Hospital, National Defense Medical Center, Taipei, Taiwan
Synopsis
The cartilage endplate (CEP) plays an important role in the function and homeostasis of the intervertebral disc by serving as a mechanical stabilizer as well as a pathway for nutrient transport. There is a very little known about CEP due in part to the lack of suitable imaging technique to evaluate the CEP. The purposes of this study were to optimize the parameters of zero echo time (ZTE) MRI in enhancing CEP structure and then to evaluate the morphology of CEP in lumbar spine with herniation of disc using ZTE-MRI.
Introduction
Herniation of intervertebral disc (IVD) is believed to be a common cause of spinal pathology and low back pain and it occurs when the annulus fibrosus are damaged and the nucleus pulposus to bulge and exert mechanical compression on the nerve1. However, its etiology is still unknown. The cartilage endplate (CEP) is a thin layer of hyaline cartilage located between the avascular IVD and bony vertebral endplate. It plays an important role in the function and homeostasis of the disc by serving as a mechanical stabilizer as well as a pathway for nutrient transport2. Endplate damage, which can start as site-specific focal breaks3, may inhibit the blood supply and passage of nutrients to the IVD and consequently lead to disc degeneration. An MR imaging method of directly assessing the structural change of CEP would be of considerable value for evaluation of early pathologic changes of the disc degeneration. Previously, standard clinical MR sequences such as T2/T1-weighted MRI has been used to characterize endplate damages and associated marrow changes. However, CEP with the short T2 value4 (< 3 ms) displays as hypointense signal in T2-weighted (T2W) images and is difficult to detect since conventional protocol acquires the signal with a minimum TE of 10 ms or greater. A recent developed zero-echo time (ZTE)5 utilizes hard pulse excitation followed by immediately 3D radial sampling to achieve nominal TE of zero and consequently could provide efficient sampling short T2* signals in cartilaginous endplate. The purposes of this study were to optimize ZTE parameters in enhancing CEP structure and then to evaluate the morphology of CEP in lumbar spine with herniation of disc using ZTE-MRI.Methods
All MRI acquisitions were performed on a 1.5 T clinical scanner (Optima MR450w, GE Healthcare, Milwaukee, USA) using anterior array and GEM posterior array coil as the signal detection and whole-body coil for radio-frequency excitation. The patients were placed in the supine position with a cushion under both knees for patient comfort and stabilization. Sagittal view of T2W fast spin-echo (FSE) images were acquired with a TR of 3900 ms, a TE of 100 ms, a FOV of 30 cm, a matrix of 352 × 224, and a slice thickness of 4 mm. ZTE data was acquired with the scanning parameters as follows: TR=1019 ms, nominal TE=0 ms, TI=500 ms, flip angle=5 degree, receiver bandwidth= 20.8 kHz, field-of-view= 30 cm, resolution interpolated to 1.0 × 1.0 × 1.5 mm, scan time= 5 min 15 s.Result and Discussion
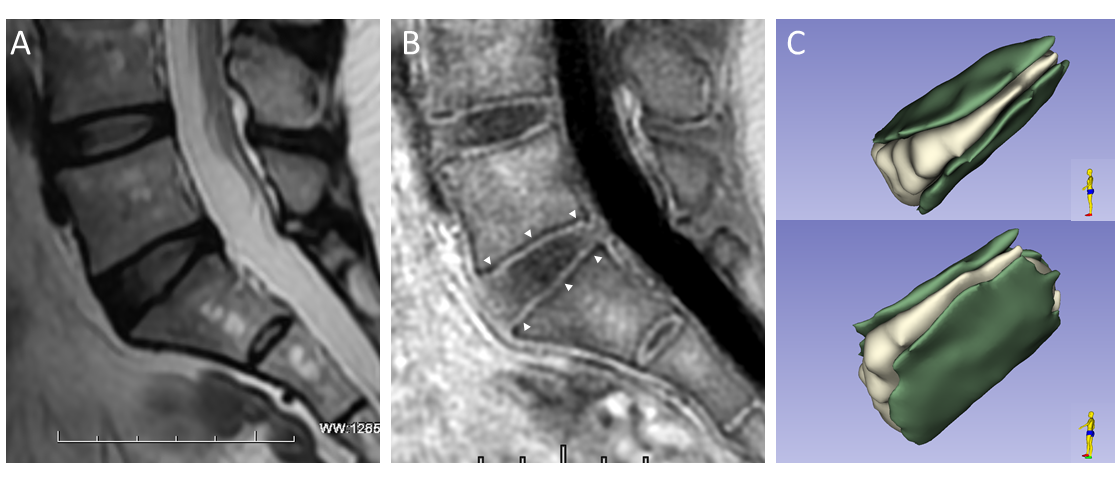
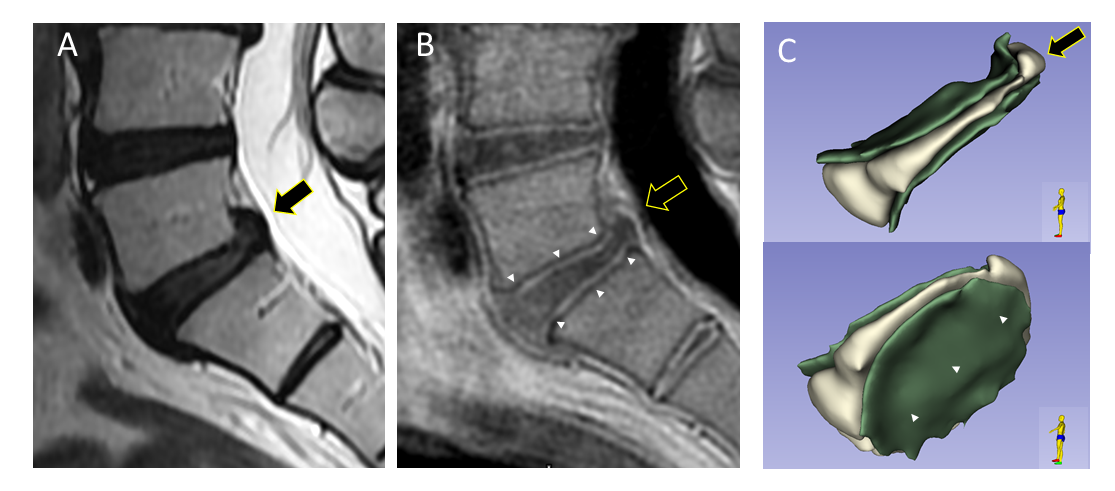
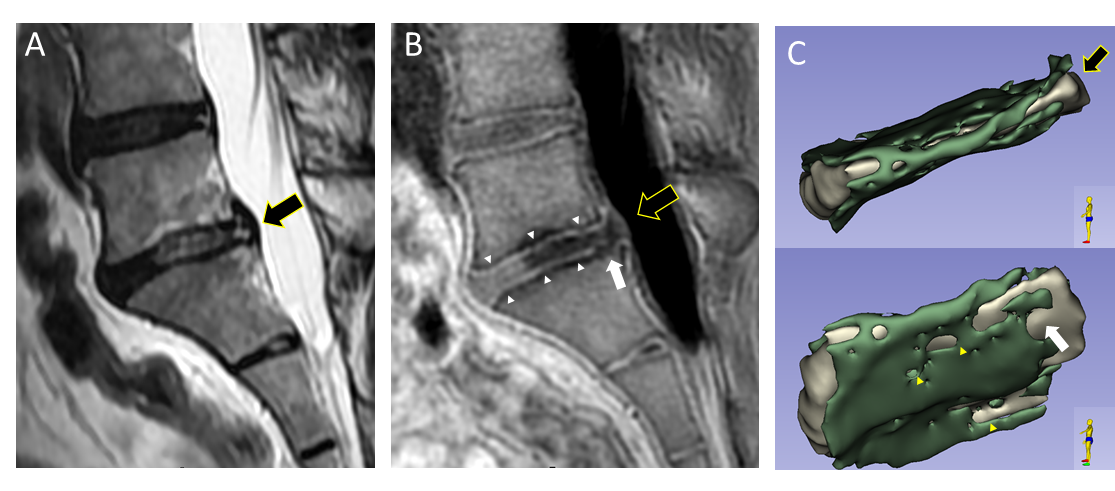
Conventional T2W images showed the great contrast in visualizing the anatomy of lumbar spine (Figs.1-3, A). A thin layer, CEP, exhibiting hypointense signal in T2W cannot be distinguished from the subchondral bone endplates, while a continuous, linear and high signal intensity (small white arrow) adjacent to hypointense vertebral endplates was observed at CEP region in ZTE-MRI in a volunteer (Fig. 1B) as well as in a patient received herniated intervertebral disc (HIVD) without CEP herniation (Fig. 2B). Three-dimensional CEP and intervertebral disc can then be segmented from surrounding tissues due to the excellent contrast between CEP and IVD (Figs. 1-3, C). Abnormal CEP thinning and absence of the signal intensity of ZTE (Fig. 3B) can be seen in a HIVD patient with CEP herniation and it maybe related to progressive resorption of the articular cartilage with replacement by subchondral bone which would result in thinning and disappearance of the CEP6 (Fig. 3B, 3C).Conclusion:
The preliminary result in this study demonstrates that ZTE-MRI enabled direct visualization of the CEP without further imaging process step such as image subtraction or intensity inversion so that generates a simple and reliable imaging method for evaluating CEP in HIVD patients. Further assessment of more patients with herniation of CEP to understand the relationship between the abnormality of CEP and disc degeneration is currently underway.Acknowledgements
No acknowledgement found.References
1. van Dieen, JH, et al., “Fractures of the lumbar vertebral endplate in the etiology of low back pain: a hypothesis on the causative role of spinal compression in a specific low back pain”. Med Hypotheses. 1999; 53(3):246–252.
2. Moore, RJ. “The vertebral end-plate: what do we know?” Eur Spine J. 2000; 9(2):92–96.
3. Raj, PP. “Intervertebral disc: anatomy-physiology pathophysiology treatment” Pain Pract 2008;8:18–44
4. Bae, WC, et al., “UTE MRI of the Osteochondral Junction” Current radiology reports. 2014; 2(2):35
5. Gibiino, F, et al., “Free-breathing, zero-TE MR lung imaging,” Magn Reson Matter Phy, 28:207–215, 2015
6. Chen, KC, et al., “Evaluation of the Disco-Vertebral Junction Using Ultrashort Time-to-Echo Magnetic Resonance Imaging: Inter-reader Agreement and Association with Vertebral Endplate Lesions” Skeletal Radiol. 45(9): 1249–1256, 2016
Figures