2822
Histogram analysis of T2* value for lumbar intervertebral disc degeneration1Tongji Hospital, Tongji Medical College, Huazhong University of Science and Technology, Wuhan, China, 2MR Research,GE Healthcare, Beijing, China
Synopsis
Low back pain (LBP) is a common spinal disease during the middle-to-old-aged population. Degeneration of lumbar intervertebral discs (IVDs) is recognized as the common and crucial cause of LBP. Histogram analysis is a recently popular method for assessing microstructural heterogeneity, however, its diagnostic performance in intervertebral disc degeneration hasn’t been proved. Histogram analysis on axial T2* mapping was applied to characterize degenerative degrees and heterogeneity of discs. All histogram parameters of T2* value were significantly related to Pfirrmann grading. Our study confirmed that the apparent “red zone” on T2* color maps was clearly related to degeneration.
Main text
IntroductionThe degeneration of lumbar intervertebral discs (IVDs) is recognized as the common and crucial cause of low back pain (LBP) among the middle to old-aged population. 1,2 The early IVD degeneration is mainly characterized by changes in biochemical substances, such as the water, collagen and proteoglycan molecule. Histogram analysis was used in the neoplastic diseases for assessing microstructural heterogeneity. 3 Compared to traditional measurements (mean and median), histogram analysis can display the distribution of measured values in the region of interest (ROI).4 The advantages of T2*mapping is to quantitatively assess changes of biochemical composition in relatively short scan time. Therefore, our research aims to evaluate the feasibility of histogram analysis on T2* mapping to detect and grade degenerative lumbar IVDs.
Methods
This study was approved by the institutional review board of Tongji Hospital. 200 lumbar IVDs of 40 healthy volunteers (26 women and 14 men, mean age was 31.25±10.26 years, range 23-56 years) were examined using standard sagittal T2-weighted sequence and axial T2* mapping protocol on a 3T MRI system (GE Discovery MR 750, GE Healthcare, Waukesha, WI, USA). All lumbar intervertebral discs (IVDs) were classified base on the Pfirrmann grade on sagittal T2-weighted images. 5 T2* value color maps and histograms were generated with FireVoxel software (Department of Radiology, New York University, New York, USA). The correlation between all histogram measurements(mean, standard deviation [StDev], median, 5th, 25th, 75th and 95th percentile [X5%, X25%, X75%, X95%], inhomogenity, entropy, skewness, kurtosis)and Pfirrmann grade as well as between the area ratio ( area of “red zone” on T2* color maps over cross-sectional area (CSA) of corresponding intervertebral disc) and Pfirrmann grade were calculated using SPSS 22.0 .
Results
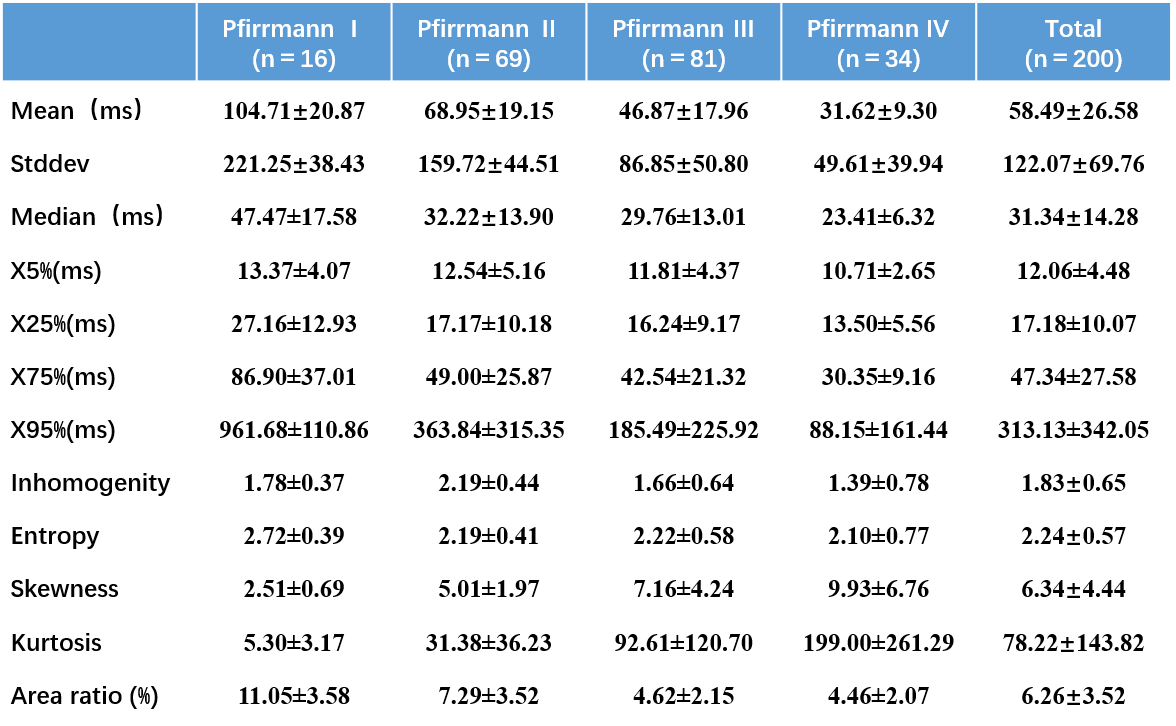
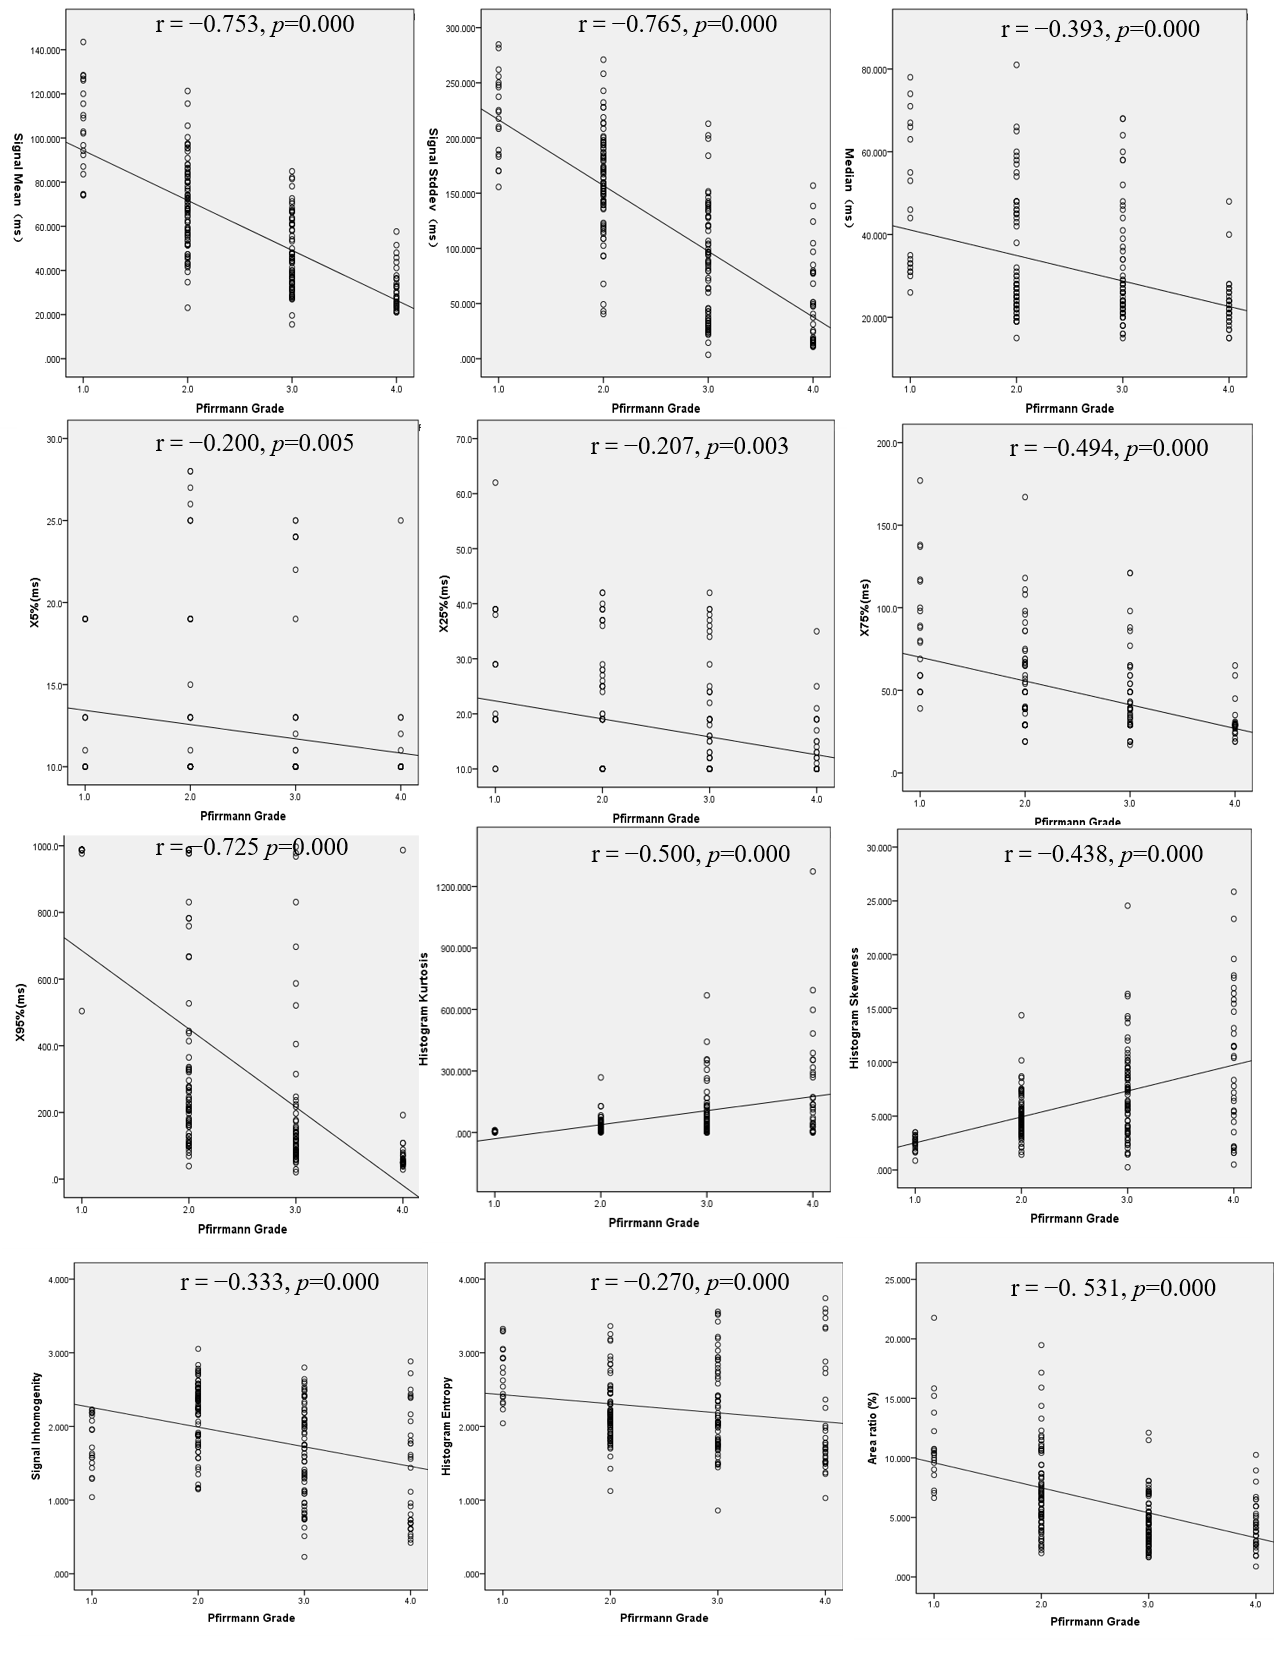
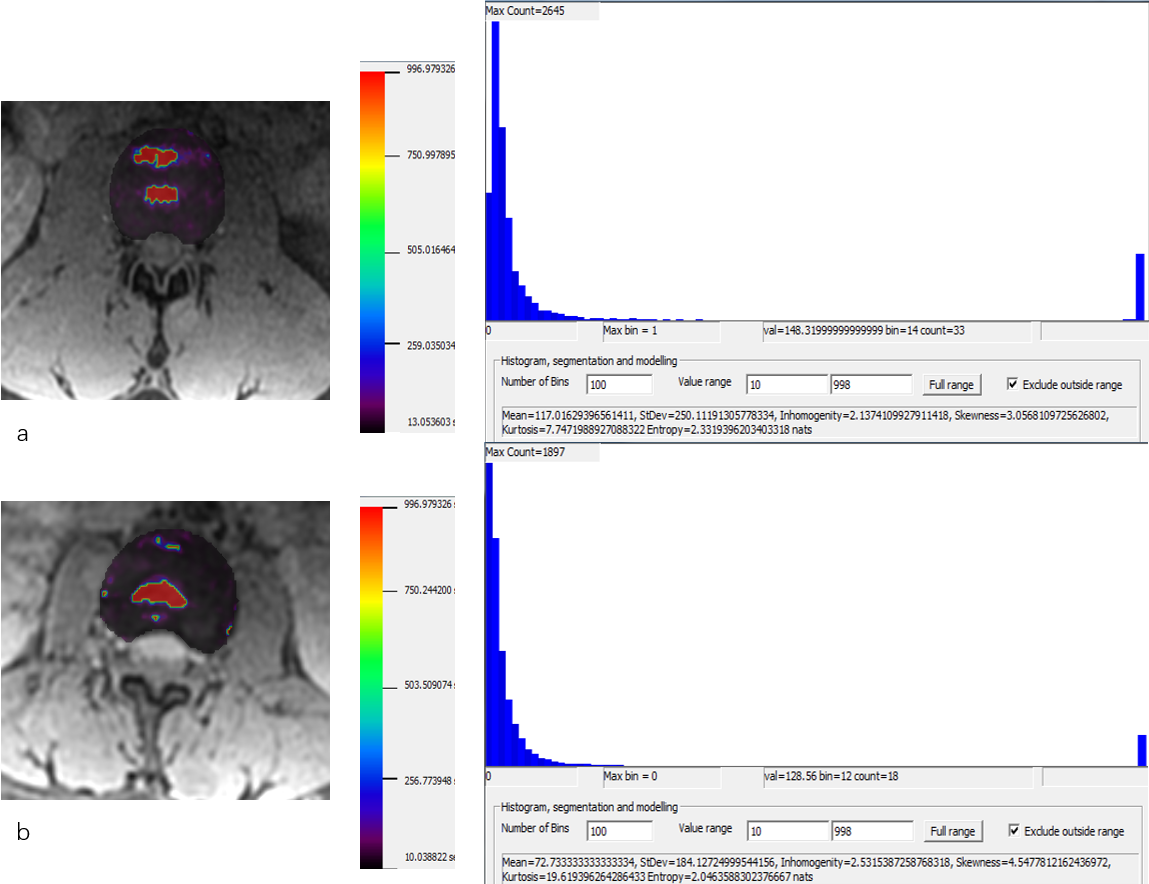
19 (9.5%), 79 (39.5%), 68 (34.0%) and 34 (17.0%) of 200 discs in total, according to Pfirrmann grading system 5, were classified as grade I, II, III, and IV, accordingly. All measurements were summarized in Figure 1. All histogram parameters was significant correlated with the Pfirrmann grade (P<0.01). Mean (r=−0.753), StDev (r=−0.765) and X95% (r=−0.725) were all highly negative correlated with Pfirrmann grade, shown in Figure 2; X75% (r=−0.494), skewness(r=0.438), and kurtosis(r=0.500) were intermediate correlation with Pfirrmann grade; weak correlations were found between Pfirrmann grade and X5%, X25%, median, inhomogeneity and entropy (r=−0.200,−0.207 , −0.393, −0.333 and −0.270) . As demonstrated in Fig. 3, there are bright “red zone” in IVDs in T2* maps, which have extremely high T2* value. The T2* values of the bright “red zone” displayed as a group separated from others in ROIs in each histogram. The average area ratios of each “red zone” over the corresponding IVD was 6.26%±3.52 and ranged from 0.877% to 21.768%. The area ratio of the “red zones” were intermediately related to Pfirrmann grade(r=−0.531,P<0.01).
Discussion
The histogram analysis of the axial T2* mapping quantitatively characterized both degeneration levels and heterogeneity of biochemical microstructure of IVDs. This analysis technique provided more than two parameters (mean and median) to assess microstructure changes than traditional measurements . All histogram parameters of T2* value were significantly correlated to the Pfirrmann grade. Mean , StDev and 95th percentile were highly negative correlated with Pfirrmann grade and were all statistically different between adjacent Pfirrmann grades, indicating that histogram parameters could be used to quantitatively characteriz degeneration levels. However entropy and inhomogeneity didn’t show clear tendency with Pfirrmann grade, this might be attributed to the variability and uncertainty of microstructure changes, that is, the metamorphic order and degree of water, collagen and proteoglycan molecule might be different during each stage of degeneration. StDev obviously declined as Pfirrmann grade increased, indicating that the T2* values varies with degeneration within a small range. This might reflect type Ⅰ collagen mainly dominates the type and density of biochemical molecules in the late stage of degeneration. 6 Both kurtosis and skewness positively increased with Pfirrmann grade; however, the meaning remains to be further explored.
Two major peaks of the T2* values in the bright “red zone and the rest of ROIs indicated that each “red zone” might represent the degeneration levels. Each “red zone” area of the CSA significantly smaller than each NP might explain that the “red zone” as a “Nutrition pool” is composed of the dense collagen fiber surrounding by mucopolysaccharide protein complex. This microstructure enriches IVDs with water to physiologically function; however, it gradually degrades with the daily consumption. The finding of the “red zone” of IVDs might be an anatomical breakthrough in degeneration.
Conclusion
Histogram analysis of T2* values is an effective tool for the detection of degeneration and the assessment of regional biomechanical composition of the IVDs. The finding of the “red zone” in our study may provide a new breakthrough for the study of degeneration initiation, and provide a new idea for the anatomical and histological studies of the intervertebral disc in the future.
Acknowledgements
I want to appreciate my tutor----Li Xiaoming, she gives me many academic and constructive advices.References
1. Hansen BB, Hansen P, Nordberg CL, Boesen M. Imaging of the spine in cases of low back pain. Ugeskrift for laeger 2018;180(16).
2. Hoppe S, Quirbach S, Mamisch TC, Krause FG, Werlen S, Benneker LM. Axial T2 mapping in intervertebral discs: a new technique for assessment of intervertebral disc degeneration. European radiology 2012;22(9):2013-2019. doi: 10.1007/s00330-012-2448-8
3. Waldenberg C, Hebelka H, Brisby H, Lagerstrand KM. MRI histogram analysis enables objective and continuous classification of intervertebral disc degeneration. European spine journal : official publication of the European Spine Society, the European Spinal Deformity Society, and the European Section of the Cervical Spine Research Society 2018;27(5):1042-1048. doi: 10.1007/s00586-017-5264-7
4. Young Jun Choi M, Jeong Hyun Lee M, PhD, Hye Ok Kim M, Dae Yoon Kim M, Ra Gyoung Yoon M, So Hyun Cho M, Myeong Ju Koh M, Namkug Kim P, Sang Yoon Kim M, PhD, Jung Hwan Baek M, PhD. Histogram analysis of apparent diffusion coefficients for Occult Tonsil cancer in Patients with cervical nodal Metastasis from an Unknown Primary site at Presentation. 2015.
5. Pfirrmann CW, Metzdorf A, Zanetti M, Hodler J, Boos N. Magnetic resonance classification of lumbar intervertebral disc degeneration. Spine 2001;26(17):1873-1878. doi: 10.1097/00007632-200109010-00011
6. Ahsan R, Tajima N, Chosa E, Sugamata M, Sumida M, Hamada M. Biochemical and morphological changes in herniated human intervertebral disc. Journal of orthopaedic science : official journal of the Japanese Orthopaedic Association 2001;6(6):510-518. doi: 10.1007/s007760100006
Figures