2821
Resolving the Complex Fiber Structures in Knee Joint Using High Resolution Diffusion Imaging1Department of Radiology, Duke University, Durham, NC, United States, 2Department of Orthopaedic Surgery, Duke University, Durham, NC, United States
Synopsis
Using high-order diffusion tractography to map the complex collagen fibril structures in knee joint is still challenging, due to the limited spatial resolution, low angular resolution, and low signal-to-noise (SNR). The complex fiber distributions in different connective tissues in knee joint were investigated using high resolution diffusion imaging.
Purpose
To evaluate the complex fiber orientations and three-dimensional collagen fiber network of knee joint connective tissues, including ligaments, muscle, articular cartilage, and meniscus using high spatial and angular resolution diffusion imaging.Introduction
DTI tractography has been used to detect the integrity of individual connective tissues, such as Achilles tendon, growth plate, and anterior cruciate ligament (ACL) graft in clinical scanners1,2. Tractography of the articular cartilage in rat knee joint has also been reported with DTI at microscopic resolution3. However, a significant limitation of DTI is that it can only resolve the single fiber direction within each voxel and fails to accurately represent the complex architecture of crossing fibers4.Methods
All animal preparation protocols were approved by the local institutional animal care and use committee. Two knee joints were harvested shortly after sacrifice from two mature, healthy rats. The specimens were scanned at 9.4 T Oxford 8.9-cm vertical bore magnet. A modified 3D Stejskal-Tanner diffusion-weighted spin-echo pulse sequence was used with compressed sensing at 4 times reduction along the phase dimensions. A single-shell scan protocol was used in the current study: matrix size = 400 × 256 × 256, FOV = 18 × 11.52 × 11.52 mm3, 45 µm isotropic spatial resolution, TE = 9.1 ms, TR = 100 ms, 147 unique diffusion directions with b value of 1000 s/mm2 and 15 non-diffusion-weighted (b0) measurements. The scan time was about 73.4 hours. The gradient separation time was 4.6 ms and the diffusion gradient duration time was 2.5 ms. The construction of the under sampled k-space data has been reported previously5. The DTI model was used to characterize the primary diffusion direction of the fiber in different connective tissues of knee. The scalar indices including fractional anisotropy (FA), mean diffusivity (MD), axial diffusivity (AD), and radial diffusivity (RD) were also calculated. The GQI method was used to quantify the diffusing water at different orientations6.Results
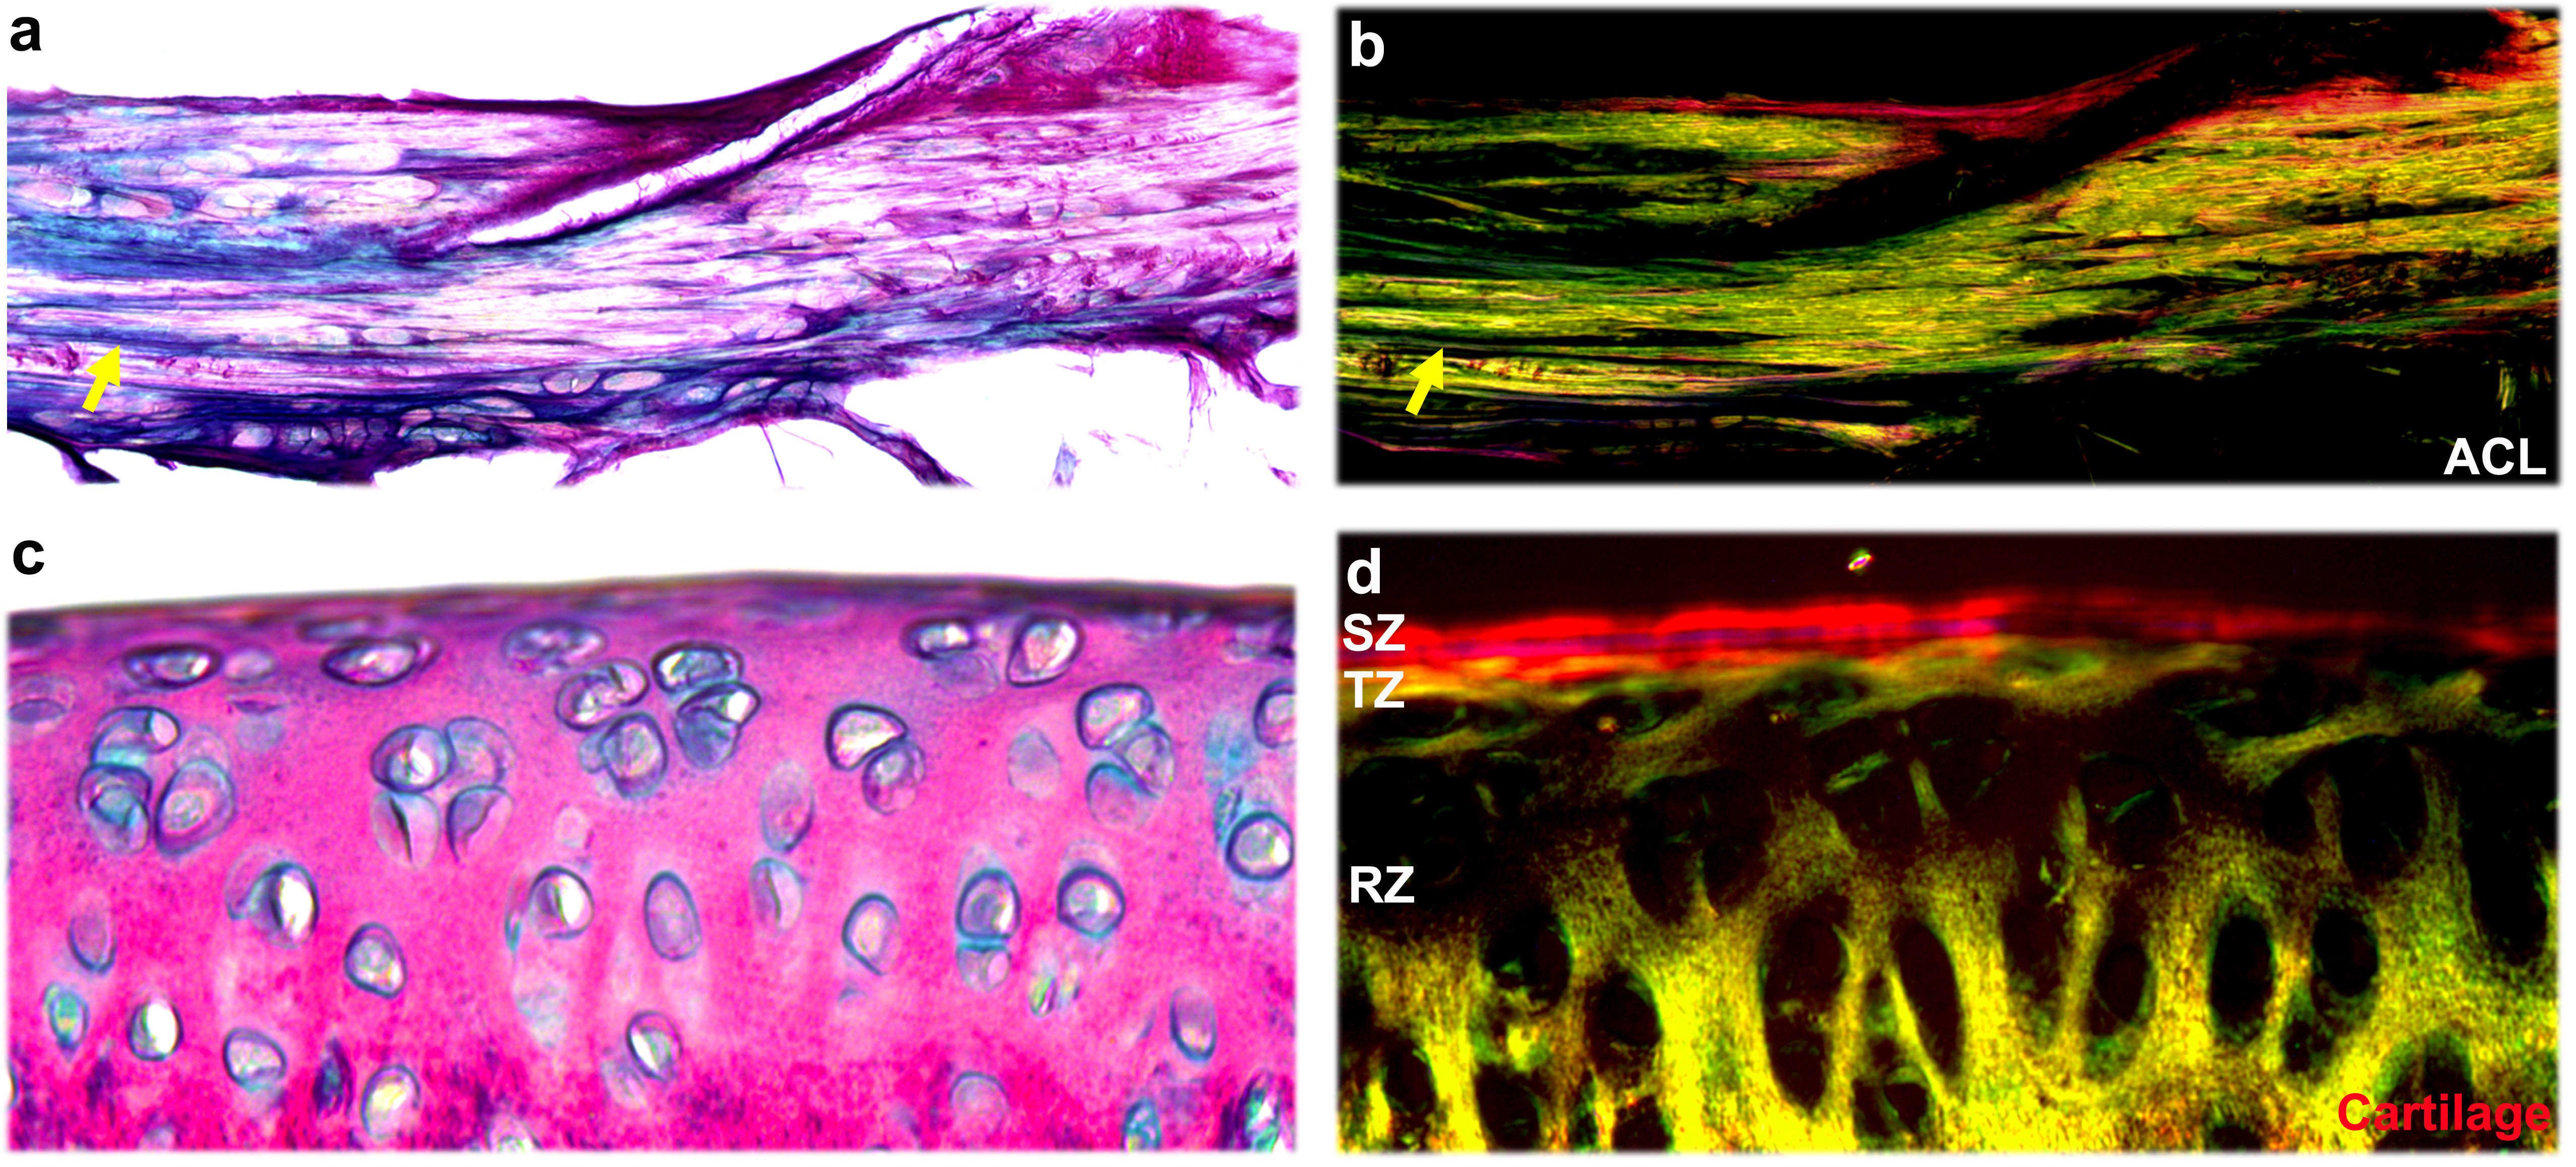
Figure 1 illustrates the representative DTI metrics (a-d) images, b0 image (f), and GQI metrics (e, g, h) images at both high spatial and angular resolution. The image intensity variations of different connective tissues are apparent in the b0 image (f), where posterior cruciate ligament (PCL) exhibits lower signal intensity than muscle, growth plate, and cartilage (white arrows, f). Compared to PCL (green arrow, a), the FA values are lower in muscle, growth plate, and articular cartilage (red arrows, a). In contrast, the MD values are higher in muscle, growth plate, and articular cartilage (red arrows, b) than PCL (green arrow, b). Figure 2 shows the FA, MD, and SNR of different connective tissues, including cartilage, meniscus, ACL, PCL, and muscle. These values are derived from the ROIs delineated in the b0 images (a-e) by different colors. The meniscus and ligaments have higher FA values than muscle and cartilage, while muscle and cartilage show higher MD values than meniscus and ligaments. Figure 3 shows the DWI images (a, f), fiber orientation images (b-c, g-h), and the corresponding tractography results (d-e, i-j) of ACL and muscle. The fiber orientations derived from GQI and DTI are visually consistent in both ACL and muscle, where few crossing fibers can be observed. Figure 4 depicts the DWI images (a, f), fiber orientation images (b-c, g-h), and the corresponding tractography results (d-e, i-j) of meniscus and articular cartilage. Compared to DTI, there are numerous crossing fibers existing in meniscus using GQI (b). Crossing fibers are also explicit in SZ and TZ of articular cartilage by GQI (g), but minimal in RZ. The tractography in articular cartilage by GQI also demonstrates more intact tracts than DTI (yellow arrows, i-j), which is similar to the tractography results found in meniscus. Figure 5 illustrates the Alcian blue/Picrosirius red stain (a, c) and PLM images (b, d) of ACL and articular cartilage. The collagen fiber orientation in ACL is relatively uniform, which is consistent with tractography findings. The orthogonal collagen fiber orientations are found between the SZ and RZ in cartilage, which agrees with the previous tractography results.Discussion
The tractography results were comparable between DTI model and GQI method in ligament and muscle. However, the tractography exhibited apparent difference between DTI and GQI in connective tissues with more complex collagen fibers network, such as cartilage and meniscus. This study demonstrated that high spatial and angular resolution diffusion imaging with the GQI model can nondestructively characterize the complex collagen fiber orientations and architectures of articular cartilage and meniscus at microscopic resolution.Conclusion
High resolution diffusion imaging with GQI method can trace the complex collagen fiber orientations and architectures of the knee joint at microscopic resolution, which can be valuable in models being developed to understand the complex biomechanics of knee.Acknowledgements
This work was supported by the NIH/NIBIB P41 EB015897, NIH 1S10OD010683-01, NIH 1R01NS096720-01A1, 5R01AR063071-07, and Charles E. Putman MD Vision Award of the Department of Radiology, Duke University School of Medicine.References
1. Bedoya MA, Delgado J, Berman JI, Chauvin NA, Zurakowski D, Ramirez-Grueso R, Ntoulia A, Jaramillo D. Diffusion-Tensor Imaging of the Physes: A Possible Biomarker for Skeletal Growth-Experience with 151 Children. Radiology 2017;284(1):210-218.
2. Wengler K, Tank D, Fukuda T, Paci JM, Huang M, Schweitzer ME, He X. Diffusion tensor imaging of human Achilles tendon by stimulated echo readout-segmented EPI (ste-RS-EPI). Magn Reson Med 2018;80(6):2464-2474.
3. Wang N, Mirando AJ, Cofer G, Qi Y, Hilton MJ, Johnson GA. Diffusion tractography of the rat knee at microscopic resolution. Magnetic resonance in medicine 2019;81(6):3775-3786.
4. Raya JG. Techniques and applications of in vivo diffusion imaging of articular cartilage. J Magn Reson Imaging 2015;41(6):1487-1504.
5. Wang N, Badar F, Xia Y. Compressed sensing in quantitative determination of GAG concentration in cartilage by microscopic MRI. Magn Reson Med 2018;79(6):3163-3171.
6. Yeh FC, Wedeen VJ, Tseng WY. Generalized q-sampling imaging. IEEE Trans Med Imaging 2010;29(9):1626-1635.
Figures