2820
T1ρ imaging in 7T: evaluation of high dielectric pad for SAR reduction1Biomedical Engineering, Cleveland Clinic, Cleveland, OH, United States, 2Program of Advanced Musculoskeletal Imaging (PAMI), Cleveland Clinic, Cleveland, OH, United States, 3Department of Diagnostic Radiology, Cleveland Clinic, Cleveland, OH, United States
Synopsis
To fully utilize the superior signal-to-noise ratio of 7T MRI for cartilage T1ρ imaging, high specific-absorption ratio (SAR) needs to be accounted for. Previous researches showed the use of high dielectric pad could substantially decrease the SAR in 7T MRI. In this work, the effect of the use of high dielectric pad on T1ρ imaging in terms of SAR level and T1ρ relaxation time quantification.
Purpose
With FDA approval of clinical usage of 7T MRI, which has superior signal-to-noise ratio (SNR) compared to 3T, there is an increasing interest in investigating the clinical value of this ultra-high field MRI. A study showed that cartilage lesions of osteoarthritis (OA) patients could be better differentiated from the healthy control with T1ρ imaging in 7T MRI.(1) However, high specific-absorption ratio (SAR) is a critical challenge for T1ρ imaging in 7T due to the use of long spin locking pulse.(2) It was suggested that a substantial decrease of SAR could be achieved with the use of high dielectric materials in the expense of increased B0 field inhomogeneity.(3, 4) In this study, the effect of the use of dielectric pad was evaluated in terms of SAR level and T1ρ relaxation time quantification in the knee.Methods
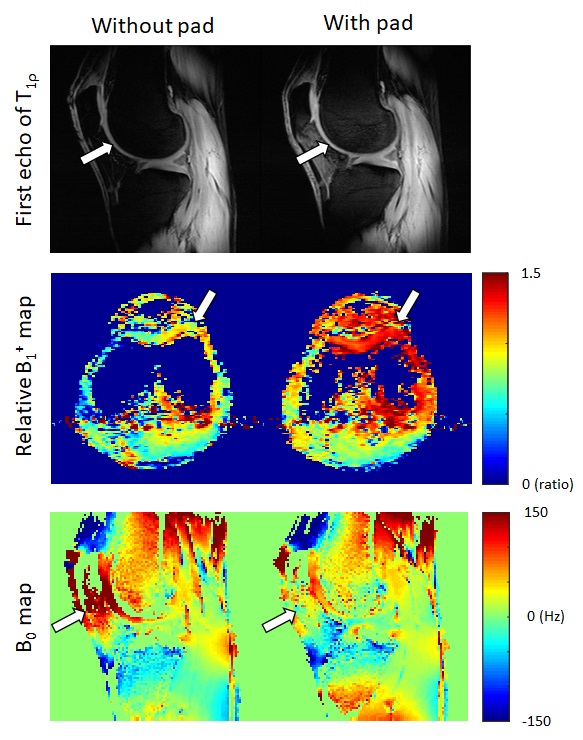
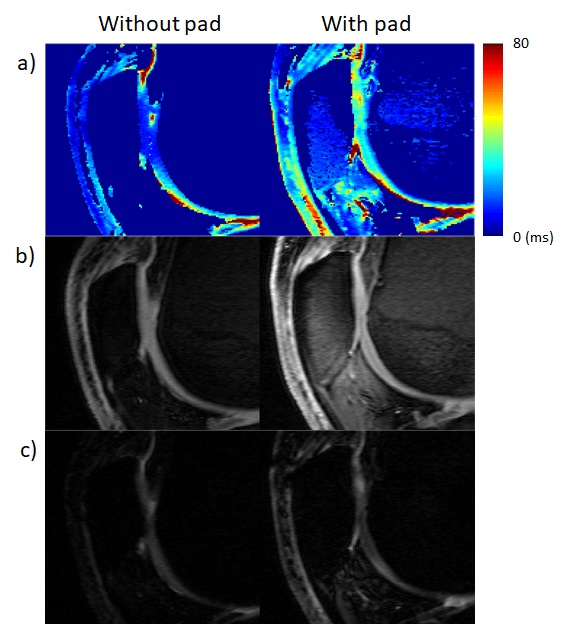
Three healthy volunteers were scanned at 7T MR scanner (Siemens Healthcare AG, Erlangen, Germany) with QED 1Tx/28Rx knee coil without and with the dielectric pad. Two pads were placed around the patella bone to increase the transmit field efficiency around the cartilage area. Two dielectric pads with size 13x14x1cm3 (Multiwave Technologies, Geneva, Switzerland) designed for brain imaging were used for the study. 3D T1ρ imaging based on magnetization-prepared angle-modulated partitioned k-space spoiled gradient echo snapshots (MAPSS) with RF cycling and variable flip angles was implemented for T1ρ quantification.(5, 6) T1 recovery time for 3D MAPSS was adjusted so that the SAR limit on the scan with longest spin lock pulse was not exceeded. Double echo gradient echo imaging with 1ms echo time difference was used to map B0 inhomogeneity, and B1 mapping with Bloch-Siegert shift was implemented to calculate B1+ map.(7) Same imaging parameters were used for scans without and with the dielectric pad. Detailed parameters are listed in Table 1.Different strategy was utilized when administering the region of interest for B0 shimming and B1 reference voltage estimation. When scanning with the pad, a region of interest (ROI) smaller than the imaging volume which covers the cartilage region tightly was selected to overcome the increased B0 inhomogeneity with the use of dielectric pad. However, this strategy could not be used when scanning without the pad since this increased the reference voltage too high. Instead, the whole knee was selected as the ROI. During this procedure, the reference voltage and full width at half maximum (FWHM) of the water peak were recorded. For T1ρ quantification, two-parameter mono-exponential fitting was performed. In this study, we focused on patellar and trochlea cartilage, which were mostly affected by using dielectric pads which were placed on top of patella. The cartilage were segmented by semi-automatic segmentation on the first echo of T1ρ weighted image.
Results
From all scans, reference voltage decreased with the use of dielectric pads (Table 2), resulting in SAR decrease ranging from 14% to 50%. This trend is also visible through the acquired signal intensity and B1 map (Figure 1). The FWHM of the water peak increased with the use of dielectric pads (Table 2), but the use of focused ROI on cartilage region resulted in better inhomogeneity map in that region (Figure 1).The effect of better B1 efficiency and B0 inhomogeneity were also reflected in the T1ρ measures (Figure 2, Table 3). The T1ρ values increased to reasonable values with the use of dielectric pads. However, the B1 inhomogeneity still remained, showing low value from trochlear cartilage in volunteer #2 even with the dielectric pads (Table 3).
Discussion
The use of dielectric pad showed its value in 7T MRI by decreasing the SAR for all scans. Since the T1ρ scan time was limited by the SAR limitation, the decrease in SAR could be directly translated to decrease in scan time with the same ratio. Even though the use of the dielectric pad resulted in higher FWHM, combined with localized shimming strategy, we were able to decrease the B0 inhomogeneity while decreasing SAR for the cartilage ROIs. The effect could be verified also in the T1ρ map with recovered T1ρ values of compartments near the dielectric pads. However, the B1 inhomogeneity still existed some experiments and hard to reproduce, meaning that the current experiment setup is unstable and sub-optimal. Several factors need to be addressed for optimal setup of dielectric pad for both homogeneous B1 and increased B1 efficiency. First, the permittivity of the pad needs to be optimized for knee. The pad used for this study was manufactured for brain imaging, and a study showed that the optimal permittivity for knee and brain was different.(8) Also, the placement of the dielectric pad needs to be determined. For brain imaging, air cavities in the head are known to disturb field homogeneity, allowing them to use as landmarks for placement of dielectric pad. For future work, careful investigation on the permittivity value and placement of the dielectric pad for knee imaging is warrant.Conclusion
A considerable amount of SAR was reduced with the use of dielectric pad for 7T T1ρ imaging. Further investigation on the optimal setup of the dielectric pad needs to be analyzed.Acknowledgements
No acknowledgement found.References
1. Wyatt C, Guha A, Venkatachari A, Li X, Krug R, Kelley DE, et al. Improved differentiation between knees with cartilage lesions and controls using 7T relaxation time mapping. Journal of orthopaedic translation. 2015;3(4):197-204
2. Singh A, Haris M, Cai K, Kogan F, Hariharan H, Reddy R. High resolution T1rho mapping of in vivo human knee cartilage at 7T. PloS one. 2014
3. Brink WM, Webb AG. High permittivity pads reduce specific absorption rate, improve B1 homogeneity, and increase contrast-to-noise ratio for functional cardiac MRI at 3 T. Magnetic resonance in medicine. 2014;71(4):1632-40.
4. Teeuwisse WM, Brink WM, Webb AG. Quantitative assessment of the effects of high-permittivity pads in 7 Tesla MRI of the brain. Magnetic resonance in medicine. 2012;67(5):1285-93.
5. Li X, Han ET, Busse RF, Majumdar S. In vivo T(1rho) mapping in cartilage using 3D magnetization-prepared angle-modulated partitioned k-space spoiled gradient echo snapshots (3D MAPSS). Magnetic resonance in medicine. 2008;59(2):298-307.
6. Li X, Pedoia V, Kumar D, Rivoire J, Wyatt C, Lansdown D, et al. Cartilage T1rho and T2 relaxation times: longitudinal reproducibility and variations using different coils, MR systems and sites. Osteoarthritis and cartilage. 2015;23(12):2214-23. Epub 2015/07/19.
7. Sacolick LI, Wiesinger F, Hancu I, Vogel MW. B1 mapping by Bloch-Siegert shift. Magnetic resonance in medicine. 2010;63(5):1315-22
8. Fagan AJ, Welker KM, Amrami KK, Frick MA, Watson RE, Kollasch P, et al. Image Artifact Management for Clinical Magnetic Resonance Imaging on a 7 T Scanner Using Single-Channel Radiofrequency Transmit Mode. Investigative radiology. 2019.
Figures