2819
Effect of room temperature storage on relaxation properties of ex vivo articular cartilage1Department of Applied Physics, University of Eastern Finland, Kuopio, Finland, 2Research Unit of Medical Imaging, Physics and Technology, University of Oulu, Oulu, Finland
Synopsis
Typical measurement protocols for quantitative MRI of ex vivo osteochondral samples may last hours when multiple parameters with high resolution are measured. However, knowledge about the changes in the relaxation properties of articular cartilage during long scans is inadequate. In this study, we measured T1, adiabatic T1rho and T2-relaxation times for two osteochondral samples directly after sample preparation and repeated the measurements after 15 hours of storage at room temperature. T1-relaxation time decreased noticeably at later timepoint while adiabatic T1rho and T2-relaxation times remained the same. Due to small sample size, statistical significance of the results could not be verified.
Introduction
Effects of sample cryopreservation or cold storage on cartilage relaxation properties have been studied earlier1-4. However, since pre-clinical MRI studies using osteochondral samples may last hours, information about how sample properties (e.g. relaxation times) behave during long MRI scans at room temperature is required. To obtain an insight about the possible effects due to lengthy scanning protocols, we measured T1, adiabatic T1rho and T2-relaxation times in bovine articular cartilage directly after sample preparation and repeated the measurement after the samples had remained immersed in signal-free perfluoropolyether at room temperature for 15 hours.Methods
An entire mature bovine knee joint was acquired from a local hypermarket and two osteochondral samples (diameter ~6mm) were prepared from its patella. The joint capsule of the knee was intact, eliminating the possibility of significant cartilage dehydration prior the sample preparation. The knee joint had been stored at the originating abattoir shop and the hypermarket at low temperature (approximately +4°C) for few days prior to the sample preparation (exact details were not available). After the preparation, the samples were first immersed in phosphate buffered saline (PBS) and transported to the magnet, where samples were removed from PBS and immersed in signal free perfluoropolyether. The MRI was performed using a small-bore 9.4T Varian MRI scanner and a 19-mm diameter quadrature radiofrequency volume transceiver. Field-of-view of 17x17 mm, slice thickness of 1 mm and in-plane resolution of 256x128 pixels were utilized in the imaging. Magnetization prepared fast spin echo readout was used to acquire data for relaxation time mapping (TR = 5 s, ESP = 5.5 ms, ETL = 8). T1-relaxation was measured using inversion recovery preparation (TI = 0.2, 0.5, 0.8, 1.1, 1.4 and 3 s), T2 using spin echo preparation (TE = 10, 20, 40, 80, 100 and 128 ms) and adiabatic T1rho with HS1 pulses (τp = 4.5 ms, and γB1max/2π = 2.5). The relaxation time maps were calculated by pixelwise fitting on the appropriate MR-images. From the relaxation time maps, depth wise profiles from 1 mm thick ROIs were gathered for further analysis.Results
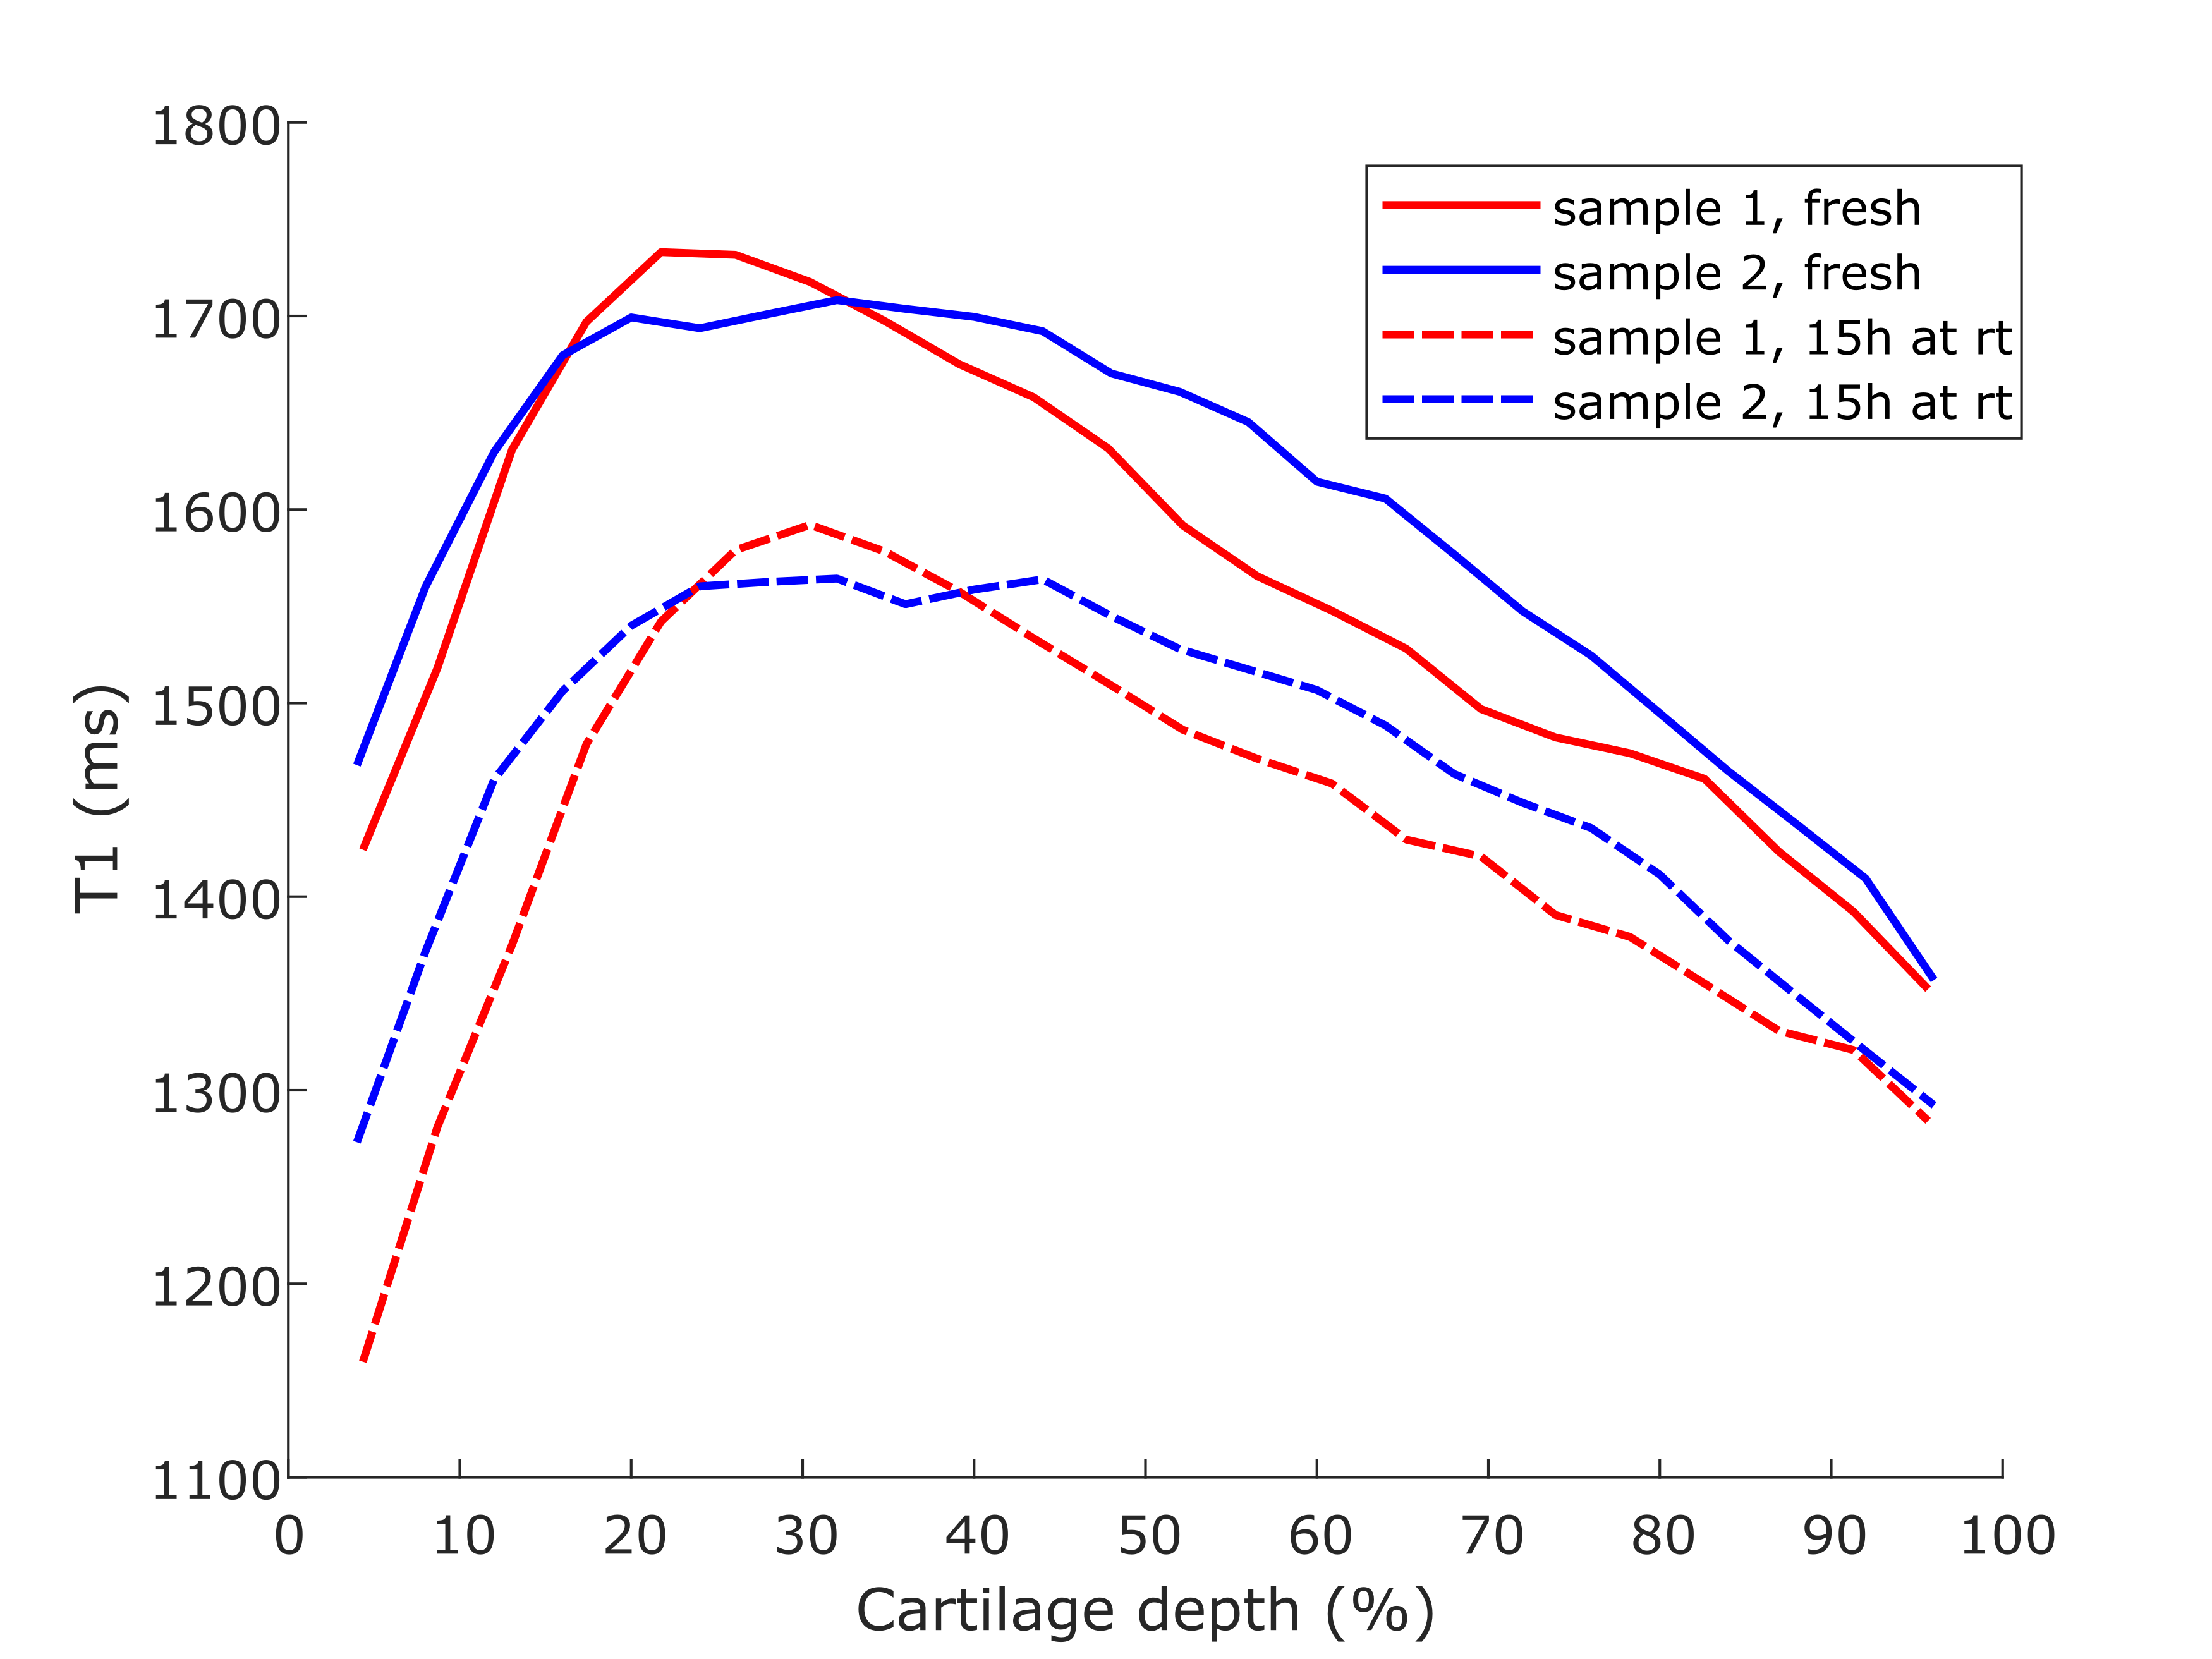
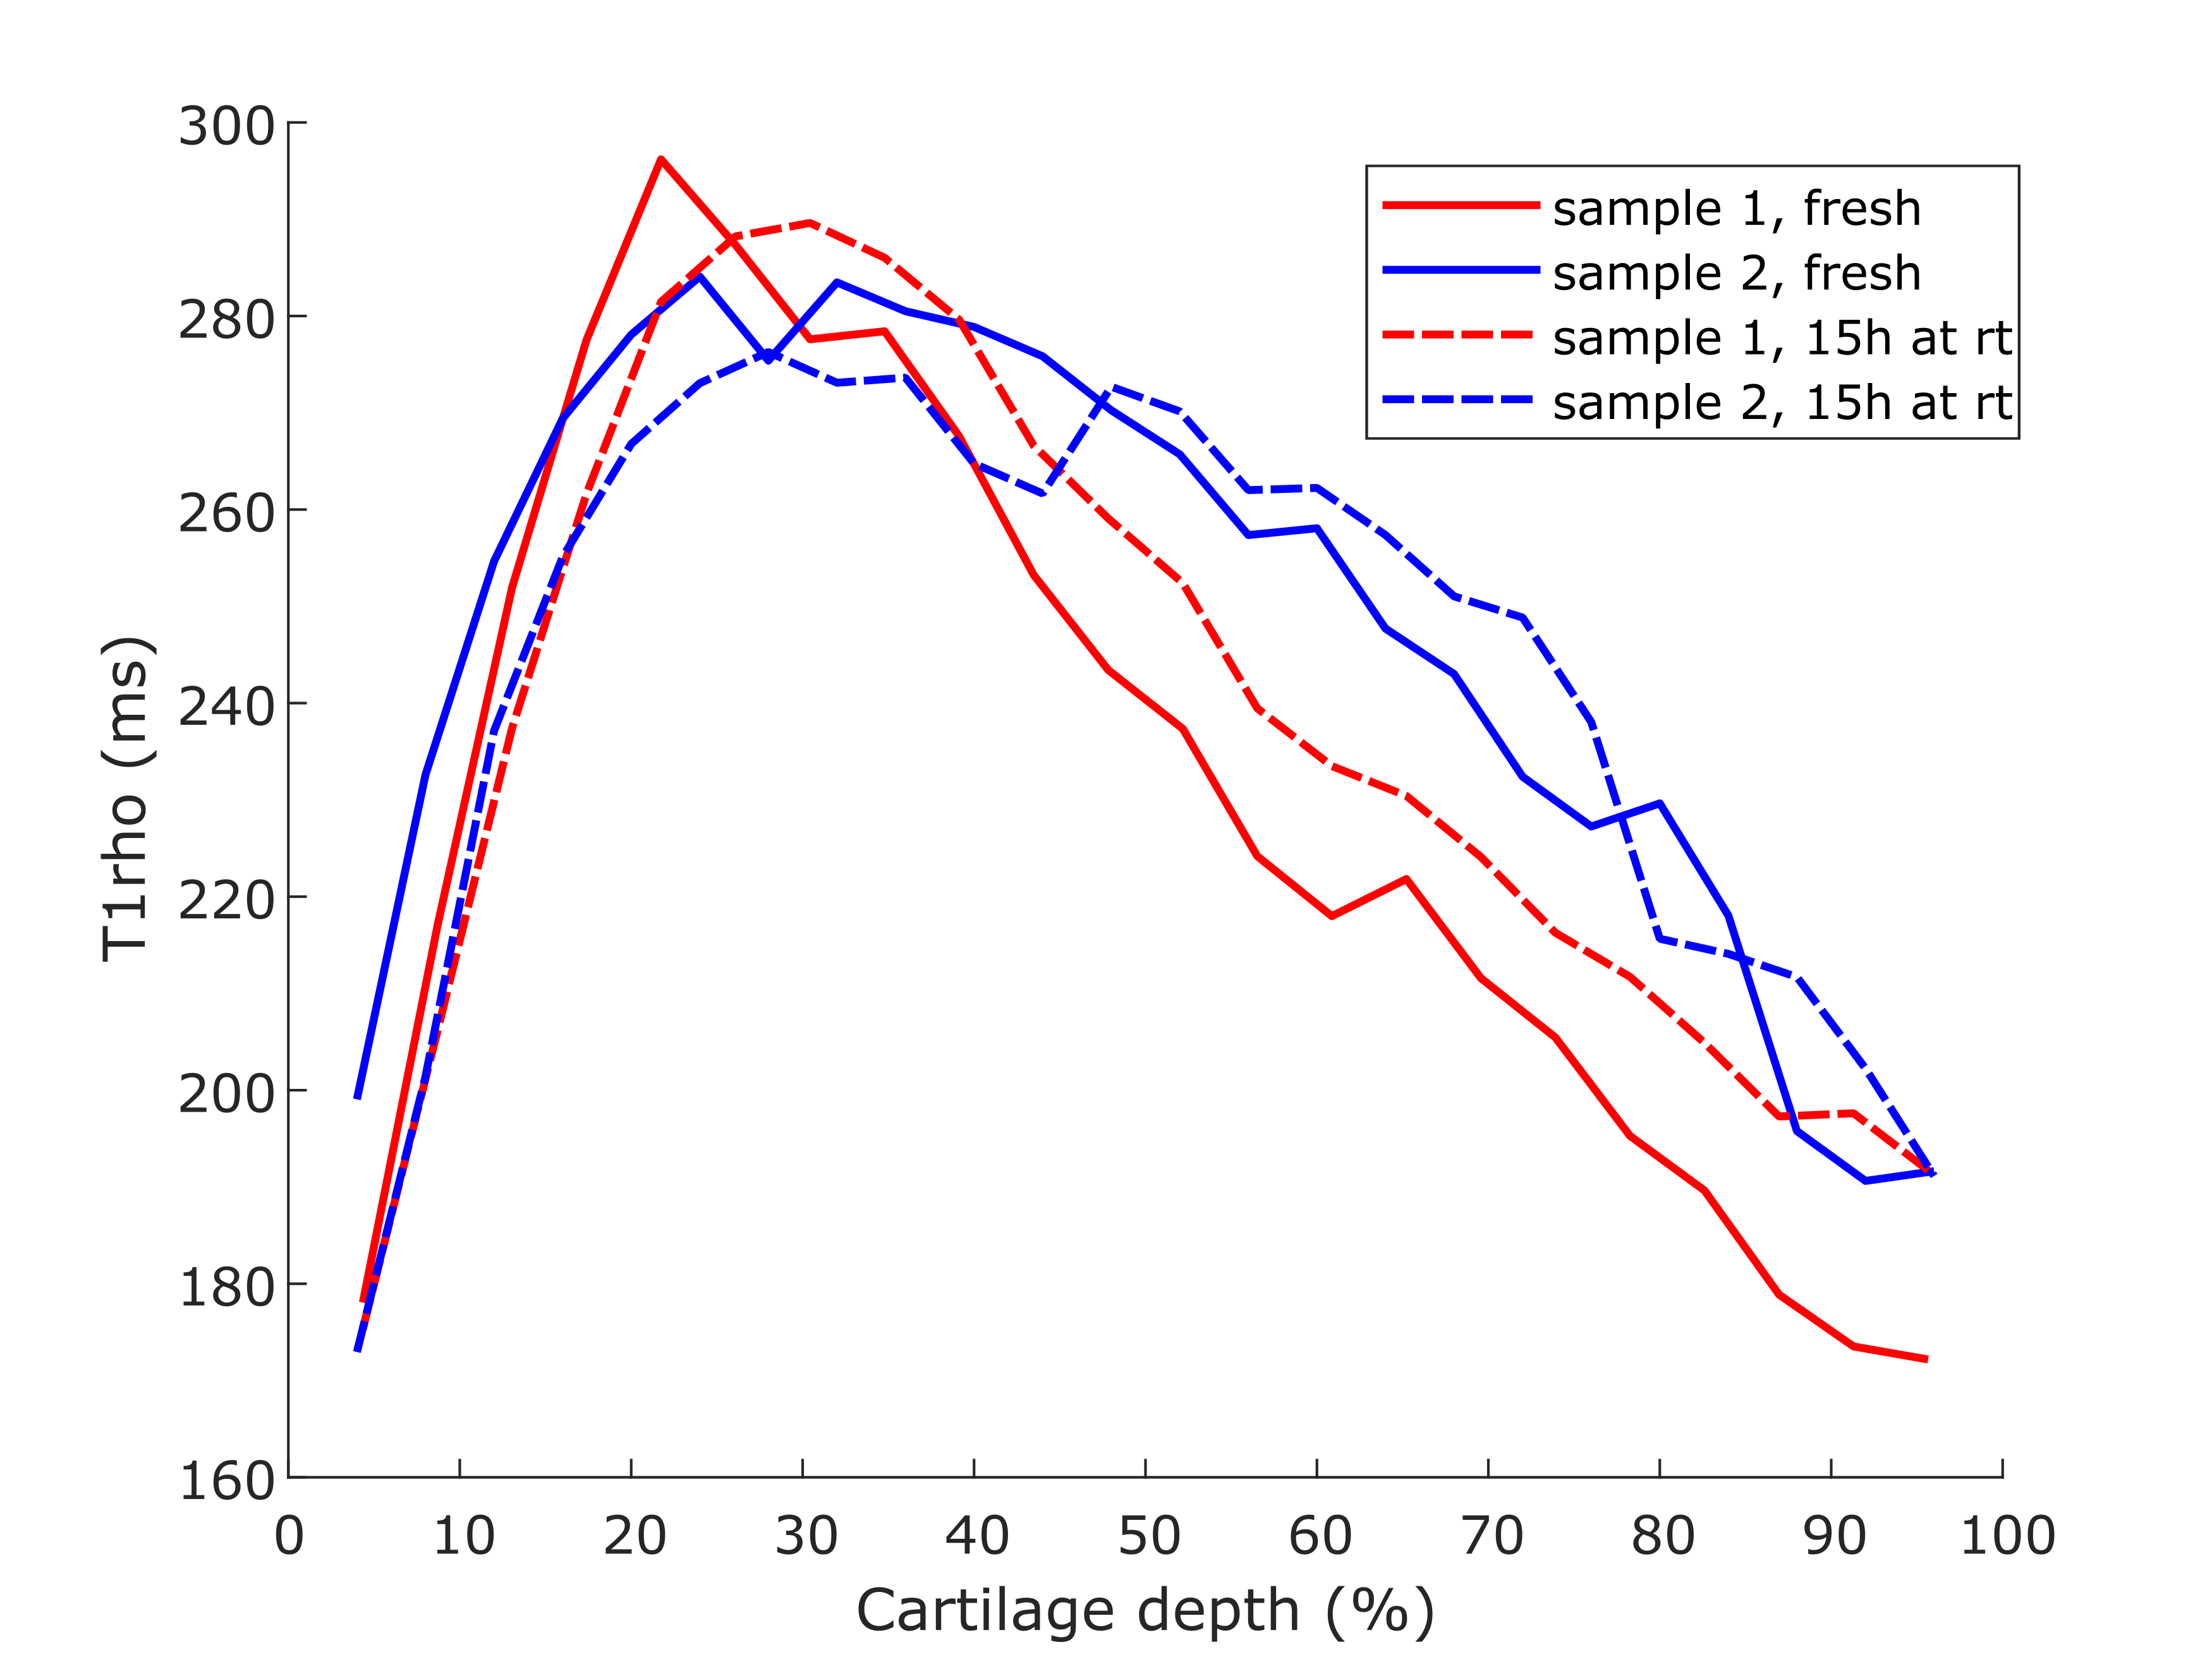
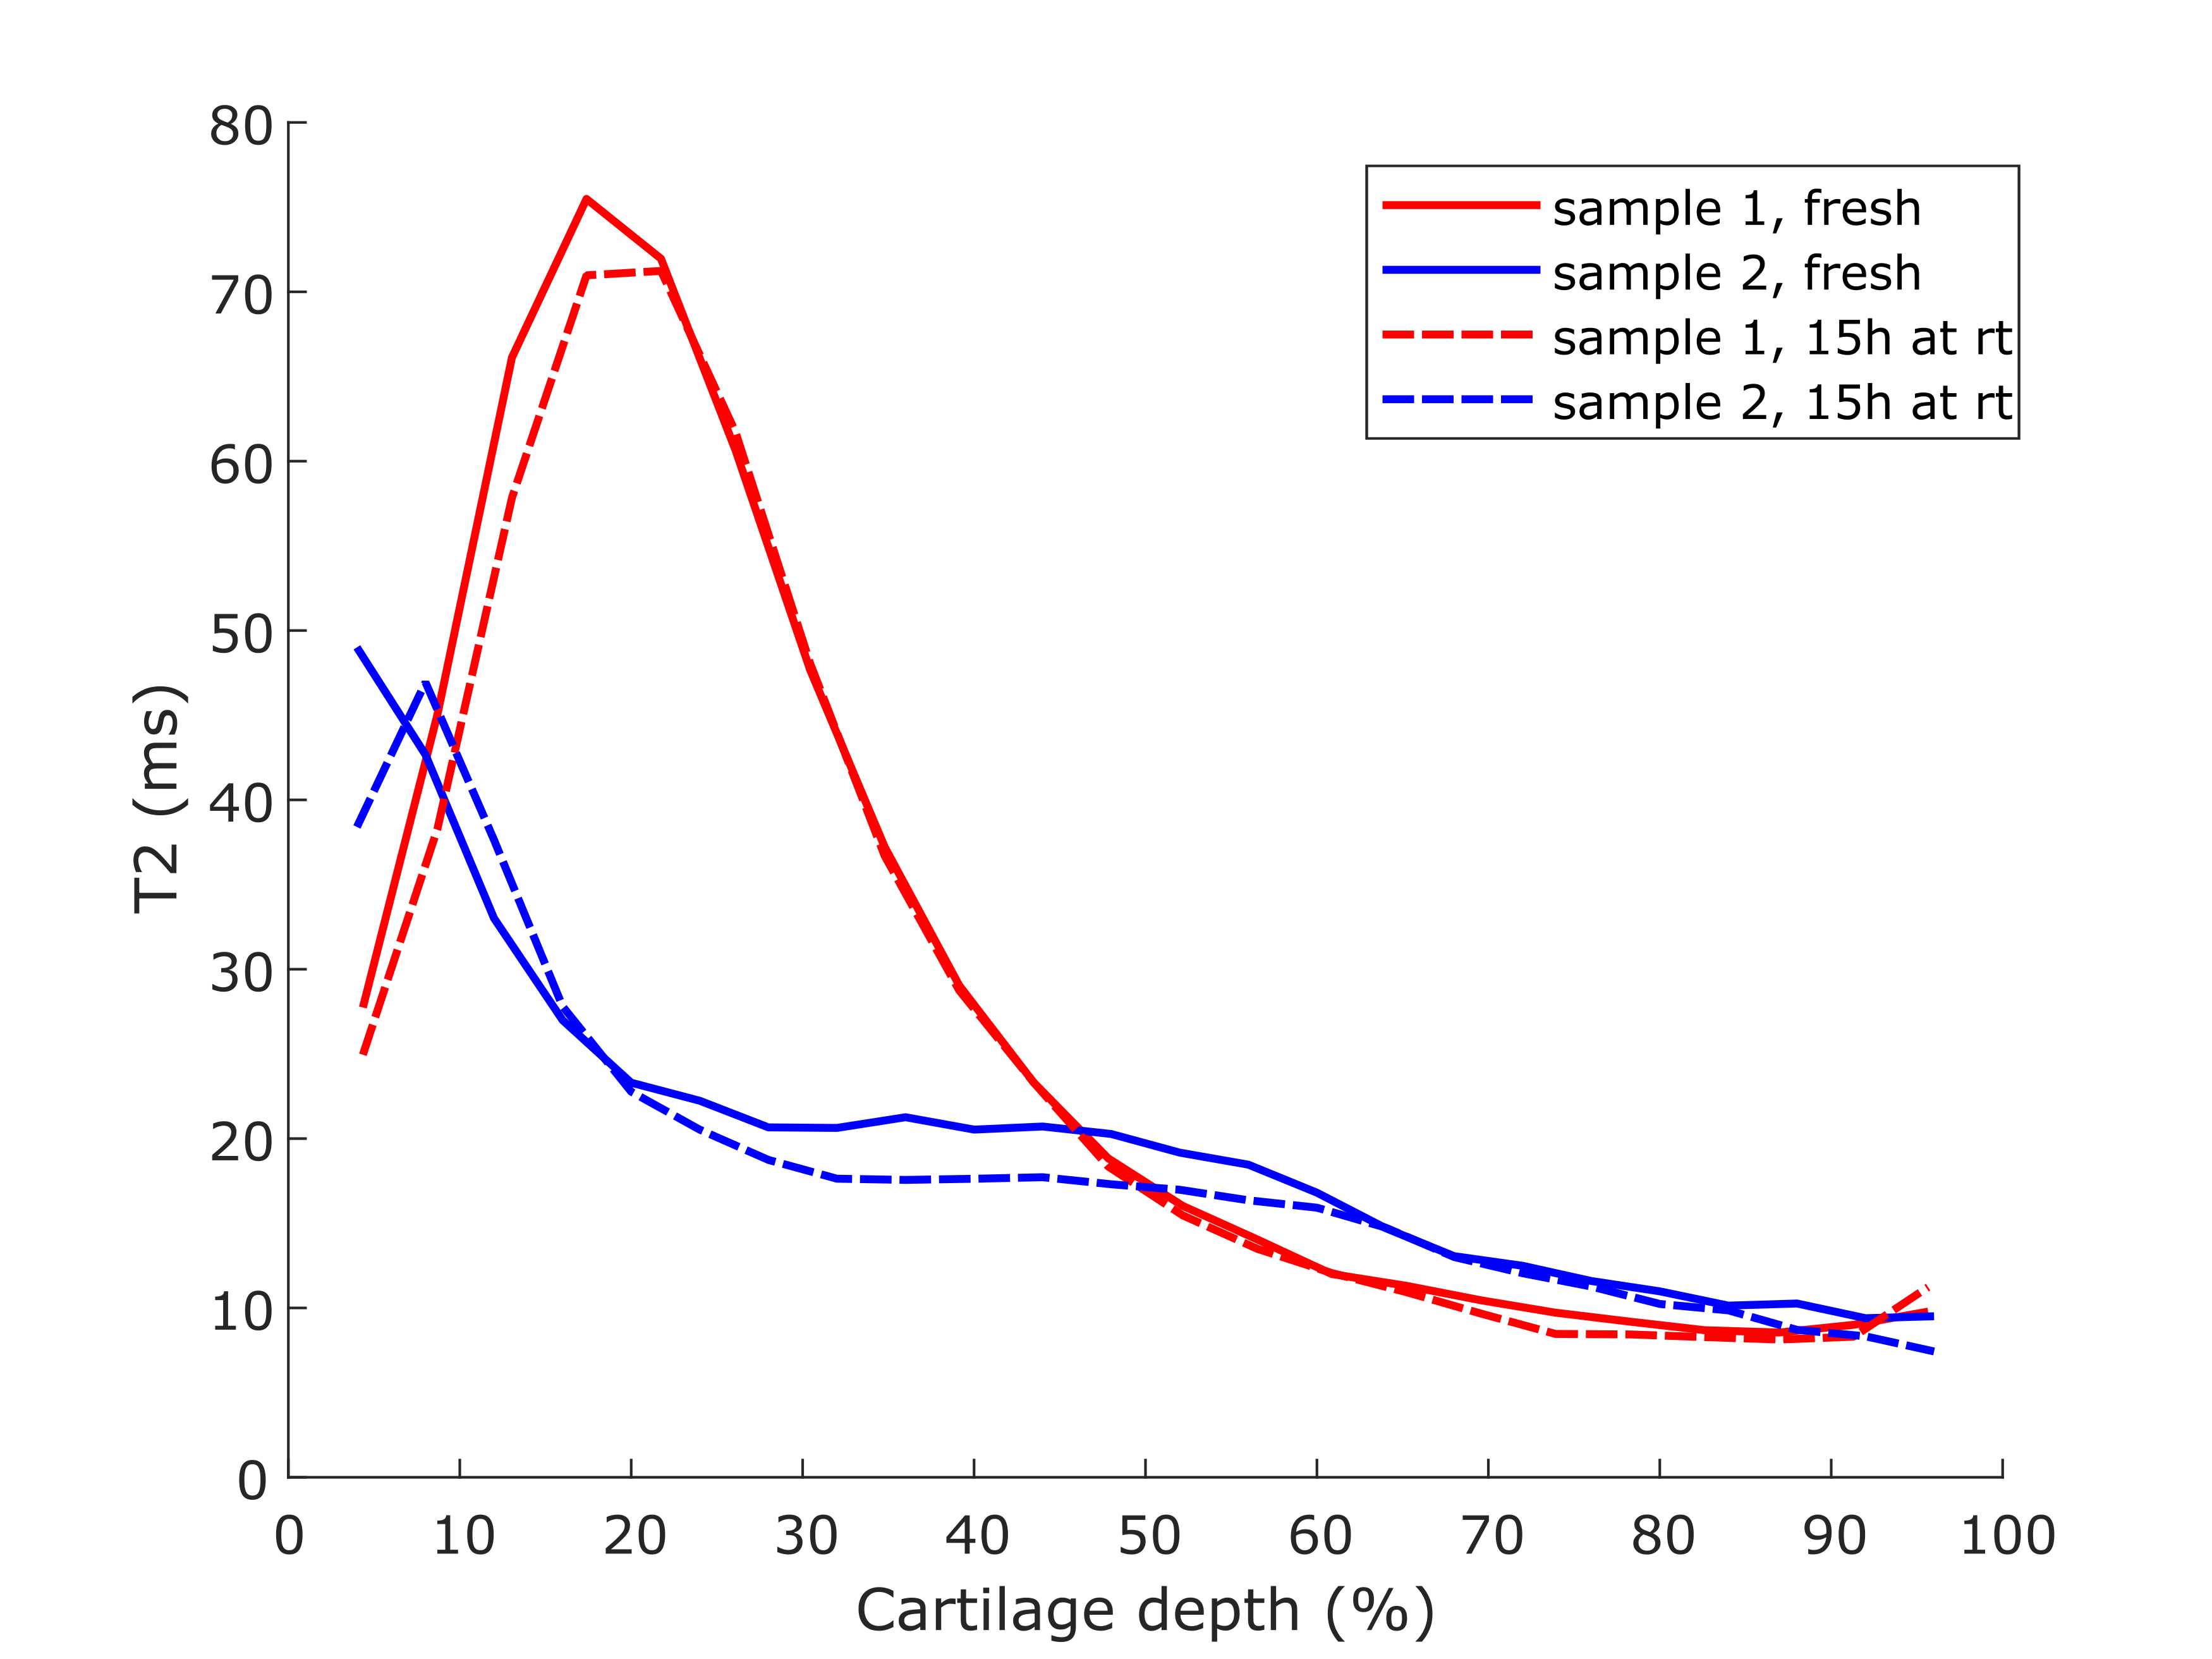
The T1-relaxation time was clearly decreased in both samples after keeping them at room temperature for 15 hours (Fig. 1). Adiabatic T1rho relaxation time was altered a little between timepoints, but no clear trends were observed; most notably the maximum T1rho relaxation time values were slightly lower after the storage at room temperature (Fig. 2). T2-relaxation time displayed the least changes between the timepoints (Fig. 3). Further, it was noted that the maximum values of each of the relaxation profiles were located a little deeper in the cartilage at the later timepoint (Figs. 1-3).Discussion and Conclusions
The results show that especially T1-relaxation time of articular cartilage can be decreased during prolonged scanning protocols, at least if the sample is immersed in perfluoropolyether during scanning. Other relaxation properties were not drastically changed during this suboptimal storage of the samples. The change in T1-relaxation could be caused for example by the dehydration of the samples5. The slight shift in the profiles further suggests that cartilage may have shrunk during the storage at room temperature, which could have also been caused by dehydration. However, dehydration should have also affected the T2-relaxation time of the samples6. Collagen cross-linking could also reduce the T1-relaxation time, but it also should affect the adiabatic T1rho-relaxation7. Possible temperature change in the magnet room or depletion of proteoglycans from the cartilage should have affected the other measurements too8,9. Nevertheless, reasons for such changes in the tissue, i.e. changes in water fraction of cross-linking of collagens, are difficult to point in the study setup. This study is limited firstly due to the low number of samples and secondly since the fresh samples are obtained from a knee joint that has already been preserved at 4 °C for some time prior to sample preparation. However, the findings of this study highlight that prolonged scan times can be an issue in preclinical studies with ex vivo osteochondral samples. It can be concluded that relaxation properties of osteochondral samples may be altered during MRI scanning protocol and this should be considered when designing the study setup.Acknowledgements
Help from Mr. Antti Paajanen (M. Sc.) and Mr. Iman Kafian Attari (M. Sc.) in sample preparation, and financial support from the Academy of Finland (grants #285909, #319440 and #325146) are gratefully acknowledged.References
1. Fishbein KW, Canuto HC, Bajaj P, et al. Optimal methods for the preservation of cartilage samples in MRI and correlative biochemical studies. Magn. Reson. Med. 2007;57(5):866-873.
2. Fishbein KW, Gluzband YA, Kaku M, et al. Effects of formalin fixation and collagen cross‐linking on T2 and magnetization transfer in bovine nasal cartilage. Magn. Reson. Med. 2007;57(6):1000-1011.
3. Reiter DA, Peacock A, Spencer RG. Effects of frozen storage and sample temperature on water compartmentation and multiexponential transverse relaxation in cartilage. Magn. 2011;29(4):561-567.
4. Zheng S, Xia Y, Bidthanapally A, et al. Damages to the extracellular matrix in articular cartilage due to cryopreservation by microscopic magnetic resonance imaging and biochemistry. Magn. 2009;27(5):648-655.
5. Damion R, Pawaskar S, Ries M, et al. Spin–lattice relaxation rates and water content of freeze-dried articular cartilage. OA Cartilage. 2012;20(2):184-190.
6. Berberat JE, Nissi MJ, Jurvelin JS, et al. Assessment of interstitial water content of articular cartilage with T1 relaxation. Magn. 2009;27(5):727-732.
7. Rautiainen J, Nieminen M, Salo E-N, et al. Effect of collagen cross-linking on quantitative MRI parameters of articular cartilage. OA Cartilage. 2016;24(9):1656-1664.
8. Gandhi S, Daniel B, Butts K. Temperature dependence of relaxation times in bovine adipose tissue. Paper presented at: Sydney, Australia: Proceedings 6th ISMRM 1998.
9. Wayne JS, Kraft KA, Shields KJ, et al. MR imaging of normal and matrix-depleted cartilage: correlation with biomechanical function and biochemical composition. Radiology. 2003;228(2):493-499.
Figures