2818
Fat suppression in 3D Quantitative Ultrashort Echo Time Cones (qUTE-Cones) imaging1The Third Affiliated Hospital of Southern Medical University, Guangzhou, China, 2UC San Diego, San Diego, CA, United States, 3GE healthcare, San Diego, CA, United States, 4VA health system, San Diego, CA, United States
Synopsis
Strong fat signal contamination leads to significant errors in quantitative UTE (qUTE) imaging of musculoskeletal tissue. In this study, we used a fat suppression technique to investigate whether fat signals could be sufficiently suppressed in qUTE imaging and whether the fat saturation preparation would affect the resultant qUTE measures due to the induced water attenuation.
Introduction
Recently, several quantitative ultrashort echo time (qUTE) imaging techniques have been developed, including measures of T1, adiabatic T1ρ, quantitative magnetization transfer (qMT) modeling, magnetization transfer ratio (MTR), and T2* (1-5). These qUTE biomarkers may provide useful information in early disease diagnosis for diseases involving short T2 tissues such as calcified cartilage, menisci, tendons, ligaments, and bones (6,7). However, fat tends to show strong signal, consistently shifting into other tissue regions due to the off-resonance effect in the non-Cartesian UTE imaging (8,9). This strong fat signal contamination inevitably leads to significant errors in qUTE imaging of musculoskeletal (MSK) tissues. In this study, a fat saturation (FS) technique was used in qUTE imaging to investigate whether fat signals could be sufficiently suppressed and whether the fat saturation preparation would affect the resultant qUTE measures due to the induced water attenuation. qUTE without fat saturation preparation (non-FS) was also used for comparison.Materials and Methods
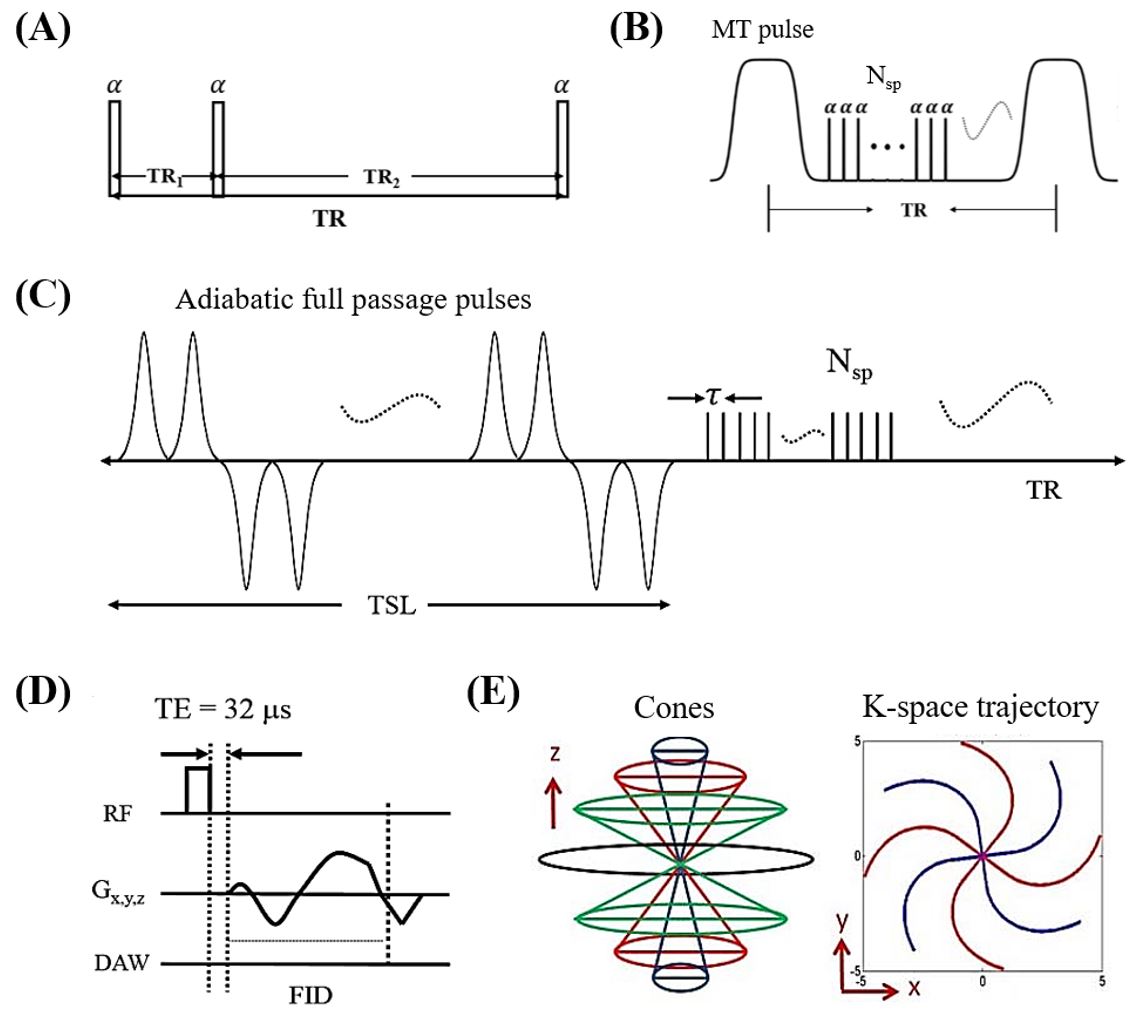
Seven cartilage and ten meniscus samples were harvested from five fresh cadaveric human knee joints. Cartilage samples, including cartilage, subchondral bone, and spongey bone, were cut into cuboid shapes with an approximate size of 26×21×5 mm3. Meniscus samples were sectioned in the sagittal plane at a thickness of 4 mm. Peripheral synovial tissue samples containing fat were also reserved. High resolution scanning of the whole knee joint was also carried out on six knee samples from six separate donors.qUTE-MR imaging (Figure 1) was performed on a 3T clinical MRI scanner (MR750, GE Healthcare Technologies, Milwaukee, WI, USA). A high signal-to-noise ratio (SNR) performance 30-ml birdcage T/R coil was used for scanning the cartilage and meniscus samples, and an eight-channel T/R knee coil was used for scanning the whole knee joint.
qUTE imaging protocol parameters were as follows: 1) T1 measurement with 3D UTE-Cones actual flip angle (TR = 20/100 ms, flip angle (FA) = 45˚) and variable flip angle (FA = 4˚, 8˚, 12˚, 16˚, 20˚, 25˚ and 30˚; TR = 20 ms) (UTE-Cones AFI-VFA) method (1); 2) macromolecular proton fraction f with qMT modeling and MTR measurement with a UTE-Cones MT sequence (MT saturation power = 500°, 1000°, and 1500°; frequency offset = 2, 5, 10, 20, and 50 kHz; TR=100 ms; FA = 7˚; Nsp = 9) (2,3); 3) Adiabatic T1ρ measurement with adiabatic full passage pulse train prepared UTE-Cones acquisitions (spin lock time = 0, 12, 24, 36, 48, 72, 96 ms; TR = 500, FA = 10˚, Nsp = 21) (4); 4) T2* measurement with a multi-echo UTE-Cones sequence (TE = 0.032, 4.1, 8.1, 12.1, 16.1, and 32 ms (5). Other sequence parameters were: 1) cartilage and meniscus samples: FOV = 5×5×2cm3, matrix = 128×128×10; 2) whole knee joints: FOV = 15×15×10.8cm3, matrix = 256×256×36. A commercially available fat saturation module (i.e., chemical shift selective saturation technique) was placed before the excitation spoke train to suppress fat signal in the qUTE imaging. Due to direct or indirect saturation (i.e., MT effect) effects, it was possible for fat saturation module to attenuate water signal, as well.
All analysis algorithms were written in Matlab (The MathWorks Inc., Natick, MA, USA) and were executed offline on the DICOM images obtained by the acquisition protocols described above. The variations of the parameters between FS-qUTE measures and non-FS-qUTE measures were also calculated in percentages (i.e., |PFS – Pnon-FS|/ Pnon-FS *100%).
Results and Discussions
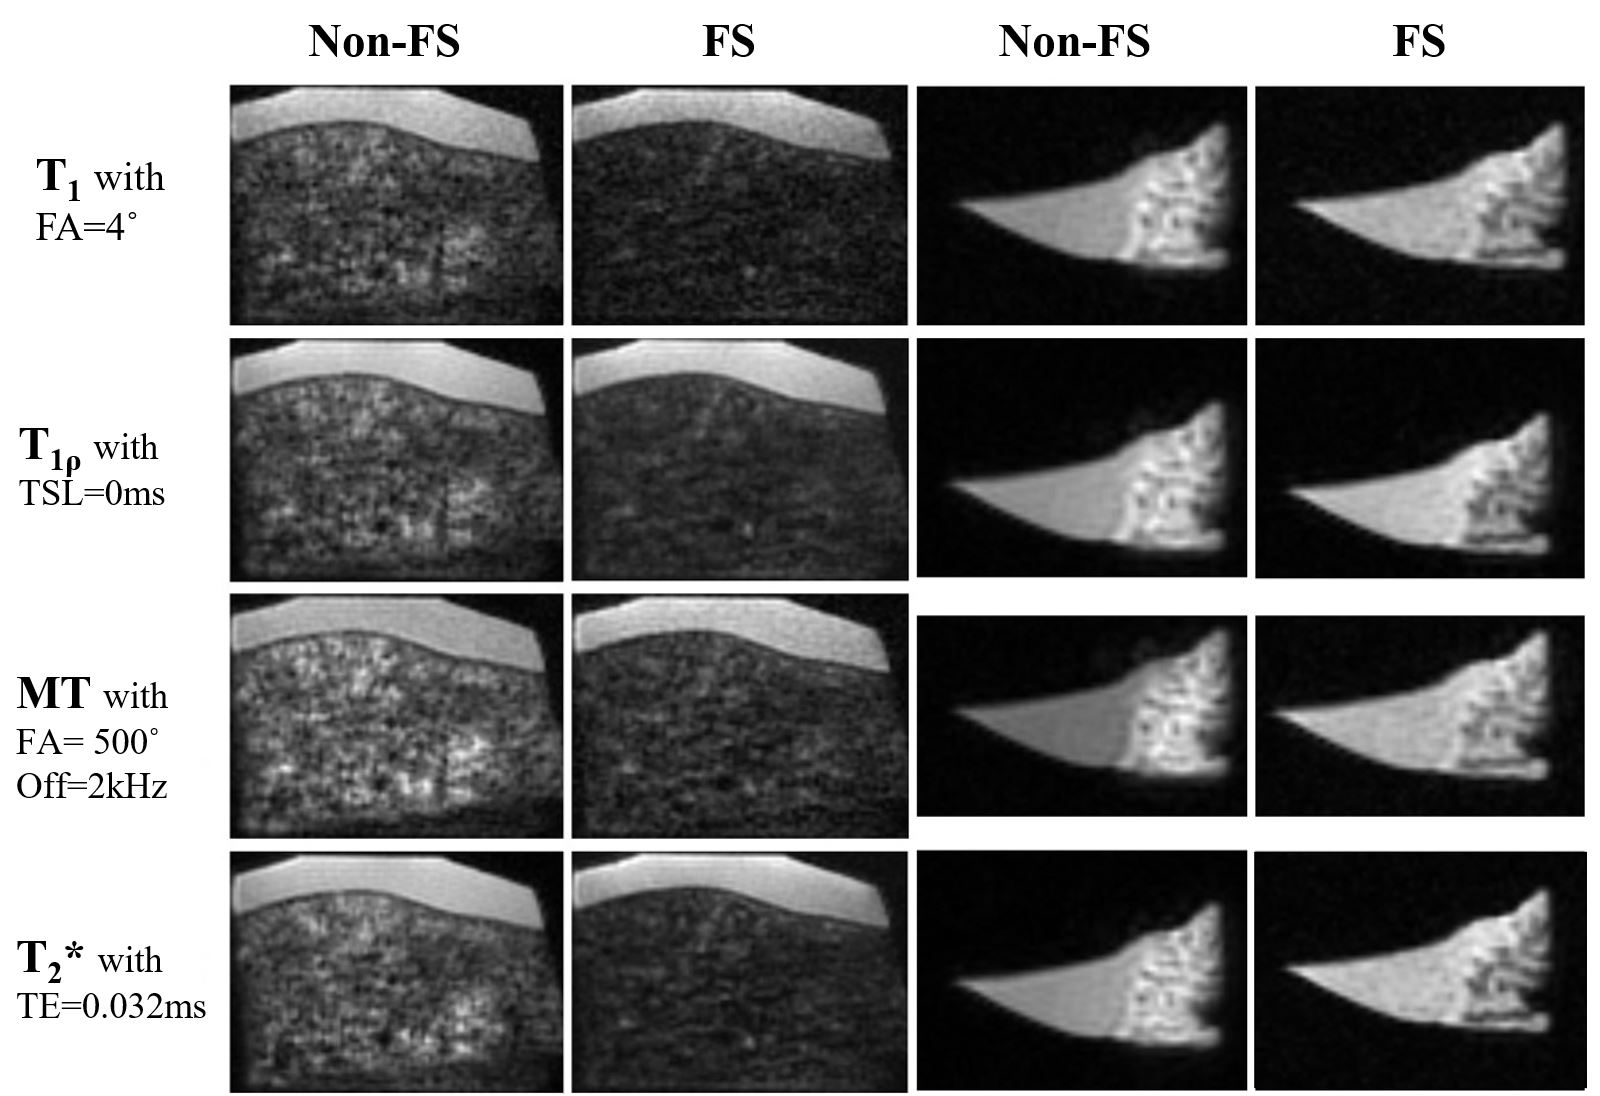
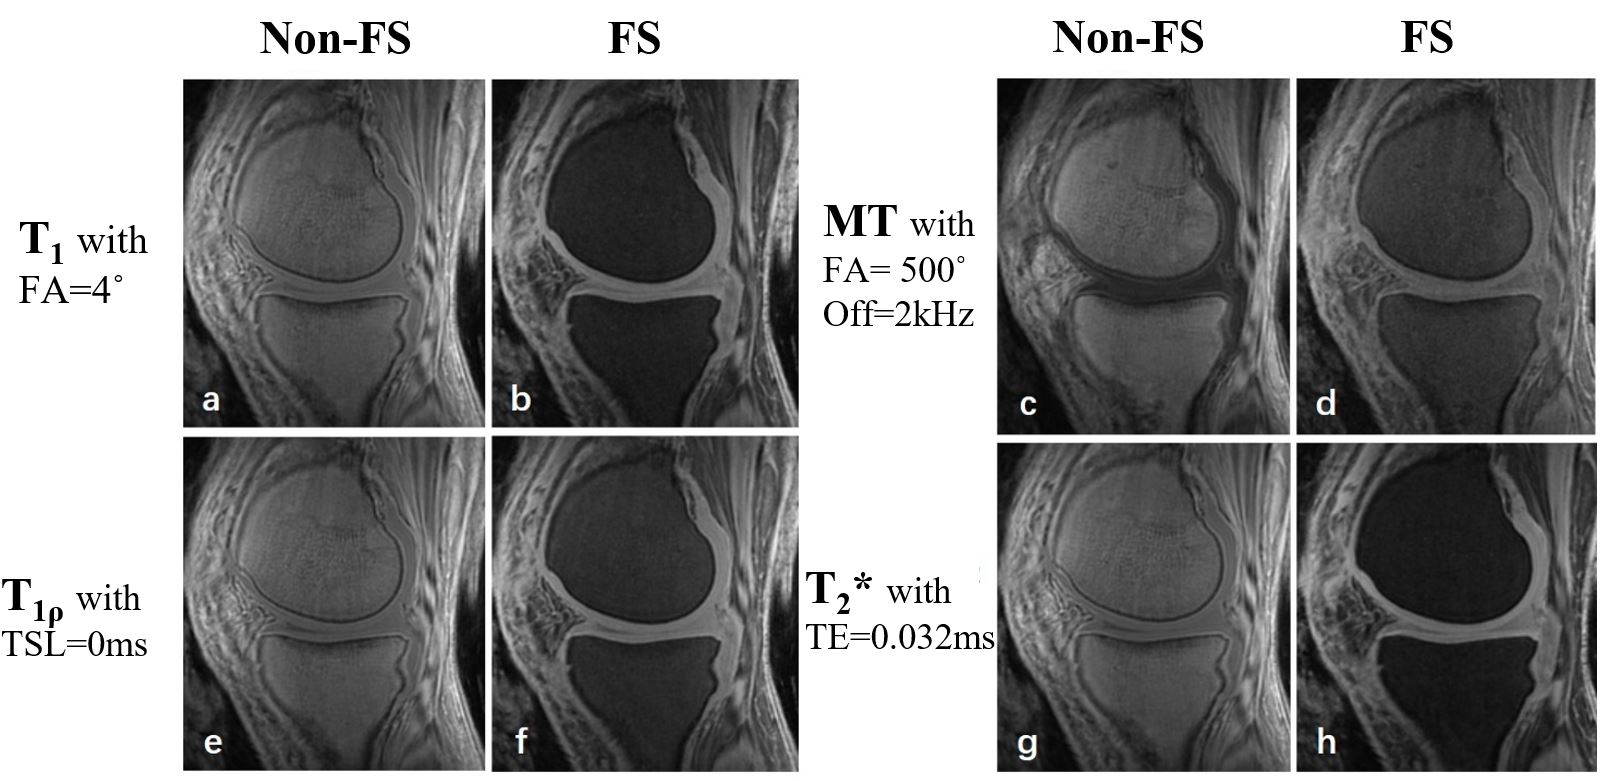
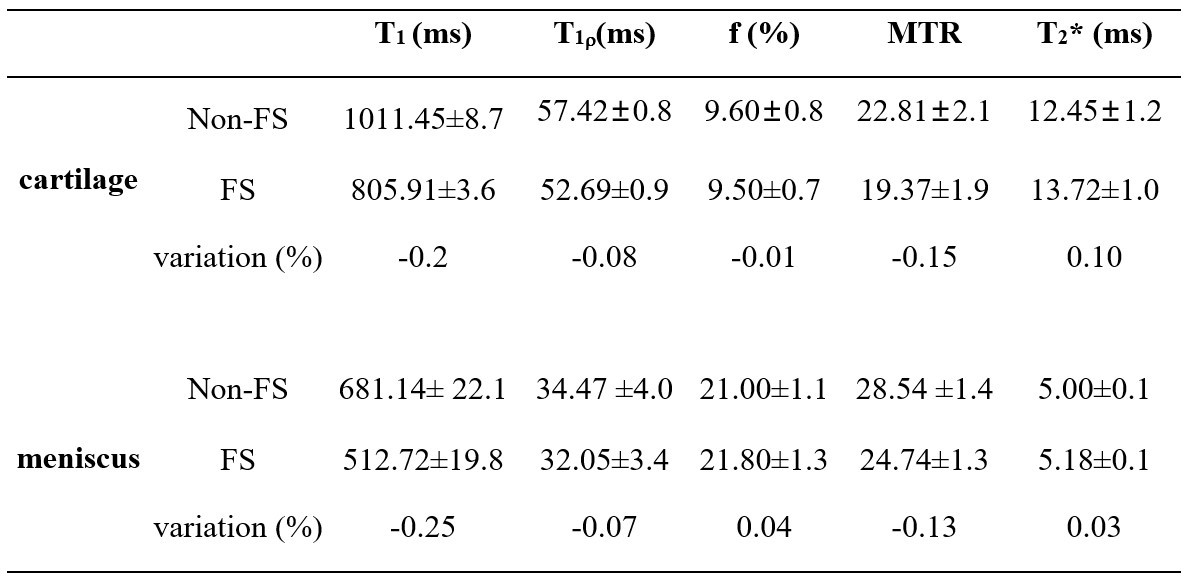
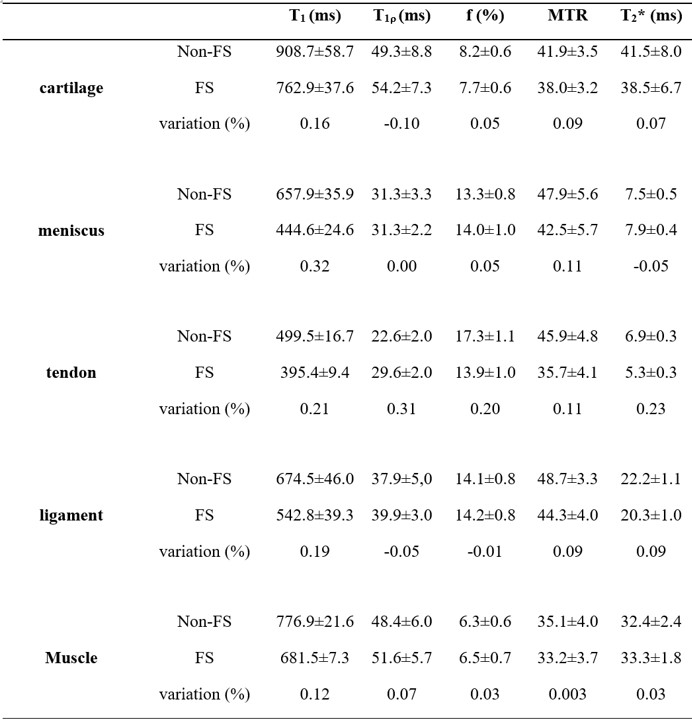
Compared with the non-FS-qUTE images, fat signals were effectively suppressed for both cartilage (spongey bone region) and meniscus (synovial tissue region) samples in the FS-qUTE images (Figure 2). Figure 3 demonstrates that the fat signals were uniformly suppressed in the whole knee joint when using the FS technique. Compared with the images acquired by non-FS-qUTE sequences, a much higher contrast of cartilage and meniscus was found in the FS-qUTE images. Therefore, a more accurate qUTE imaging in knee is expected because of the much decreased fat contamination in cartilage, meniscus, ligament, tendon, and muscle in FS-qUTE images.Table 1 summarizes qUTE measures for cartilage and meniscus samples with FS and without FS. To investigate the effect of the FS module in qUTE imaging in regard to water attenuation, the regions of interest (ROIs) were placed in regions without any fat. There was significant T1 reduction in the measurements from FS-qUTE as compared to results from the non-FS-qUTE. However, for adiabatic T1ρ, f with qMT modeling, MTR, and T2* measures, there were very minor differences between FS-qUTE and non-FS-qUTE.
Table 2 summarizes qUTE measurements for knee joint tissues with FS and without FS. Again, ROIs were drawn in regions without any fat. It was found that adiabatic T1ρ, f with qMT modeling, MTR, and T2* measures did not vary much between FS-qUTE and non-FS-qUTE imaging of cartilage, meniscus, ligament, and muscle.
Conclusion
Combined with the fat suppression technique, high image contrast and decreased fat contamination could be obtained for qUTE imaging. Accurate qUTE measures of adiabatic T1ρ, f with qMT modeling, MTR, and T2* were achieved when fat suppression module is applied.Acknowledgements
The authors are thankful for support from R01AR075825, 1R01NS092650, 2R01AR062581, 1R01AR068987, I01CX001388, and I01RX002604.References
1. Ma YJ, Zhao W, Wan L, Guo T, Searleman A, Jang H, Chang EY, Du J. Whole knee joint T1 values measured in vivo at 3T by combined 3D ultrashort echo time cones actual flip angle and variable flip angle methods. Magn Reson Med 2018; DOI: 10.1002/mrm.27510.
2. Ma YJ, Chang EY, Carl M, Du J. Quantitative magnetization transfer ultrashort echo time imaging using a time-efficient 3D multispoke Cones sequence. Magn Reson Med 2018; 79:692-700.
3. Ma YJ, Shao H, Du J, Chang EY. Ultrashort Echo Time Magnetization Transfer (UTE-MT) Imaging and Modeling: Magic Angle Independent Biomarkers of Tissue Properties. NMR Biomed 2016; 29:1546-1552. 4. Ma YJ, Carl M, Searleman A, Lu X, Chang EY. Du J. 3D adiabatic T1ρ prepared ultrashort echo time cones sequence for whole knee imaging. Magn Reson Med 2018; 80:1429-1439.
5. Chang EY, Du J, Iwasaki K, Biswas R, Statum S, He Q, Bae WC, Chung CB. Single- and bi-component T2* analysis of tendon before and during tensile loading, using UTE sequences. J Magnetic Resonance Imaging 2014; 42:114-120.
6. Chen B, Cheng X, Dorthe EW, Zhao Y, D'Lima D, Bydder GM, Liu S, Du J, Ma YJ. Evaluation of normal cadaveric Achilles tendon and enthesis with ultrashort echo time (UTE) magnetic resonance imaging and indentation testing. NMR in Biomed 2018; 20:e4034.
7. Chang EY, Du J, Chung CB. UTE imaging in the musculoskeletal system. J Magn Reson Imaging 2015 Apr;41(4):870-83.
8. Robson MD, Gatehouse PD, Bydder M, Bydder GM. Magnetic resonance: an introduction to Ultrashort TE (UTE) imaging. J Comput Assist Tomogr 2003;27:825–846.
9. Du J, Carl M, Bydder M, Takahashi A, Chung CB, Bydder GM. Qualitative and quantitative ultrashort echo time (UTE) imaging of cortical bone. J Magn Reson 2010 Dec 1;207(2):304-11.
Figures