2817
A three compartment complex signal model to describe the signal decay of ultrashort T2* tissues applied to ex vivo ovine Achilles tendons
Marta Brigid Maggioni1, Martin Krämer1, and Jürgen R. Reichenbach1,2,3,4
1Medical Physics Group, Institute of Diagnostic and Interventional Radiology, Jena University Hospital - Friedrich Schiller University, Jena, Germany, 2Michael Stifel Center for Data-driven and Simulation Science Jena, Friedrich Schiller University, Jena, Germany, 3Abbe School of Photonics, Friedrich Schiller University, Jena, Germany, 4Center of Medical Optics and Photonics, Friedrich Schiller University, Jena, Germany
1Medical Physics Group, Institute of Diagnostic and Interventional Radiology, Jena University Hospital - Friedrich Schiller University, Jena, Germany, 2Michael Stifel Center for Data-driven and Simulation Science Jena, Friedrich Schiller University, Jena, Germany, 3Abbe School of Photonics, Friedrich Schiller University, Jena, Germany, 4Center of Medical Optics and Photonics, Friedrich Schiller University, Jena, Germany
Synopsis
Tendons are highly ordered tissues, mainly composed of collagen, and characterized by very short transverse T2* relaxation times. Even when using ultra-short echo-time imaging sequences, quantification of T2* is challenging as the origin and characteristics of the signal decay in tendons is still under debate. In this work, we finely sampled the decay of the transverse magnetization using an echo-train shifted multi-echo ultra-short echo-time sequence with 55 echoes and applied a complex tri-exponential model to extract T2* constants.
Introduction
Tendons are characterised by a highly ordered, anisotropic structure of collagen fibers, which results in short values of the decay of the transversal magnetization T2* and requires ultra-short echo-time (UTE) sequences for direct imaging and parameter quantification. However, the sources of the signal detected with UTE sequences are still under discussion. So far, three possible contributions have been proposed: protons that are part of the collagen molecule; “bound water” or protons linked with the collagen molecule but not inherently part of it; and “free water” or water present in the interstitial matrix and between the collagen fibers1,2,3,4. Recently, the possibility that the signal could originate directly from the collagen molecules has also been investigated5 with contrasting results5,6. Different models have been proposed and used to quantify T2* in tendons, including mono-exponential1, bi-exponential1,4, three-component exponential fitting4 as wells as multi-components models2,3. In this work, we applied an echo-train shifted multi-echo UTE sequence, which finely sampled the T2* decay with overall 55 echoes. As the signal decay curves showed clear oscillations, possibly from multiple components with different chemical shifts, we propose a tri-component exponential complex model for fitting such finely sampled TE series.Methods
Fresh Achilles tendons from four healthy sheep were excised after euthanasia in compliance with the ethical guidelines of the legal, local animal rights protection authorities. A 3D center-out radial multi-echo UTE sequence7 and two 8-channels flexible NORAS Variety coils were used for the measurements on a 3T clinical whole-body MRI scanner (Magnetom PRISMA, Siemens Healthineers, Erlangen, Germany). The echoes were acquired with an echo train shift technique8 that allows the acquisition of 3 echoes per repetition time while the echoes are shifted for successive echo times. This echo-train shifted multi-echo protocols acquired 55 TEs ranging from 0.15 ms to 11.6 ms. Other imaging parameters were repetition-time: 20 ms, flip-angle: 18°, isotropic resolution (0.83x0.83x0.83) mm3 and the total acquisition time was 7.5 h. Due to the oscillatory pattern observed in the acquired data (see Fig. 1), the following tri-component exponential model was used for voxel-wise data fitting: $$S(TE)=(S_{bw} e^{(-TE/T_{2bw}^*)}e^{(-i2πΔf_{bw}TE)}+S_{fw}e^{(-TE/T_{2fw}^*)} +\\+S_{fat} e^{(-TE/T_{2fat}^*)}e^{(-i2πΔf_{fat}TE)})e^{(-i2πΔf_{g}TE+φ_{0})}$$where the first component represents the short water bound to the collagen fibers, the second the long free water and the third the contribution of fat or fat-like components to the signal. Finally, the $$$e^{(-i2πΔf_{g}TE+φ_{0})}$$$ component takes into account the global influence of off-resonance with $$$φ_{0}$$$ representing the initial phase offset. The choice of a complex model and a complex fit allowed us to not only include chemical shift information, but also to double the number of data points used for the fit, thus adding to the robustness of the obtained results. Prior to fitting, the reconstructed complex 3D UTE data was spatially smoothed with a 4x4 Gaussian filter to reduce noise contributions.
Results
Regions-of-interest were chosen in the tendon, muscle and enthesis regions, as depicted in Figure 3. The signal decays with increasing echo times in these ROIs are plotted in Figure 1, showing clear oscillations of multiple components with different chemical shifts. Figure 2 displays the signal fraction maps for the three components, $$$(S_{bw}, S_{fw},S_{fat})$$$ which match the expected distribution within the tendon: more bound-water in the mid-tendon without much free-water. Interestingly, also the third component, supposedly describing a fat-like component at a chemical shift of around 3.5 ppm, shows contributions within the tendon, which when comparing with Figure 1 is responsible for the observed major oscillation. Calculated T2* maps for the three components are shown in Figure 3. The results of the quantification of the T2* relaxation parameters in ROIs in the muscle, tendon and enthesis regions are reported as means over the four samples in Table 1.Discussion and conclusion
The signal decay curves shown in Figure 1 demonstrate that the proposed complex tri-component model is able to fit the data points acquired in the different tissues areas. The obtained average T2* of the tendons’ short component of 0.27±0.02 ms is much smaller than other values reported in the literature9,10. Reasons for this difference might be related to magic angle effects or the used animal model compared to human studies. One further reason for this very short T2* might be the very fine sampling used in the current study. With the strong oscillation observed in our study, conventional non echo-train shifted T2* measurements can greatly under-sample the true tri-compartment signal decay in tendons and therefore greatly overestimate T2*. The oscillation in the tendon signal decay appears to be caused by fat-like components with a chemical shift of 3.5 ppm that could be related to proteoglycans/glycosaminoglycans between the collagen fibers. However, more detailed studies are required to investigate further the origin of this oscillation.Acknowledgements
No acknowledgement found.References
- Chang E Y, Du J, Iwasaki K, et al. (2015), Single‐ and Bi‐component T2* analysis of tendon before and during tensile loading, using UTE sequences., Magn. Reson. Imaging, 42: 114-120.
- Zheng S, Xia Y, On the measurement of multi-component T2 relaxation in cartilage by MR spectroscopy and imaging, Magn. Reson. Imaging, 28,4,2010,537-545.
- Navon G, Eliav U, Demco D, et al. (2007), Study of order and dynamic processes in tendon by NMR and MRI., Magn. Reson. Imaging, 25: 362-380.
- Du J, Diaz E, Carl M, et al, Ultrashort echo time imaging with bicomponent analysis, Magn. Reson. Med, 2012; 67: 645.
- Siu AG, Ramadeen A, Hu X, et al, Characterization of the ultrashort‐TE (UTE) MR collagen signal, NMR Biomed., 2015; 28,1236–1244.
- Ma Y, Chang E, Bydder G. M, et al, Can ultrashort‐TE (UTE) MRI sequences on a 3‐T clinical scanner detect signal directly from collagen protons: freeze–dry and D2O exchange studies of cortical bone and Achilles tendon specimens, NMR Biomed., 2016;29:912–917
- Herrmann KH, Krämer M, Reichenbach JR. Time Efficient 3D Radial UTE Sampling with Fully Automatic Delay Compensation on a Clinical 3T MR Scanner. PLoS One. 2016;Mar14;11(3):e0150371
- Feinberg DA, Oshio K. Gradient-echo shifting in fast MRI techniques (ERASE imaging) for correction of field inhomogeneity errors and chemical shift. J Magn Reson (1969). 1992;97(1):177–183.
- Chen B,Cheng X,Dorthe EW, et al.Evaluation of normal cadaveric Achilles tendon and enthesis with ultrashort echo time (UTE) magnetic resonance imaging and indentation testing.NMR in Biomed. ,2019;32:e4034.
- Filho GH, Du J, Pak BC, et al. Quantitative Characterization of the Achilles Tendon in Cadaveric Specimens: T1 and T2 * Measurements Using Ultrashort-TE MRI at 3 T. American Journal of Roentgenology 2009;192(3):117–124
Figures
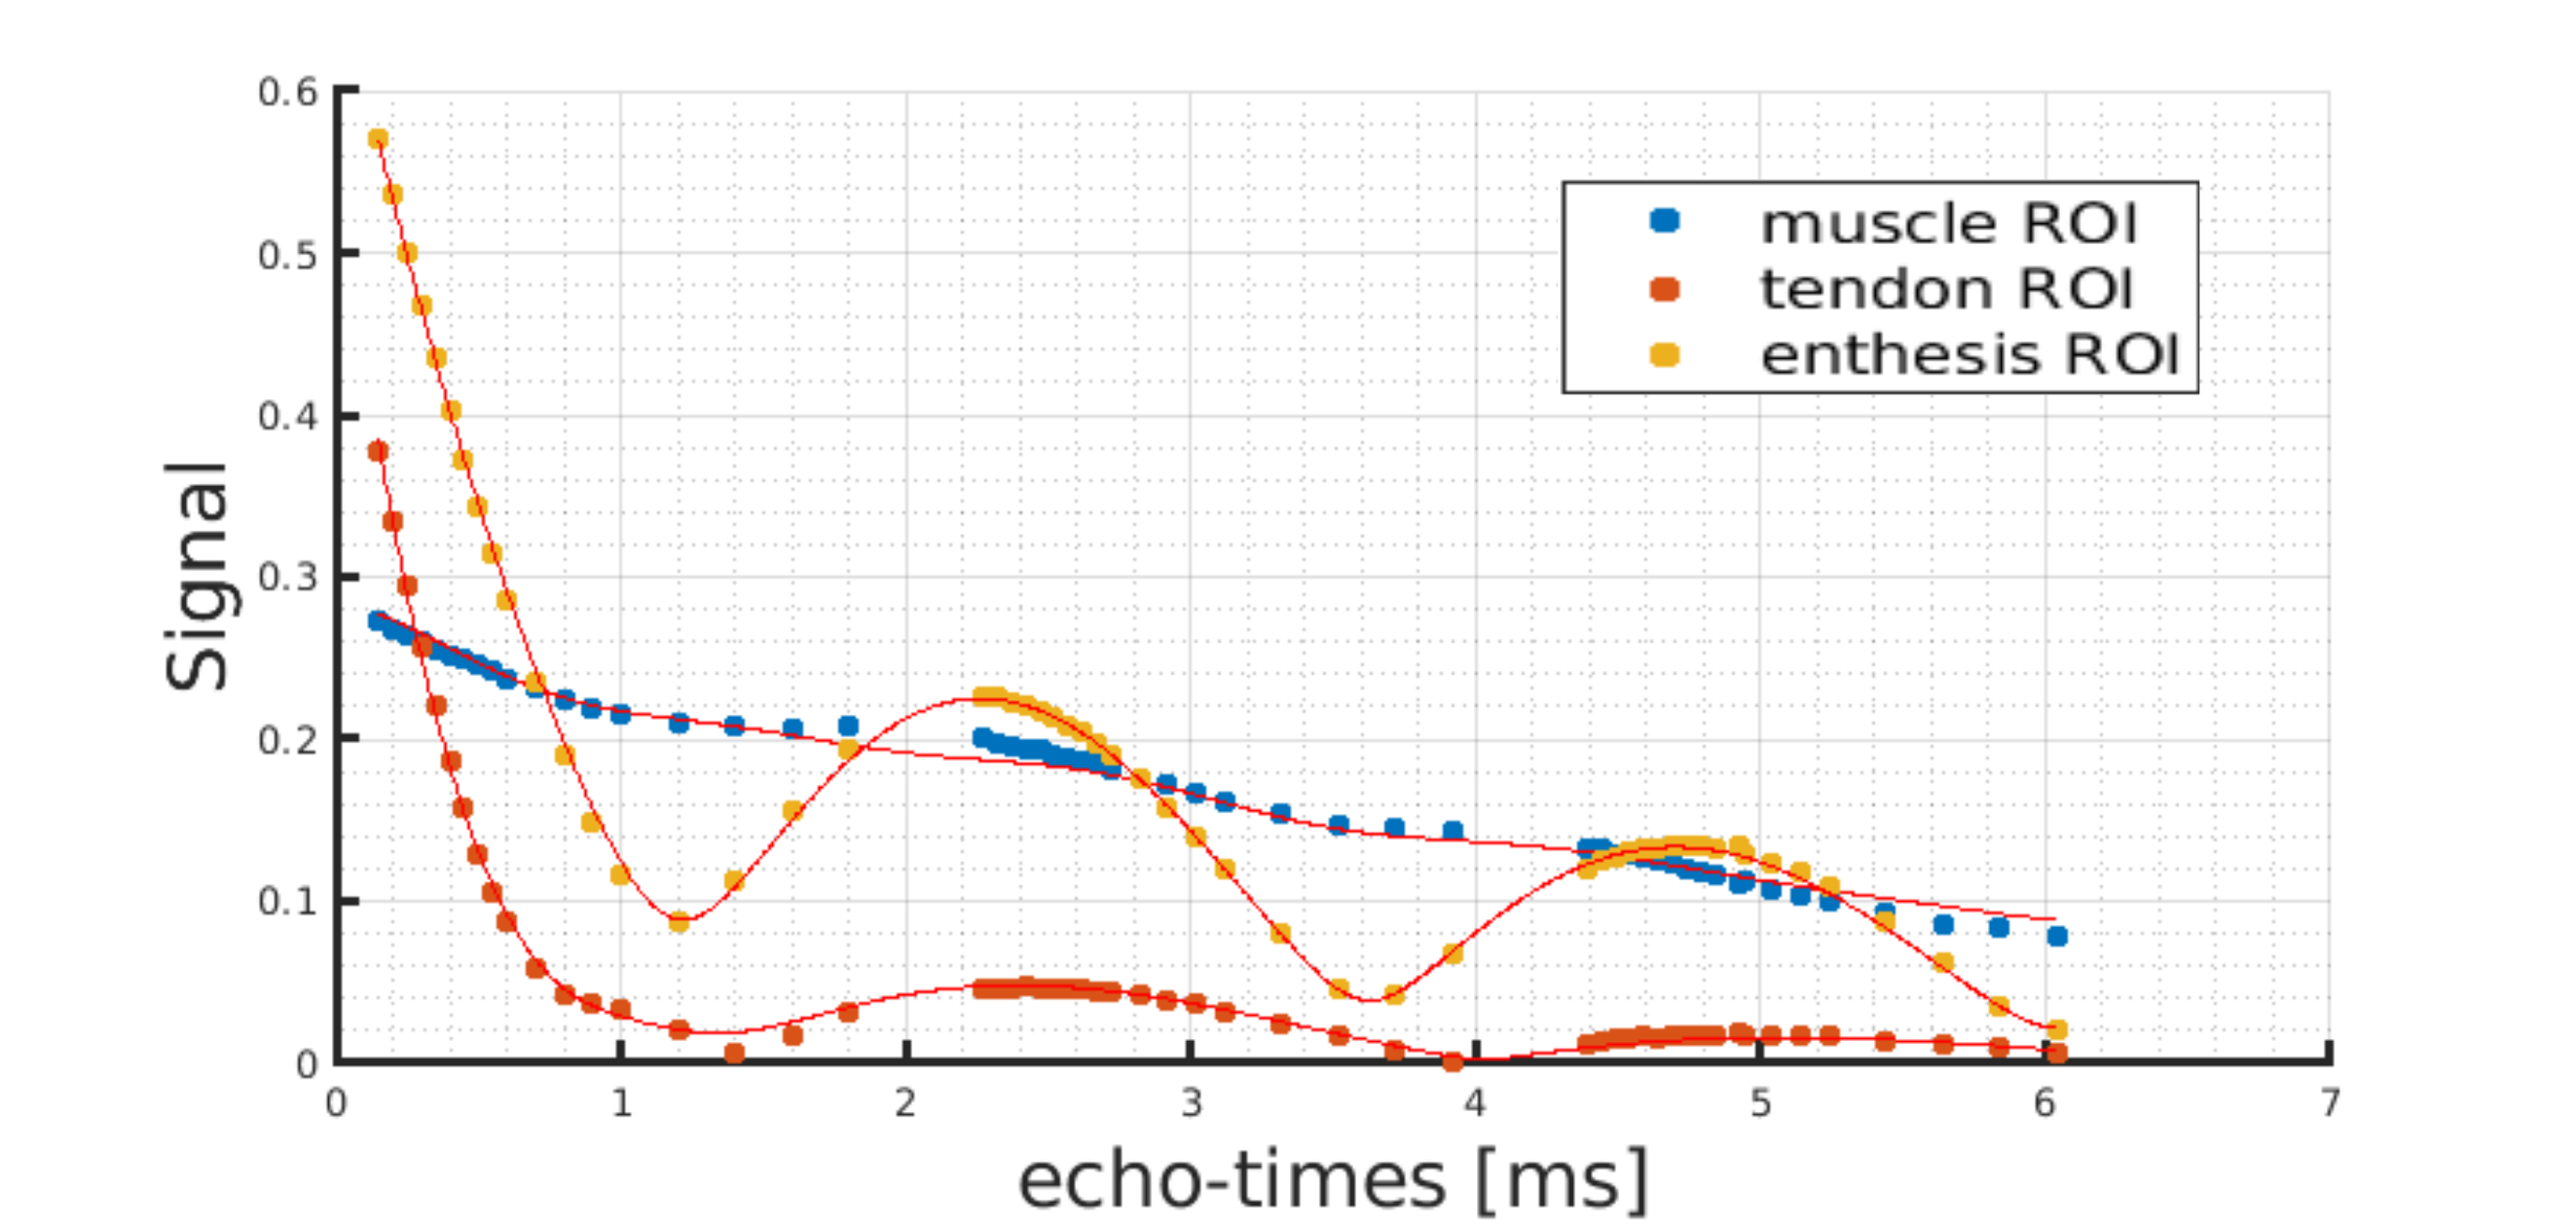
Fig 1: Signal decays from three
regions-of-interest placed in muscle, tendon and enthesis region,
respectively. The solid curves were generated by fitting the data
with the proposed model.
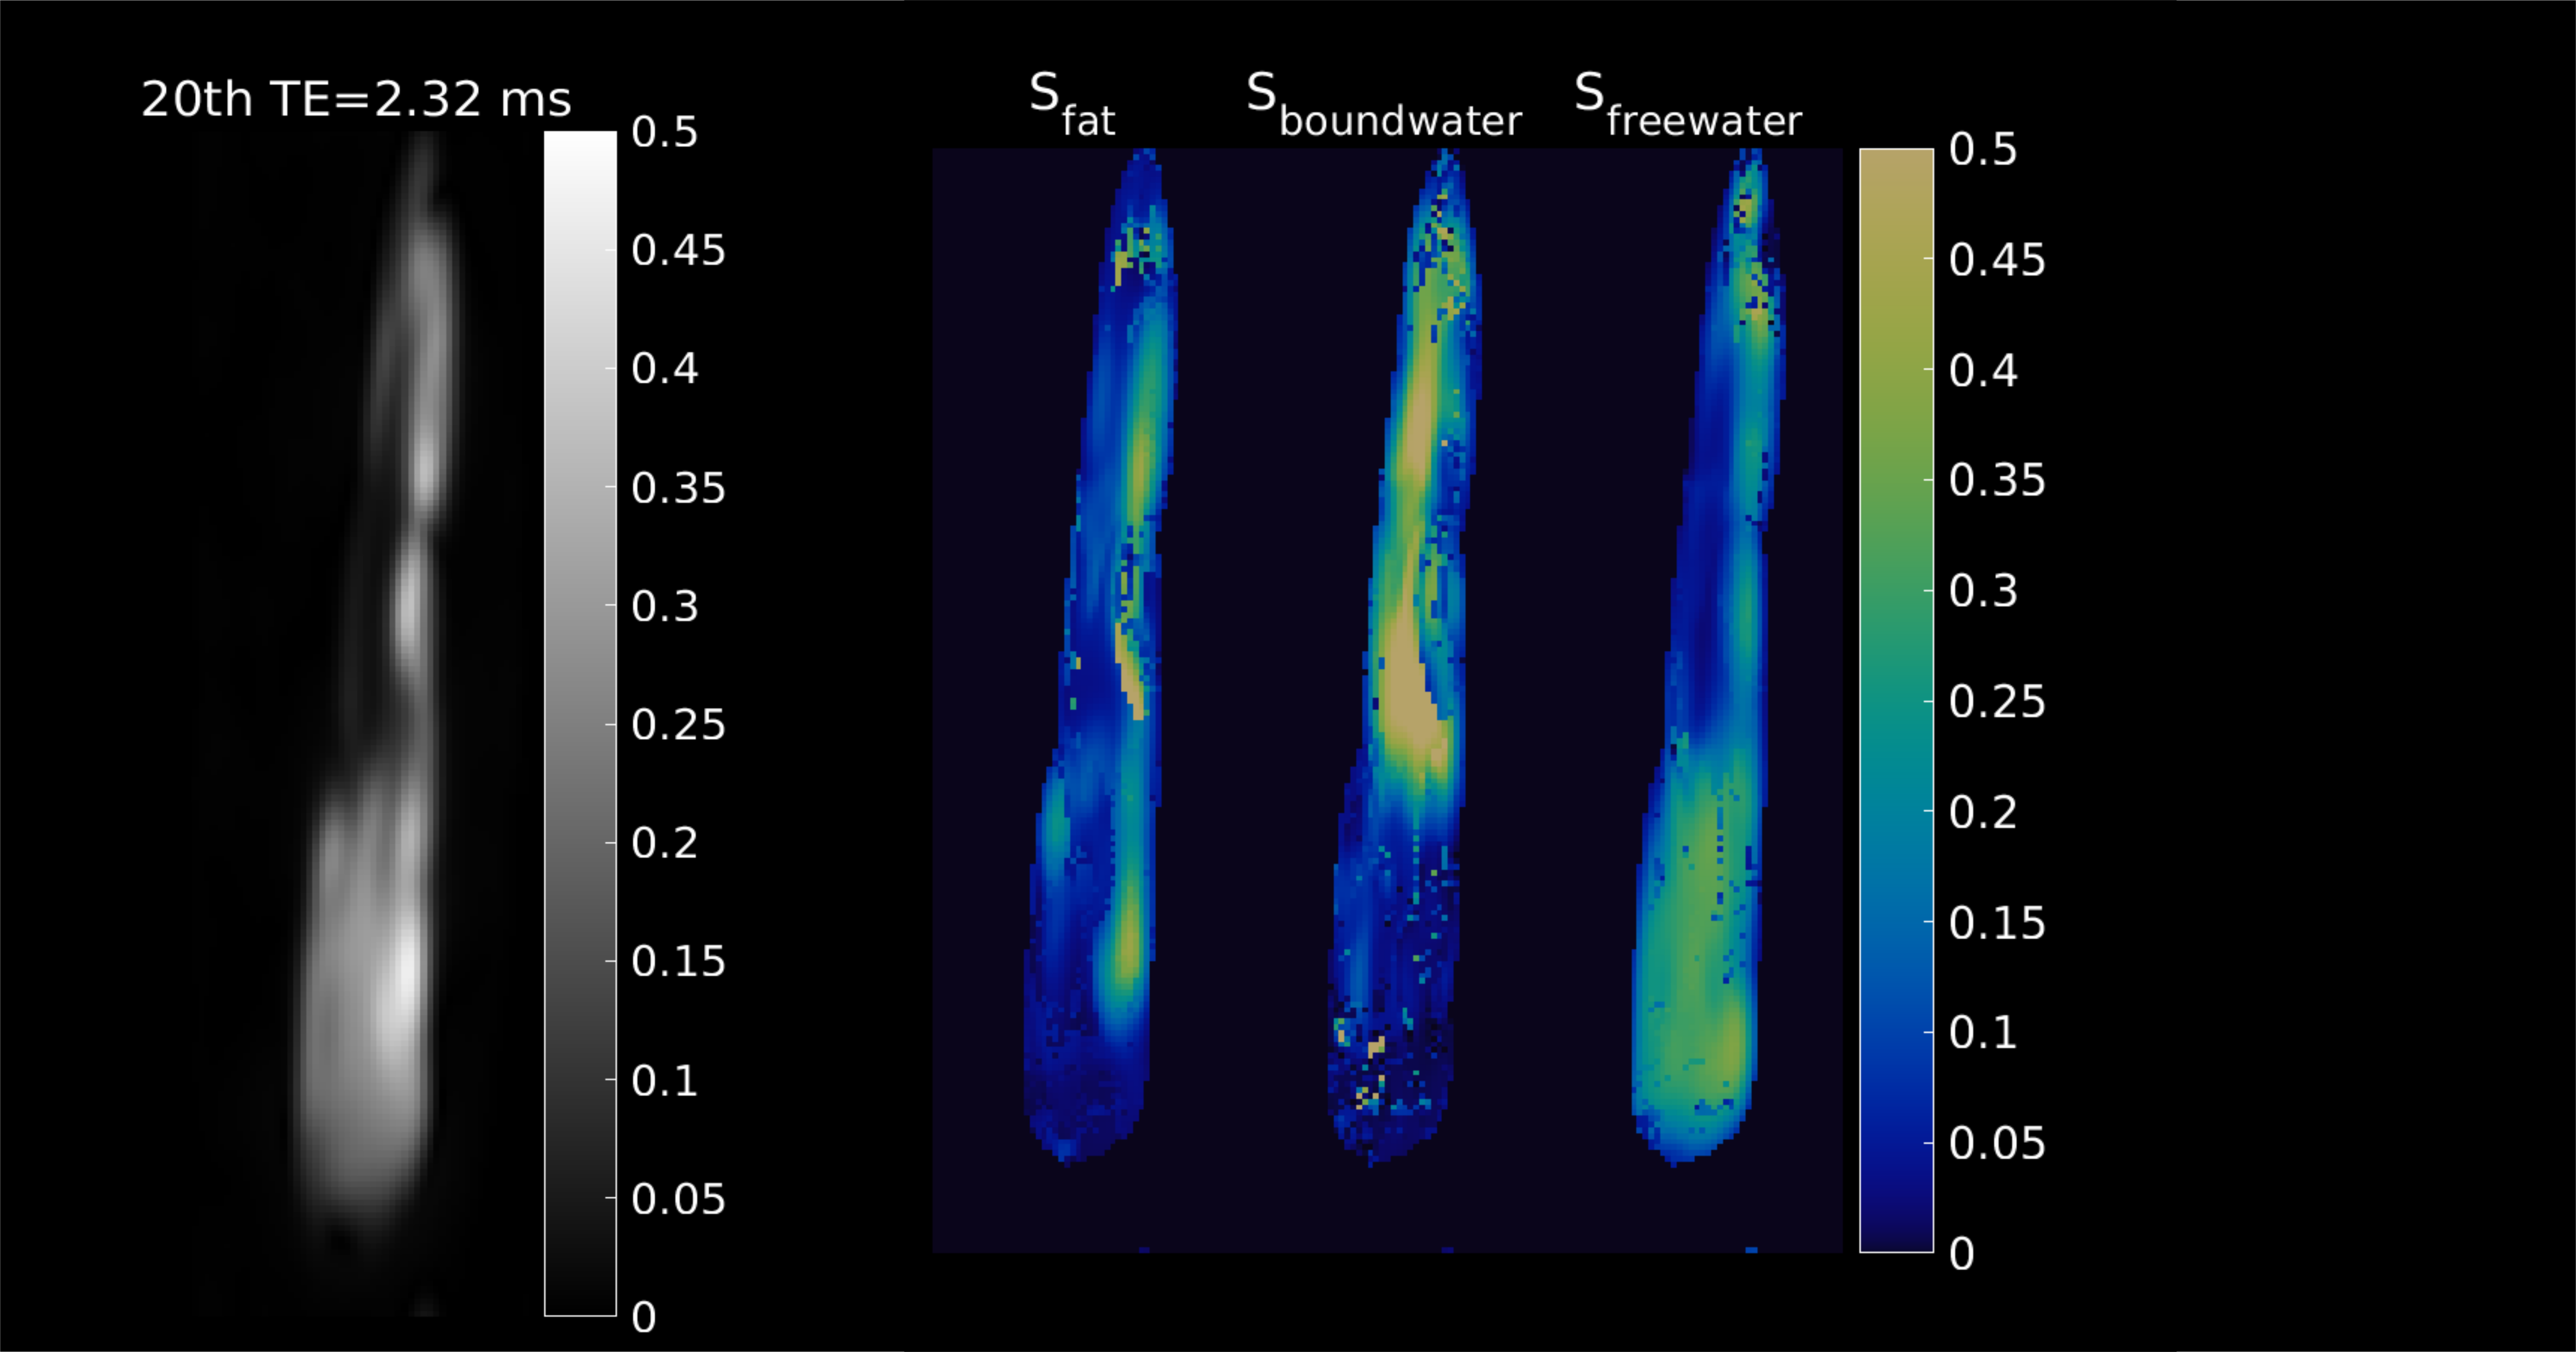
Fig 2: (Left)
Magnitude image of one of the acquired tendons at a later (20th)
echo. (Right)
The maps show the fractional signals Sf,
Sbw
and Sfw
(scaled between 0 and 0.5), obtained after fitting with the complex
tri-exponential model.
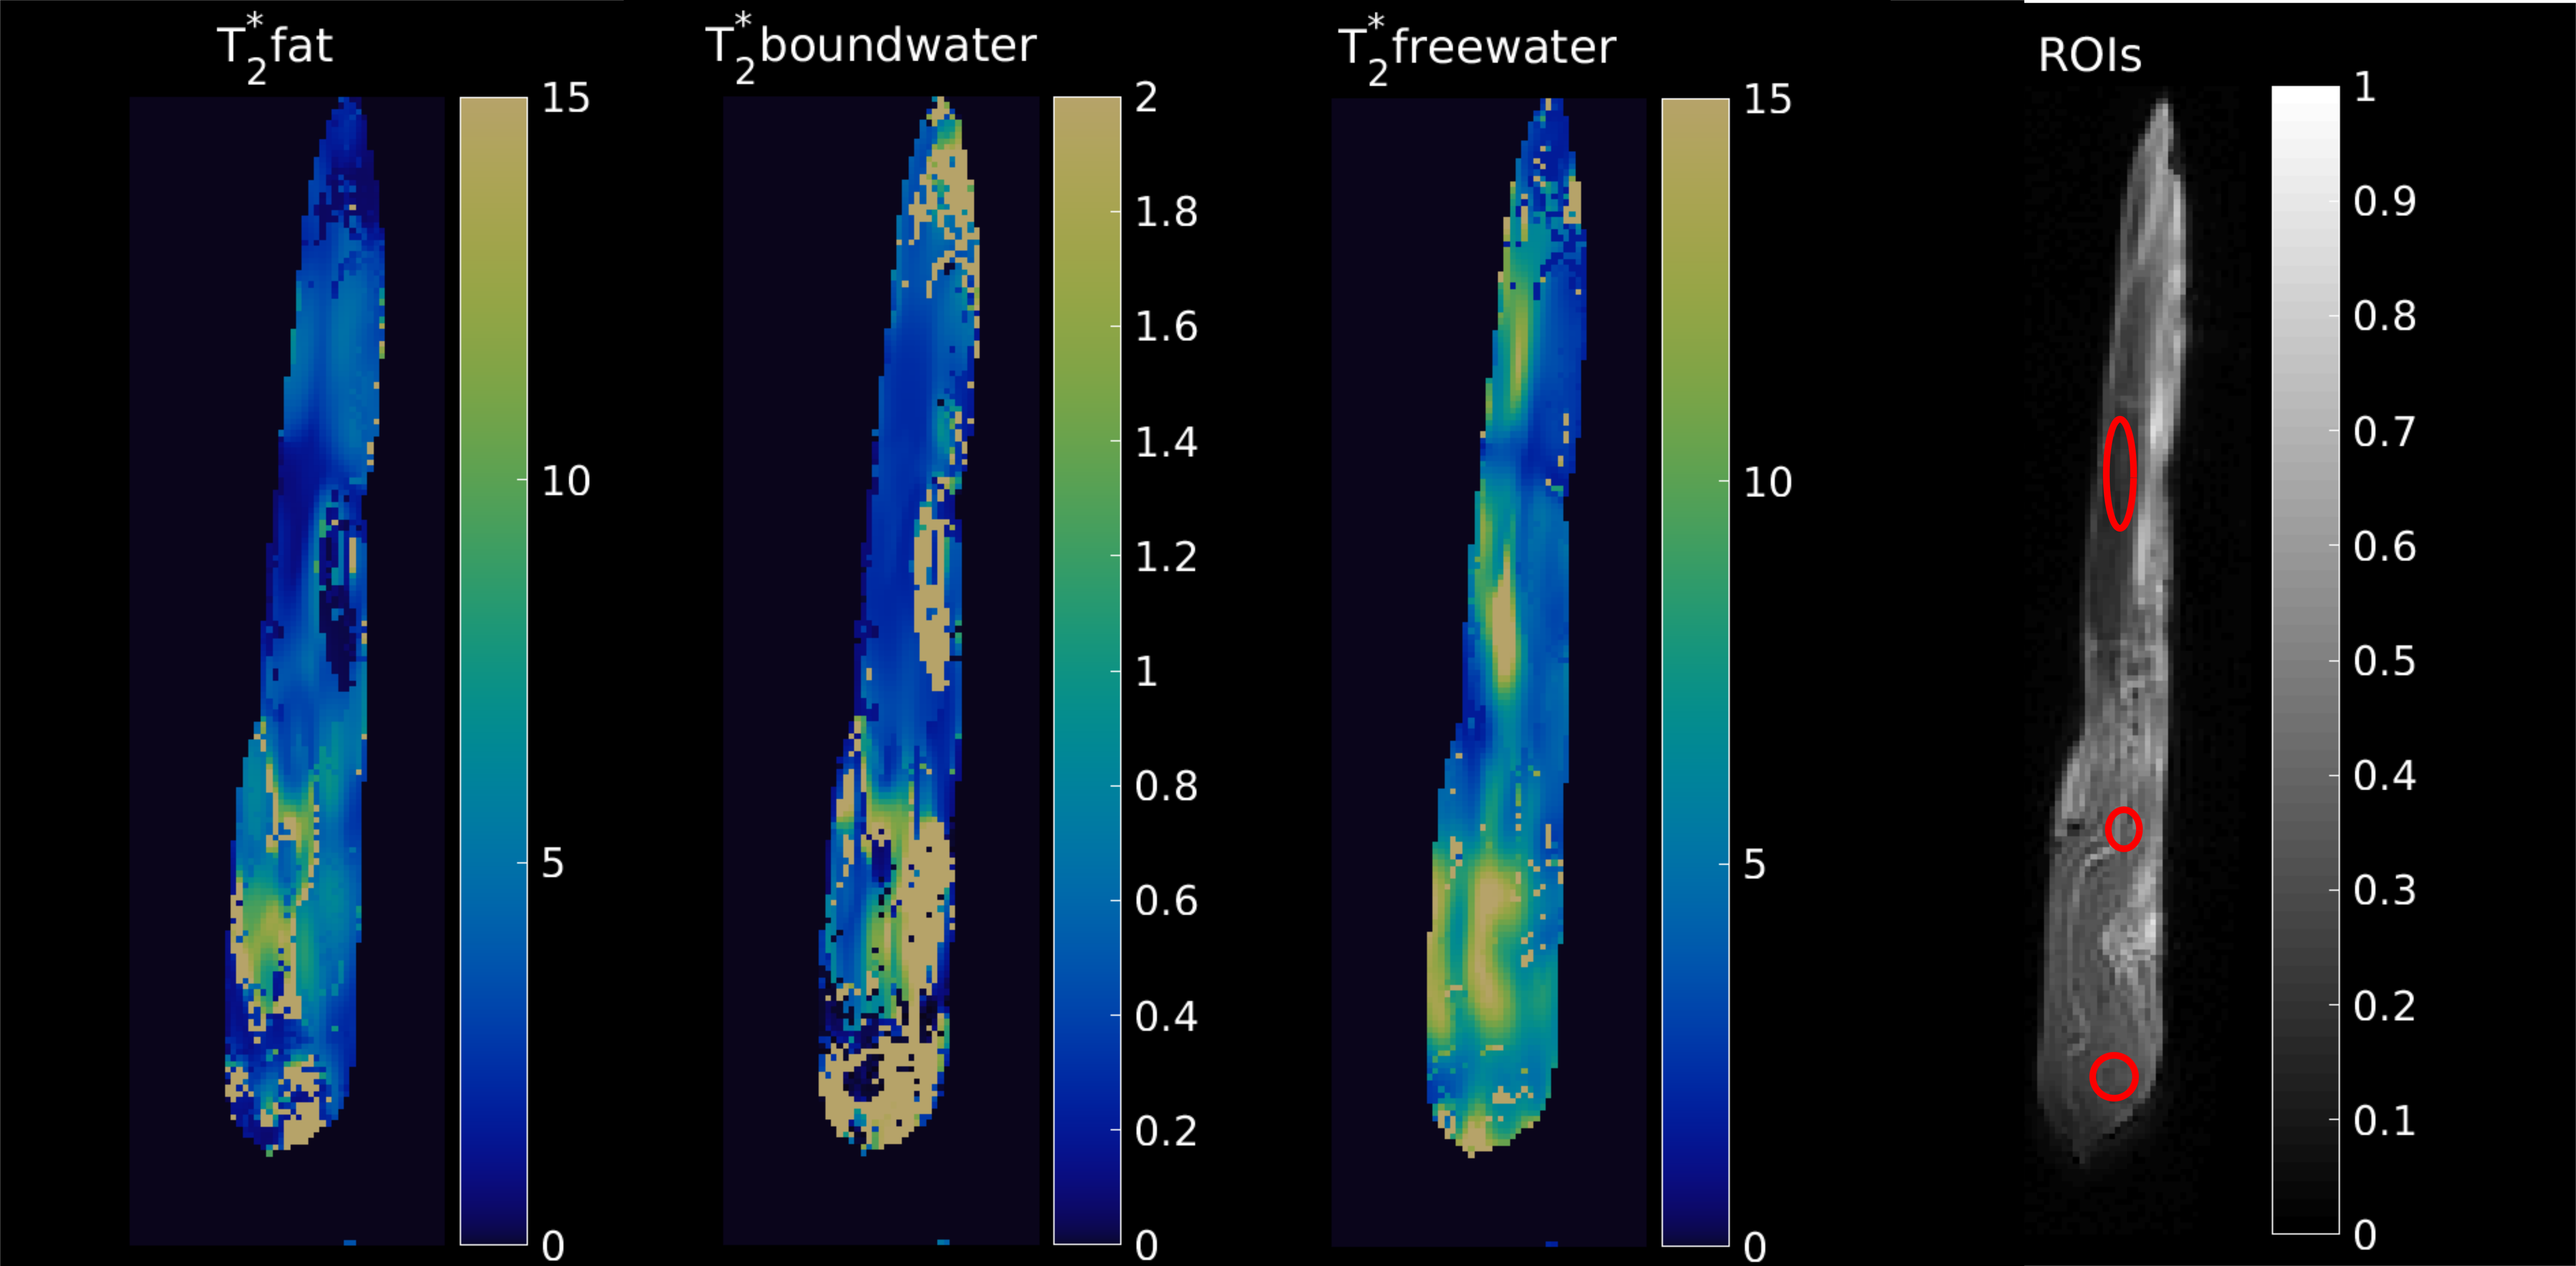
Figure
3: T2*-maps
for the three anticipated components; the short T2*
contribution from the tendon is clearly seen. The maps are scaled
between 0-15 ms, 0-2 ms, and 0-15 ms for the fat, short bound water
and free water components, respectively.
On the right side, the ROIs used for
the extraction of the T2*
values are overlaid on the magnitude image.
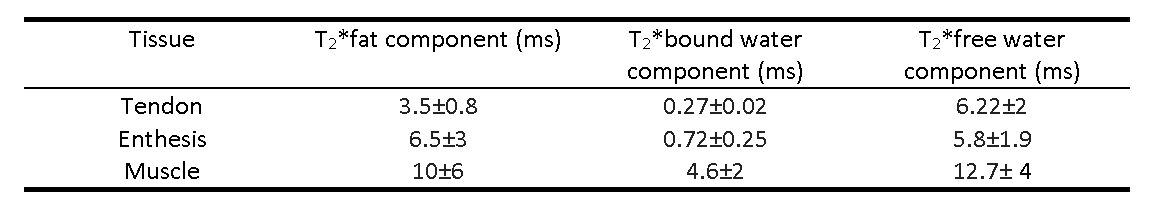
Table 1: Summary table for the T2* values for ROIs in the tendon, enthesis and muscle regions.