2816
Immersion of ex vivo Achilles tendon in phosphate buffered saline influences their T1 and T2* relaxation times
Martin Krämer1, Matthias R Kollert2,3, Nicholas M Brisson2, Marta B Maggioni1, Georg N Duda2,3, and Jürgen R Reichenbach1
1Medical Physics Group, Institute of Diagnostic and Interventional Radiology, Jena University Hospital - Friedrich Schiller University Jena, Jena, Germany, 2Julius Wolff Institute and Center for Musculoskeletal Surgery, Charité – Universitätsmedizin Berlin, Berlin, Germany, 3Berlin-Brandenburg Center and School for Regenerative Therapies, Charité – Universitätsmedizin Berlin, Berlin, Germany
1Medical Physics Group, Institute of Diagnostic and Interventional Radiology, Jena University Hospital - Friedrich Schiller University Jena, Jena, Germany, 2Julius Wolff Institute and Center for Musculoskeletal Surgery, Charité – Universitätsmedizin Berlin, Berlin, Germany, 3Berlin-Brandenburg Center and School for Regenerative Therapies, Charité – Universitätsmedizin Berlin, Berlin, Germany
Synopsis
Controlling tissue integrity and hydration levels is a crucial step when preparing and measuring ex vivo samples of tendons. In this work, we immersed ex vivo Achilles tendons in phosphate buffered saline solution and measured T1 and T2* relaxation times at baseline, 30 h and 67 h after immersion using 3D ultra-short echo-time imaging with variable flip angles and echo-train shifted multi-echo acquisition, respectively. Results based on regions-of-interest in mid-tendon and enthesis areas showed a significant increase in both T1 and T2* after 30 h of immersion in the phosphate buffered saline solution.
Introduction
Robust relaxation parameter mapping from ex vivo samples requires close control of hydration to ensure tissue integrity and consistent measurement conditions over long periods of time. To maintain proper hydration of ex vivo tendons, the samples should be immersed in a solution. To this end, various solutions have been proposed; however, many appear to influence the tissue relaxation times1,2,3. In this work, we investigated the effect of immersing ex vivo ovine Achilles tendon tissue in phosphate-buffered saline (PBS) on T1 and T2* relaxation times.Methods
Fresh Achilles tendons from eight healthy sheep (Merino, female, 4+ years old) were excised after euthanasia in compliance with the ethical guidelines of the legal, local animal rights protection authorities (Landesamt für Gesundheit und Soziales Berlin). The tendons were excised near the calcaneus and thus contained part of the mid-tendon together with adjacent fibrocartilaginous enthesis tissue. The samples were wrapped in plastic wrap and stored at 4°C in a moist environment to avoid dehydration until the MRI measurements. For the MRI experiments, the samples were removed from the plastic wrap, transferred from the centrifuge tubes to similar tubes filled with PBS (Dulbecco's Phosphate-Buffered Saline, Sigma-Aldrich, Taufkirchen, Germany), and immediately positioned in the MRI scanner (within 10 minutes).To estimate T1, a single-echo 3D-UTE acquisition (TE = 0.15 ms) was repeated while varying the flip angle (VFA)4 (34°, 26°, 19°, 14°, 11°, and 5°). To calculate T1 relaxation time maps from the 6 scans with different flip angles, a two-parameter fit to the signal equation of a fast low-angle shot (FLASH) gradient-echo MRI sequence was performed5. To estimate T2*, an echo-train shifted6 monopolar multi-echo (ETSME) 3D-UTE imaging sequence5 was used with TE of 0.15 ms, 0.35 ms, 0.60 ms, 1.77 ms, 1.97 ms, and 2.22 ms. To map T2* from these 6 echoes, a squared exponential fit was applied voxel-wise to the corresponding power images, including an additional offset parameter to account for potential noise bias7. All tendon samples were measured simultaneously, with laboratory tubes positioned next to one another and wrapped between the two elements of a 16 channel NORAS Variety flex measurement coil (NORAS MRI products GmbH, Höchberg, Germany). Measurements were performed with a 3T whole-body MRI scanner (Magnetom PRISMA, Siemens Healthineers, Erlangen, Germany). For 3D-UTE imaging, non-selective hard pulse excitation and spikey-ball trajectories were used8. Acquisition parameters were: 192 × 148 × 58 matrix, (180 × 139 × 55) mm³ field of view, (0.95 × 0.95 × 0.95) mm³ spatial resolution. For the ETSME acquisitions, a flip angle of 15° and TR of 5.5 ms were used; whereas for the VFA acquisition, a longer repetition time was used (TR = 9.4 ms). Three measurements blocks of VFA and echo-train shifted multi-echo, each 65 minutes in duration, were conducted: at baseline (0 h), 30 h and 67 h after filling the laboratory tubes with PBS. Images were reconstructed offline with MATLAB (The MathWorks, Inc., Natick, Massachusetts, United States of America) using re-gridding with iterative sampling density compensation and an optimized kernel9. After calculation of relaxation parameter maps, regions-of-interest were manually drawn in the mid-tendon and enthesis regions of all samples.
Results
Exemplary VFA and ETSME curves and corresponding fit results for T1 and T2* estimations are displayed in Figures 1 and 2, respectively. When comparing the obtained relaxation times for all samples and measurement time points (Figs. 3 and 4), significant increases in both T1 and T2* were observed for the mid-tendon (pT1=0.004, pT2*=0.002) and enthesis regions (pT1=0.002, pT2*=0.002) after 30 h of immersion in PBS. For T2*, a further significant increase between 30 h and 67 h of PBS immersion was found in both mid-tendon (p=0.002) and enthesis (p=0.002) regions. In contrast, changes in T1 relaxation times between 30 h and 67 h were not significant in the same tendon regions (p>0.05)Discussion and Conclusion
In this study, significant increases in both T1 and T2* were observed after immersing the ovine Achilles tendon samples in PBS. Our findings contrast with those from Chang et al.10, who reported no increase in T2* for ex vivo human Achilles tendon following immersion in PBS. The latter study, however, investigated samples that had been deep-frozen and then thawed. This process could modify or disrupt the microstructure of the extracellular matrix and change the water-binding properties in the tendon11, thereby altering its ability to interact with PBS. In addition, it appears that the T1 and T2* values of the tendons start to saturate after 67 h of immersion in PBS. However, to truly identify a possible saturation behavior (i.e., extracting saturation time constants), more than three time points are required for a reliable fitting. In conclusion, this work has shown a strong effect of PBS on the measured relaxation times of the tendon tissue and emphasizes the importance of closely controlling the handling and hydration of samples not only before but also during MRI experiments. Sample handling and transportation should be standardized as the embedding solution (here PBS) can impact the relaxation times. Thus, comparisons across groups of samples and within samples should be aware of this sensitivity and account for it.Acknowledgements
We acknowledge technical assistance with tissue harvesting from Svenja Kasselmann and Dr. Katja Reiter (Charité – Universitätsmedizin Berlin)References
- Fishbein KW, Canuto HC, Bajaj P, el al. Optimal methods for the preservation of cartilage samples in MRI and correlative biochemical studies. Magn Reson Med. 2007;57(5):866–873.
- Hales PW, Burton RAB, Bollensdorff C, et al. Progressive changes in T1, T2 and left-ventricular histo-architecture in the fixed and embedded rat heart. NMR Biomed. 2011;24(7):836–843.
- Zheng S, Xia Y. Changes in Proton Dynamics in Articular Cartilage Caused by Phosphate Salts and Fixation Solutions. Cartilage. 2010;1(1):55–64.
- Fram EK, Herfkens RJ, Johnson G, et al. Rapid calculation of T1 using variable flip angle gradient refocused imaging. Magn Reson Imaging 1987;5(3):201–208.
- Krämer M, Maggioni MB, Brisson NM, et al. T1 and T2* mapping of the human quadriceps and patellar tendons using ultra-short echo-time (UTE) imaging and bivariate relaxation parameter-based volumetric visualization. Magn Reson Imaging. 2019;63:29–36.
- Feinberg DA, Oshio K. Gradient-echo shifting in fast MRI techniques (ERASE imaging) for correction of field inhomogeneity errors and chemical shift. J Magn Reson (1969). 1992;97(1):177 – 183.
- Henkelman RM. Measurement of signal intensities in the presence of noise in MR images: Technical Reports: Signal intensities in MR image noise. Med Phys. 1985;12(2):232–233.
- Herrmann KH, Krämer M, Reichenbach JR. Time Efficient 3D Radial UTE Sampling with Fully Automatic Delay Compensation on a Clinical 3T MR Scanner. PLoS One. 2016;Mar14;11(3):e0150371.
- Zwart NR, Johnson KO, Pipe JG. Efficient sample density estimation by combining gridding and an optimized kernel. Magn Reson Med. 2012;67(3):701–710.
- Chang EY, Du J, Bae WC, et al. Effects of achilles tendon immersion in saline and perfluorochemicals on T2 and T2*. J Magn Reson Imaging. 2014;40(2):496–500
- Pownder SL, Shah PH, Potter HG, Koff MF. The effect of freeze-thawing on magnetic resonance imaging T2* of freshly harvested bovine patellar tendon. Quant Imaging Med Surg. 2015;5(3):368–373
Figures
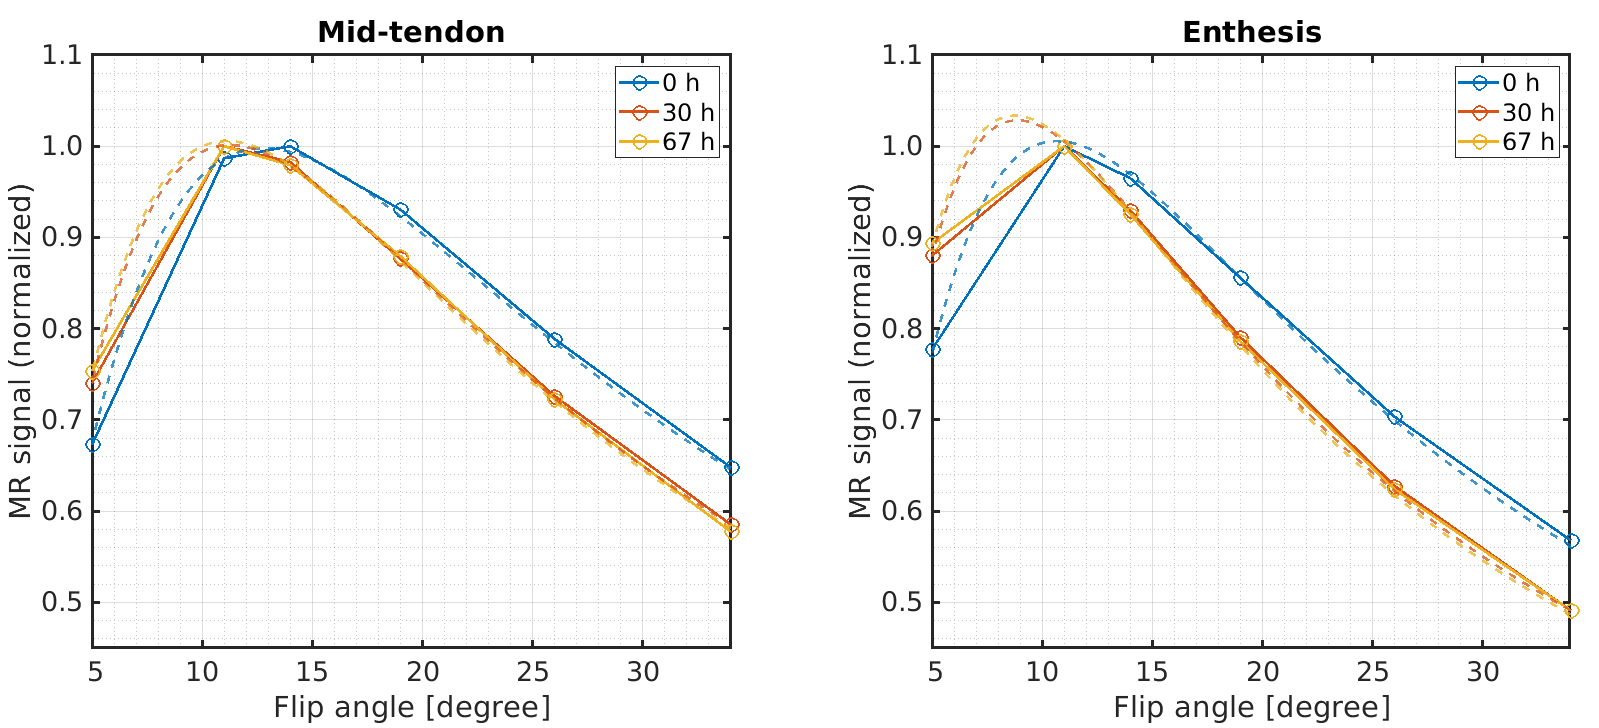
Dependency
of the MR signal on the flip angle and corresponding curve-fitting
results (dashed lines) used for T1
estimation. Results are shown for one exemplary sample at baseline
(blue) and after 30 h (red) and 67 h (yellow) of immersion in PBS.
The signals were normalized to the individual maximum of the curves.
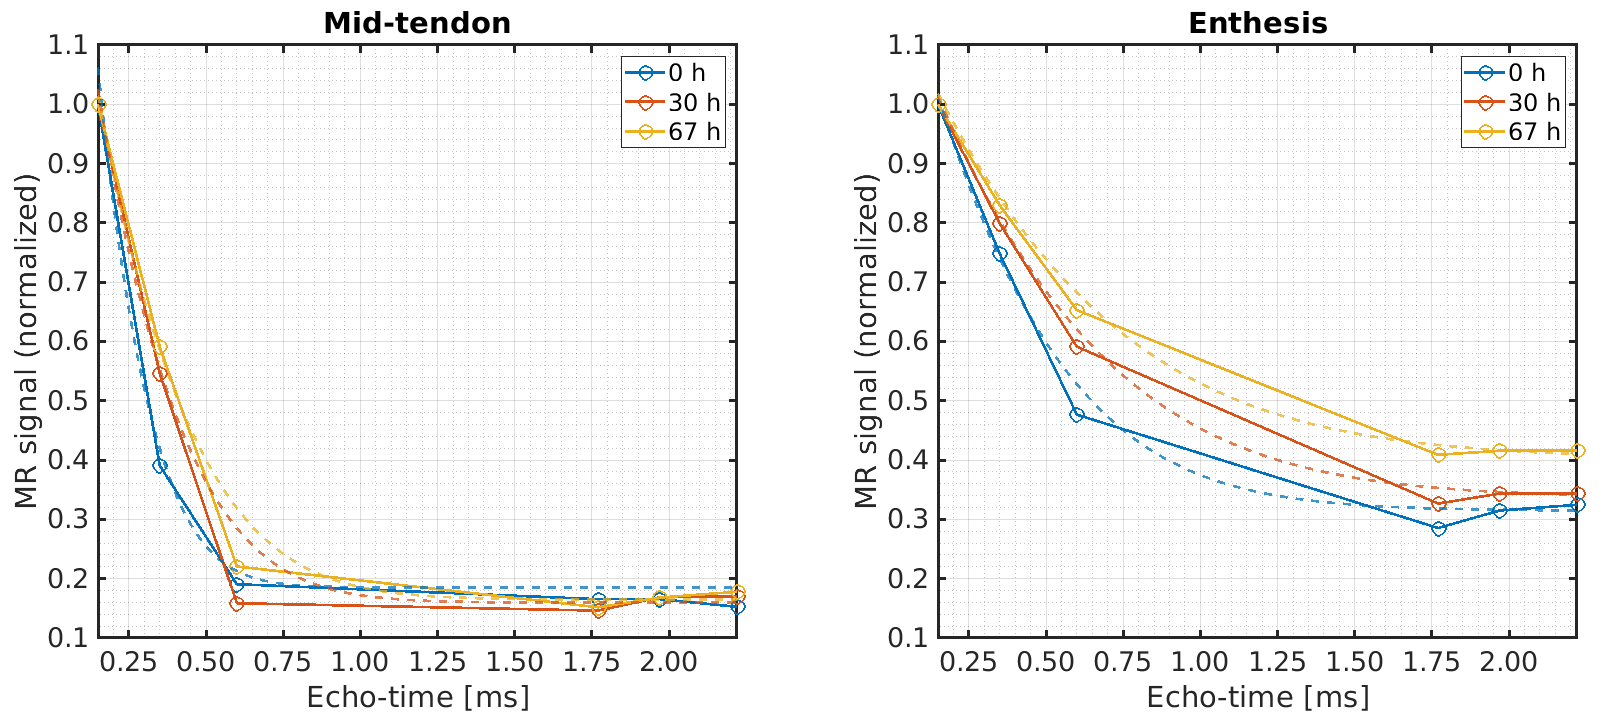
Decay of the
transverse magnetization and corresponding T2*
curve fitting results (dashed lines) for the mid-tendon and enthesis
regions, respectively, of one exemplary tendon sample at baseline
(blue) and after 30 h (red) and 67 h (yellow) immersion in PBS.
Signals were normalized to the individual maximums of the decay
curves.
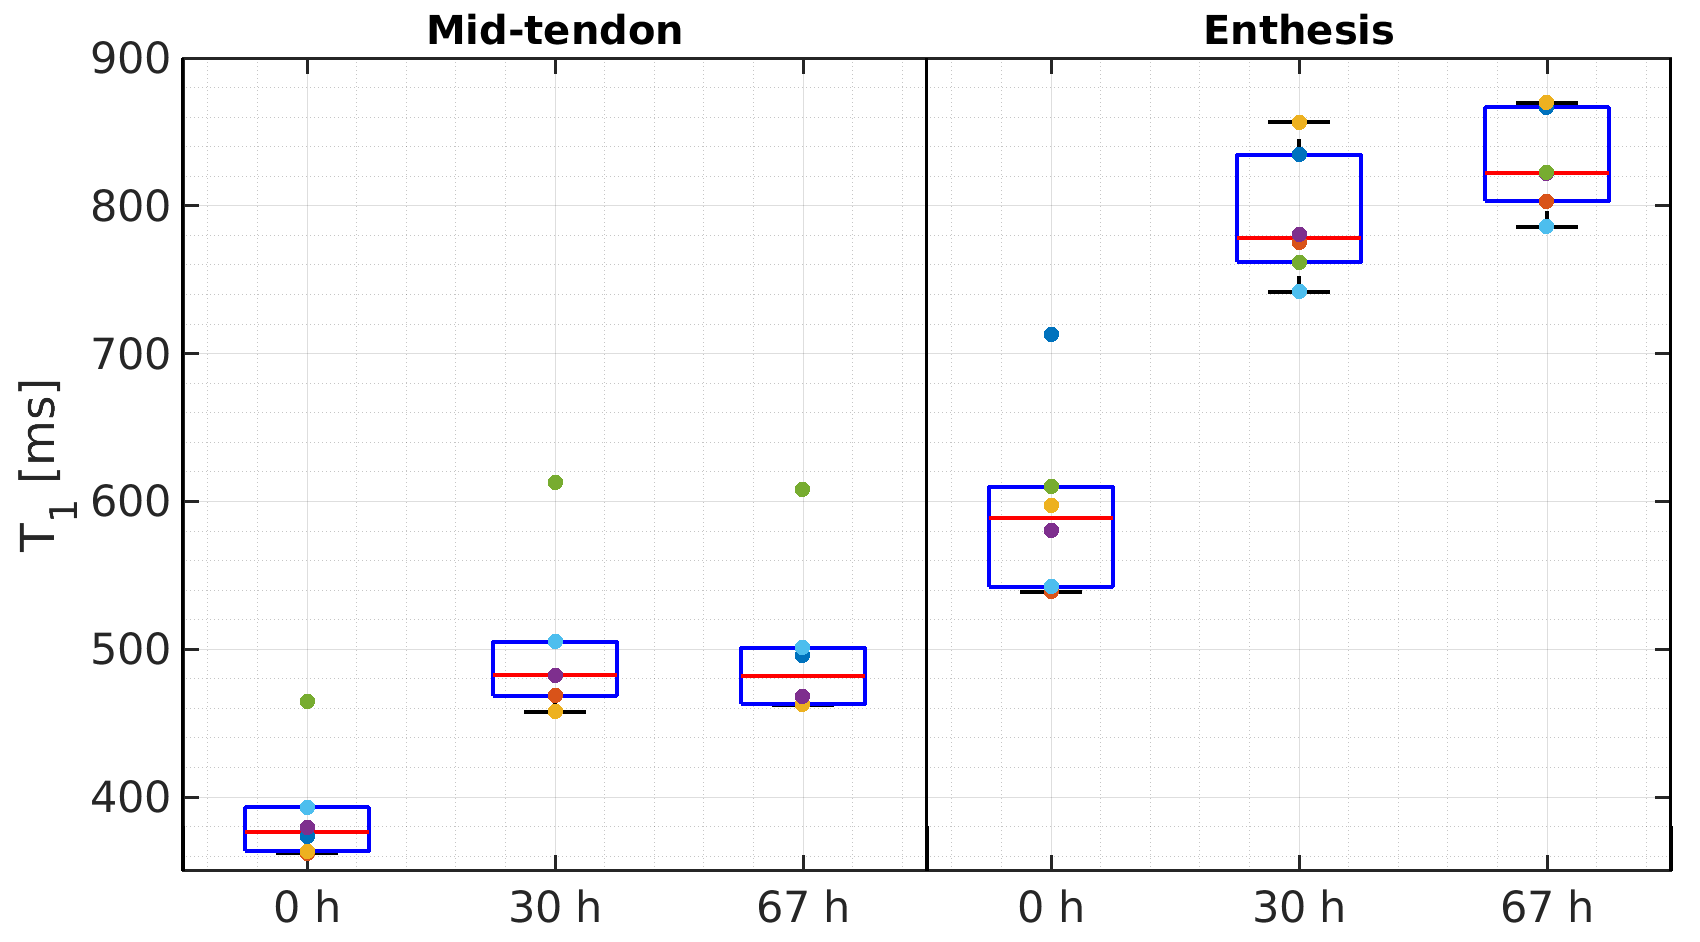
Box plots
showing the estimated T1
relaxation times from a region of interest in the mid-tendon and
enthesis at baseline, 30 h and 67 h after immersion in PBS.
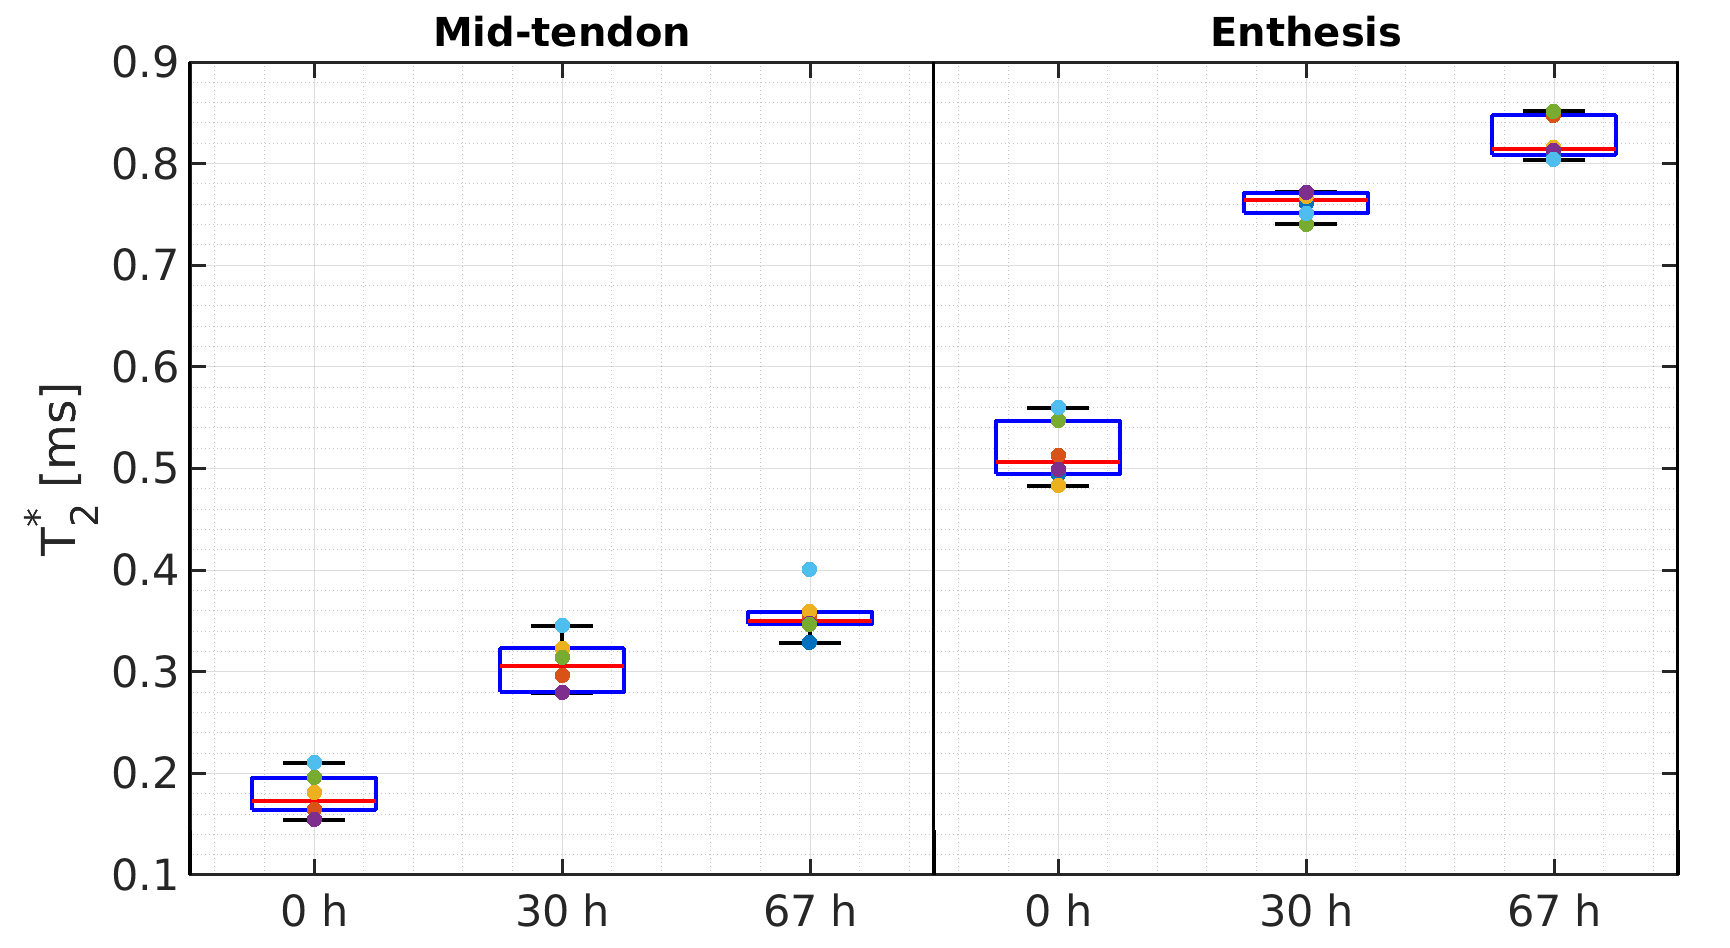
Box plots
showing the estimated T2*
relaxation times from a region of interest in the mid-tendon and
enthesis at baseline and 30 h and 67 h after immersion in PBS.