2813
Stirring STIR contrast1UCL Queen Square Institute of Neurology, London, United Kingdom, 2MRC Centre for Neuromuscular Diseases, London, United Kingdom, 3King's College London, London, United Kingdom
Synopsis
In vivo lower-limb STIR images were compared with images simulated using a theoretical signal model with experimentally determined muscle-water T2 and fat fraction values. Nominally T2-weighted STIR contrast is seen to depend on changing tissue-water relative proton density as fat content increases in diseased muscle, in addition to expected T2 dependent changes. Imperfect inversion-recovery fat nulling may also cause unexpected hyper-intensity in regions of high fat content. These observations may have implications for the clinical interpretation of STIR signal intensity.
Introduction
Nominally T2-weighted short tau inversion recovery (STIR) imaging is useful in radiological assessment of neuromuscular pathologies, with hyper-intensity in muscle interpreted as reflecting increased water content due to inflammation or increased blood flow3,4. Systematic grading of changes on STIR MRI has been used as a semi-quantitative disease severity index1, complementing Mercuri grading of T1-w images2. Here we show that, in fat-infiltrated tissue, STIR signal intensity (SI) may be strongly affected by factors independent of muscle waterT2 , specifically the relative proton density (PD) of fat and water in each voxel, as well as imperfect fat signal nulling.Aims
To better characterise the sources of STIR image contrast, in addition to water T2 changes, in conditions involving intramuscular fat accumulation.Methods
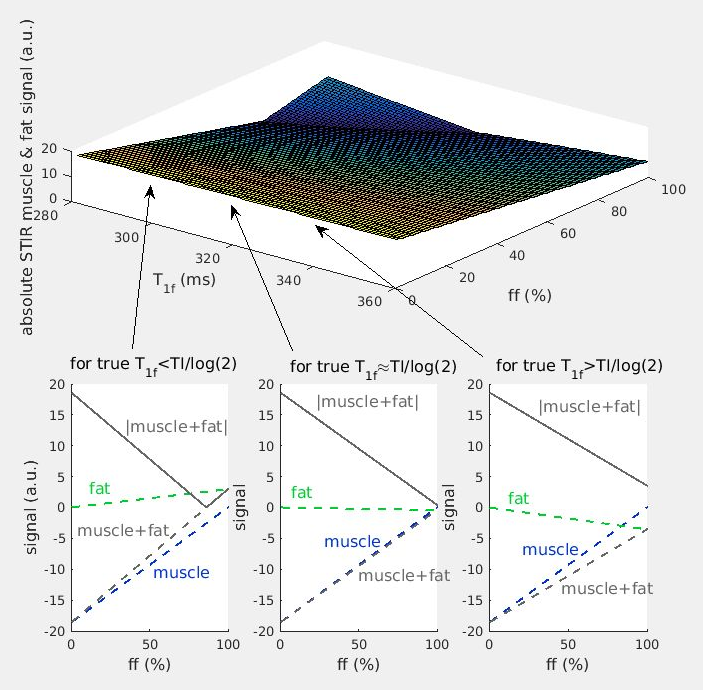
STIR image contrast may be predicted from the inversion recovery sequence signal equation, assuming non-exchanging water and fat compartments, and that the respective relaxation times are known.$$sSTIR=α·ff·[1-2·exp(-TI/T1f)+exp(-TR/T1f)]·exp(-TE/T2f) + α·(1-ff)·[1-2·exp(-TI/T1m)+exp(-TR/T1m)]·exp(-TE/T2m)$$
Here sSTIR is the STIR signal intensity for a particular pixel, α a global proton density (scaled by instrumental factors), TI the inversion time, TR the sequence repetition time, TE the echo time, T1m, T2m, T1f, T2f the T1 and T2 decay constants for water and fat respectively and ff the fat fraction. The theoretical dependence of the sSTIR signal upon ff, and T1f deviation from as assumed nominal value of 320ms was first examined graphically. To further elucidate the origins of STIR contrast, unprocessed in vivo STIR images were compared with simulated images with values of α, T2 and ffa (‘apparent’ ff) estimated from independent T2 CPMG relaxometry acquisitions. T2-weighted STIR images (3T Siemens Prisma, TR = 5200 ms, TE = 39 ms, TI = 220 ms, NSA = 1, iPAT = 2, 31 slices, FOV = 420 mm, voxel size = 1.1 × 1.1 × 6.0 mm, slice gap = 6 mm) were acquired at the mid-thigh level for both limbs. The prescribed TI of 220ms implied an assumed T1f of 320ms. CPMG T2 relaxometry (with 22 echoes CPMG with TE between 10 and 220ms), with T2m, α and ff estimated by fitting a slice profile corrected EPG model5, and 2D Dixon MRI to provide an independent ff estimate were acquired from the same slice locations. Synthetic STIR images were calculated using the above equation with experimentally determined T2m and ff values, TR, TE and TI identical to the in vivo protocol, and T2f and T1m fixed to commonly accepted values of 137ms and 1400ms respectively6; T1f was fixed to the above STIR TI-indicated 320ms value.
Results
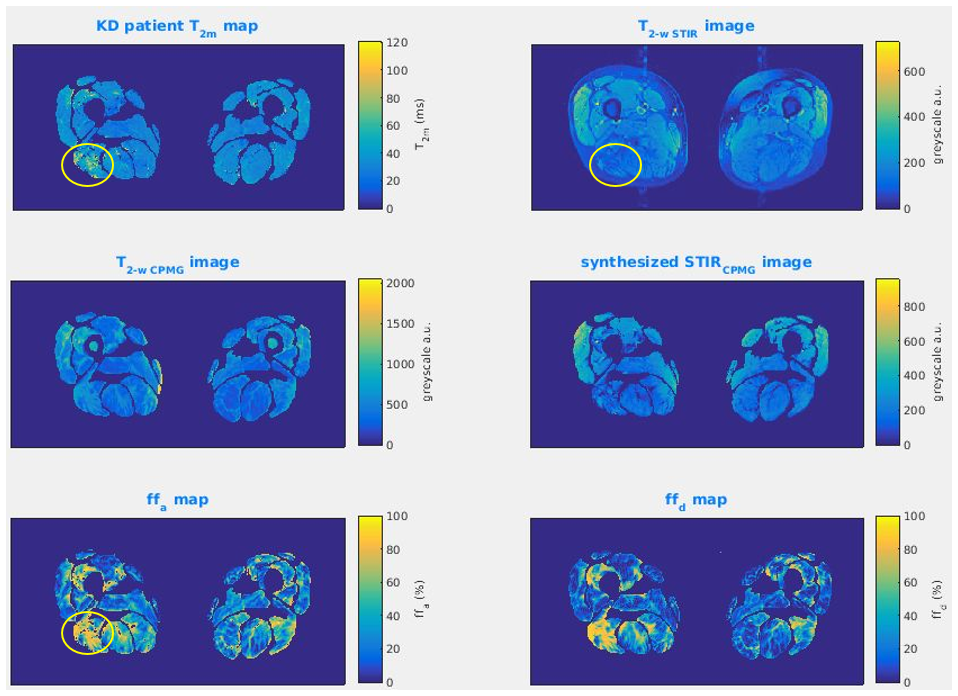
The theoretical dependence of sSTIR upon ff and T1f is shown in Figure 1 for a fixed T2m of 30ms, including departures from the TI≈T1f·log(2) condition necessary for full nulling of the fat signal. As the fat content increases, there is an approximately linear decrease in the STIR SI, with the potential to mask coincident expected hyper-intensity due to T2 increases. At high ff, deviation of the T1f value from the nulling condition may cause unexpected signal hyper-intensity.Figure 2 shows a patient case where STIR hyper-intensity was not matched by a concomitant T2m increase. The synthetic STIR image however was similar in appearance to the true STIR image, suggesting the STIR hyper-intensity in that region was due to either locally increased a or decreased ff.
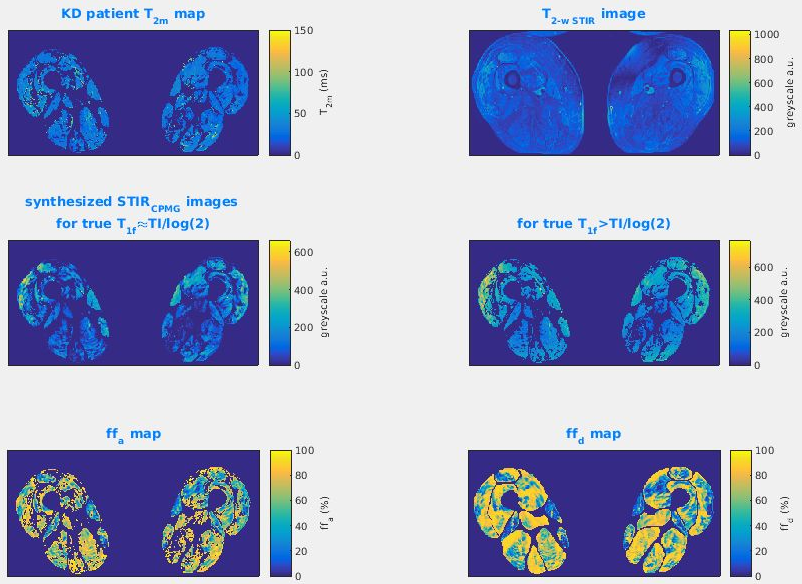
Figure 3 illustrates the converse situation, where a region of T2m elevation indicated on the T2m map was not matched with STIR hyper-intensity. This lack of STIR SI change was caused by elevated fat content in this region reducing the effective water proton density, therefore masking the effect of increased T2m. This was confirmed by inspection of the ff maps, and the correspondence of the synthetic and true STIR images.
Figure 4 illustrates for the case of severe fat infiltration the hypothetical effects of a mismatch between the TI and the true T1f, producing artefactual STIR SI elevation.
Discussion
STIR contrast may be affected by loss of tissue water proton density due to water replacement by fat in certain regions. This may mask expected STIR SI increases due to T2m increases in the same area. On the other hand B1 transit or receive coil non-uniformity may cause apparent STIR hyperintensity in regions where in fact T2m is normal. Imperfect fat suppression can also have a mild effect, causing STIR hyper-intensity, independent of T2m, in regions of high ff. These observations suggest that STIR contrast interpretation may be improved by comparison with quantitative T2 maps. While semi-quantitative STIR signal intensity grading has been shown to be a useful index of severity of involvement, addressing the potential confounds we have identified in this work may improve sensitivity in future investigations.Conclusions
STIR contrast in diseased muscle is complex, depending on the effective muscle water proton density, which decreases as fat content increases, as well as oedema related changes in T2m. Alternative methods, such as Dixon fat-water separated T2-weighted imaging, may provide image contrast which is more straightforward to interpret.Acknowledgements
Supported by
an EPSRC CASE studentship award with industrial partner GlaxoSmithKline
the MRC Centre for Neuromuscular Diseases
the UCLH NIHR Biomedical Research Centre
References
1. Morrow, J.M., Matthews, E., Rayan, D.L.R., Fischmann, A., Sinclair, C.D., Reilly, M.M., Thornton, J.S., Hanna, M.G. and Yousry, T.A., 2013. Muscle MRI reveals distinct abnormalities in genetically proven non-dystrophic myotonias. Neuromuscular Disorders, 23(8), pp.637-646.
2. Mercuri, E., Cini, C., Counsell, S., Allsop, J., Zolkipli, Z., Jungbluth, H., Sewry, C., Brown, S.C., Pepe, G. and Muntoni, F., 2002. Muscle MRI findings in a three-generation family affected by Bethlem myopathy. European Journal of Paediatric Neurology, 6(6), pp.309-314.
3. Kumar, Y., Wadhwa, V., Phillips, L., Pezeshk, P., and Chhabra, A. (2016). MR imaging of skeletal muscle signal alterations: systematic approach to evaluation. European journal of radiology, 85(5), pp.922-935.
4. Lovitt, S., Moore, S.L. and Marden, F.A., 2006. The use of MRI in the evaluation of myopathy. Clinical neurophysiology, 117(3), pp.486-495.
5. Zafeiropoulos, N, 2018. Improved muscle T2 estimation by maximum-likelihood parameter estimation using an extended-phase-graph signal model with locally estimated Rician noise levels. ISMRM 2018 abstract 2763.
6. Marty, B., Baudin, P.Y., Reyngoudt, H., Azzabou, N., Araujo, E.C., Carlier, P.G. and de Sousa, P.L., 2016. Simultaneous muscle water T2 and fat fraction mapping using transverse relaxometry with stimulated echo compensation. NMR in biomedicine, 29(4), pp.431-443.
Figures