2808
Volumetric tendon segmentation using ultra-short echo-time (UTE) imaging and bivariate relaxation parameter-based histogram analysis
Martin Krämer1, Marta B Maggioni1, and Jürgen R Reichenbach1
1Medical Physics Group, Institute of Diagnostic and Interventional Radiology, Jena University Hospital - Friedrich Schiller University Jena, Jena, Germany
1Medical Physics Group, Institute of Diagnostic and Interventional Radiology, Jena University Hospital - Friedrich Schiller University Jena, Jena, Germany
Synopsis
Segmentation of tendons based on MRI data is challenging because of their very short transverse relaxation times and typically curved structure as well as small diameter. In this work, we performed combined T2* and T1 mapping using multi-echo and variable flip angle ultra-short echo-time imaging. Based on the resulting relaxation parameter maps, bivariate histograms were calculated which showed distinct clusters that could be ascribed to various tissues. Ranges for both relaxation parameters were defined using these histograms and applied to volumetrically segment and subsequently visualize the patellar and quadriceps tendon.
Introduction
With recent advances and improved availability of ultra-short echo-time (UTE) imaging sequences1, musculoskeletal MRI is increasingly focusing on imaging of tendons. In particular, the quantification of relaxation parameters holds a high potential for the characterization of various diseases, such as tendinopathy, as well as the general condition of tendons2,3. One major challenge, however, is the segmentation and visualization of tendons, because they can be small compared to other tissues and can have curved structures. Segmentation of tendons is made even more difficult by the fact that UTE images typically show very little contrast between tissues due to the very short echo-times. In this work, we present an automated segmentation approach of the patellar and quadriceps tendons based on bivariate histograms of volumetrically measured T2* and T1 relaxation times.Methods
Data acquisition was performed using a 3D radial center-out UTE sequence with short hard-pulse excitation1. For T2* estimation, corresponding power images from a monopolar multi-echo readout with echo-times (TE) of 0.10ms, 2.48ms, and 4.90ms were fitted voxel-wise using a squared exponential function that included an additional offset parameter to account for potential noise bias4. T1 relaxation times were estimated from a variable flip angle acquisition using five flip angles of 5°,12°,20°,30°, and 38° and by performing a two-parameter fit to the fast low-angle shot (FLASH) gradient-echo signal equation3. Other acquisition parameters were: 80×61×50 matrix, (160×123×100)mm³ field of view, (2.0×2.0×2.0)mm³ isotropic spatial resolution, 20ms repetition-time and a 125kHz readout bandwidth. Measurements were performed on five volunteers, aged between 24 and 50 years old, without known pathologies on a 3T whole-body MRI scanner (Magnetom PRISMA, Siemens Healthineers) using a 16-channel NORAS Variety flex coil (NORAS MRI products GmbH). Images were reconstructed offline with MATLAB using re-gridding with iterative sampling density compensation and an optimized kernel5. Prior to further processing, the reconstructed 3D relaxation parameter maps were masked to exclude contributions from noise regions outside the knee. To calculate the bivariate histograms, the T1 and T2* relaxation times of all voxels were binned into equally sized bins. Clearly visible clusters in the histograms were manually outlined by drawing ROIs around them, and subsequently visualized using 3D surface reconstruction. To improve the masks resulting from this histogram analysis and to remove outliers, a connectivity analysis was performed prior to visualization, retaining only the largest connected components of the masks. Since no prominent cluster was found in the bivariate histogram located in the range of the expected T1 and T2* times of the patellar and quadriceps tendons, a ROI was placed in the histogram encompassing a rectangular region in the ranges of 1.0ms<T2*<3.0ms and 350ms<T1<900ms.Results
Maps of the T2* and T1 relaxation parameters are shown in Figure 1 for a single subject, demonstrating that both the patellar and quadriceps tendons were clearly identifiable. Since the longest echo-time was only 4.9 ms, the values obtained for other tissues with longer T2* are more uncertain and most likely underestimated. The bivariate histogram (Figure 2) revealed several well-delineated clusters, exhibiting similar relaxation parameters in the range of 150ms<T1<450ms and 3ms<T2*<7ms. Also visible is a broader cluster in the range of 800ms<T1<1500ms and 5ms<T2*<11ms. By separating and masking the bivariate histogram, the tissue types underlying the clusters became evident as shown in Figure 3. The narrow and sharp clusters between 150ms< T1<450ms and 3ms<T2*< 7ms mainly reflect bone marrow (Figure 3, blue) as well as fat and skin (Figure 3, green), while the broader cluster with higher T1 values (Figure 3, yellow) can be attributed to muscle tissue. By placing an ROI in the range of 1.0ms<T2*<3.0ms and 350ms<T1<900ms in the bivariate histogram, the patellar and quadriceps tendons could also be extracted (Figure 3, red). Based on the segmentation of both tendons (Figure 3, red), a color-coded 3D volumetric rendering was created to visualize the distributions of T1 and T2* values over the entire tendon volume (Figure 4), including parts of the entheses. Inspection of these volumetric renderings indicates that T1 is not constant over the volume of the tendons, but contains “hot spots” in some subjects as well as an increase in the relaxation times towards the entheses.Discussion and Conclusion
Using bivariate histograms of T2* and T1 for 3D segmentation of the quadriceps and patellar tendons allowed for a fully automated approach and required only one-time user interaction to define the relaxation time bins used for segmentation of the tendon voxels. Visualizing volumetric relaxation maps holds the potential for future studies to assess these parameters not only over manually selected region-of-interests, but across the entire tendon volume. As demonstrated (Figure 4), T1 within the tendons varies individually, implying that placement and size of any region-of-interest based analysis highly affects mean values. Our results suggest that a bivariate histogram analysis can also be applied to other tissues types, such as fat or muscles. For this purpose, however, acquisition of data with longer echo-times would be recommendable to avoid underestimation of T2* and compression of the T2* bins along the x-axis of the histograms. Additionally, further optimized and accelerated6,7 protocols for faster T1 mapping would help to reduce the relatively long scan time of currently 22 minutes or alternatively to increase spatial resolutionAcknowledgements
No acknowledgement found.References
- Herrmann KH, Krämer M, Reichenbach JR. Time Efficient 3D Radial UTE Sampling with Fully Automatic Delay Compensation on a Clinical 3T MR Scanner. PLoS One. 2016;Mar14;11(3):e0150371.
- Ma Y-J, Lu X, Carl M, et al. Accurate T1 mapping of short T2 tissues using a three-dimensional ultrashort echo time cones actual flip angle imaging-variable repetition time (3D UTE-Cones AFI-VTR) method. Magn Reson Med 2018;80(2):598–608.
- Krämer M, Maggioni MB, Brisson NM, et al. T1 and T2* mapping of the human quadriceps and patellar tendons using ultra-short echo-time (UTE) imaging and bivariate relaxation parameter-based volumetric visualization. Magn Reason Imaging. 2019;63:29–36.
- Henkelman RM. Measurement of signal intensities in the presence of noise in MR images: Technical Reports: Signal intensities in MR image noise. Med Phys. 1985;12(2):232–233.
- Zwart NR, Johnson KO, Pipe JG. Efficient sample density estimation by combining gridding and an optimized kernel. Magn Reason Med. 2012;67(3):701–710.
- Pruessmann KP, Weiger M, Börnert P, et al. Advances in sensitivity encoding with arbitrary k -space trajectories. Magn Reson Med 2001;46(4):638–51.
- Lustig M, Donoho D, Pauly JM. Sparse MRI: The application of compressed sensing for rapid MR imaging. Magn Reson Med 2007;58(6):1182–95
Figures
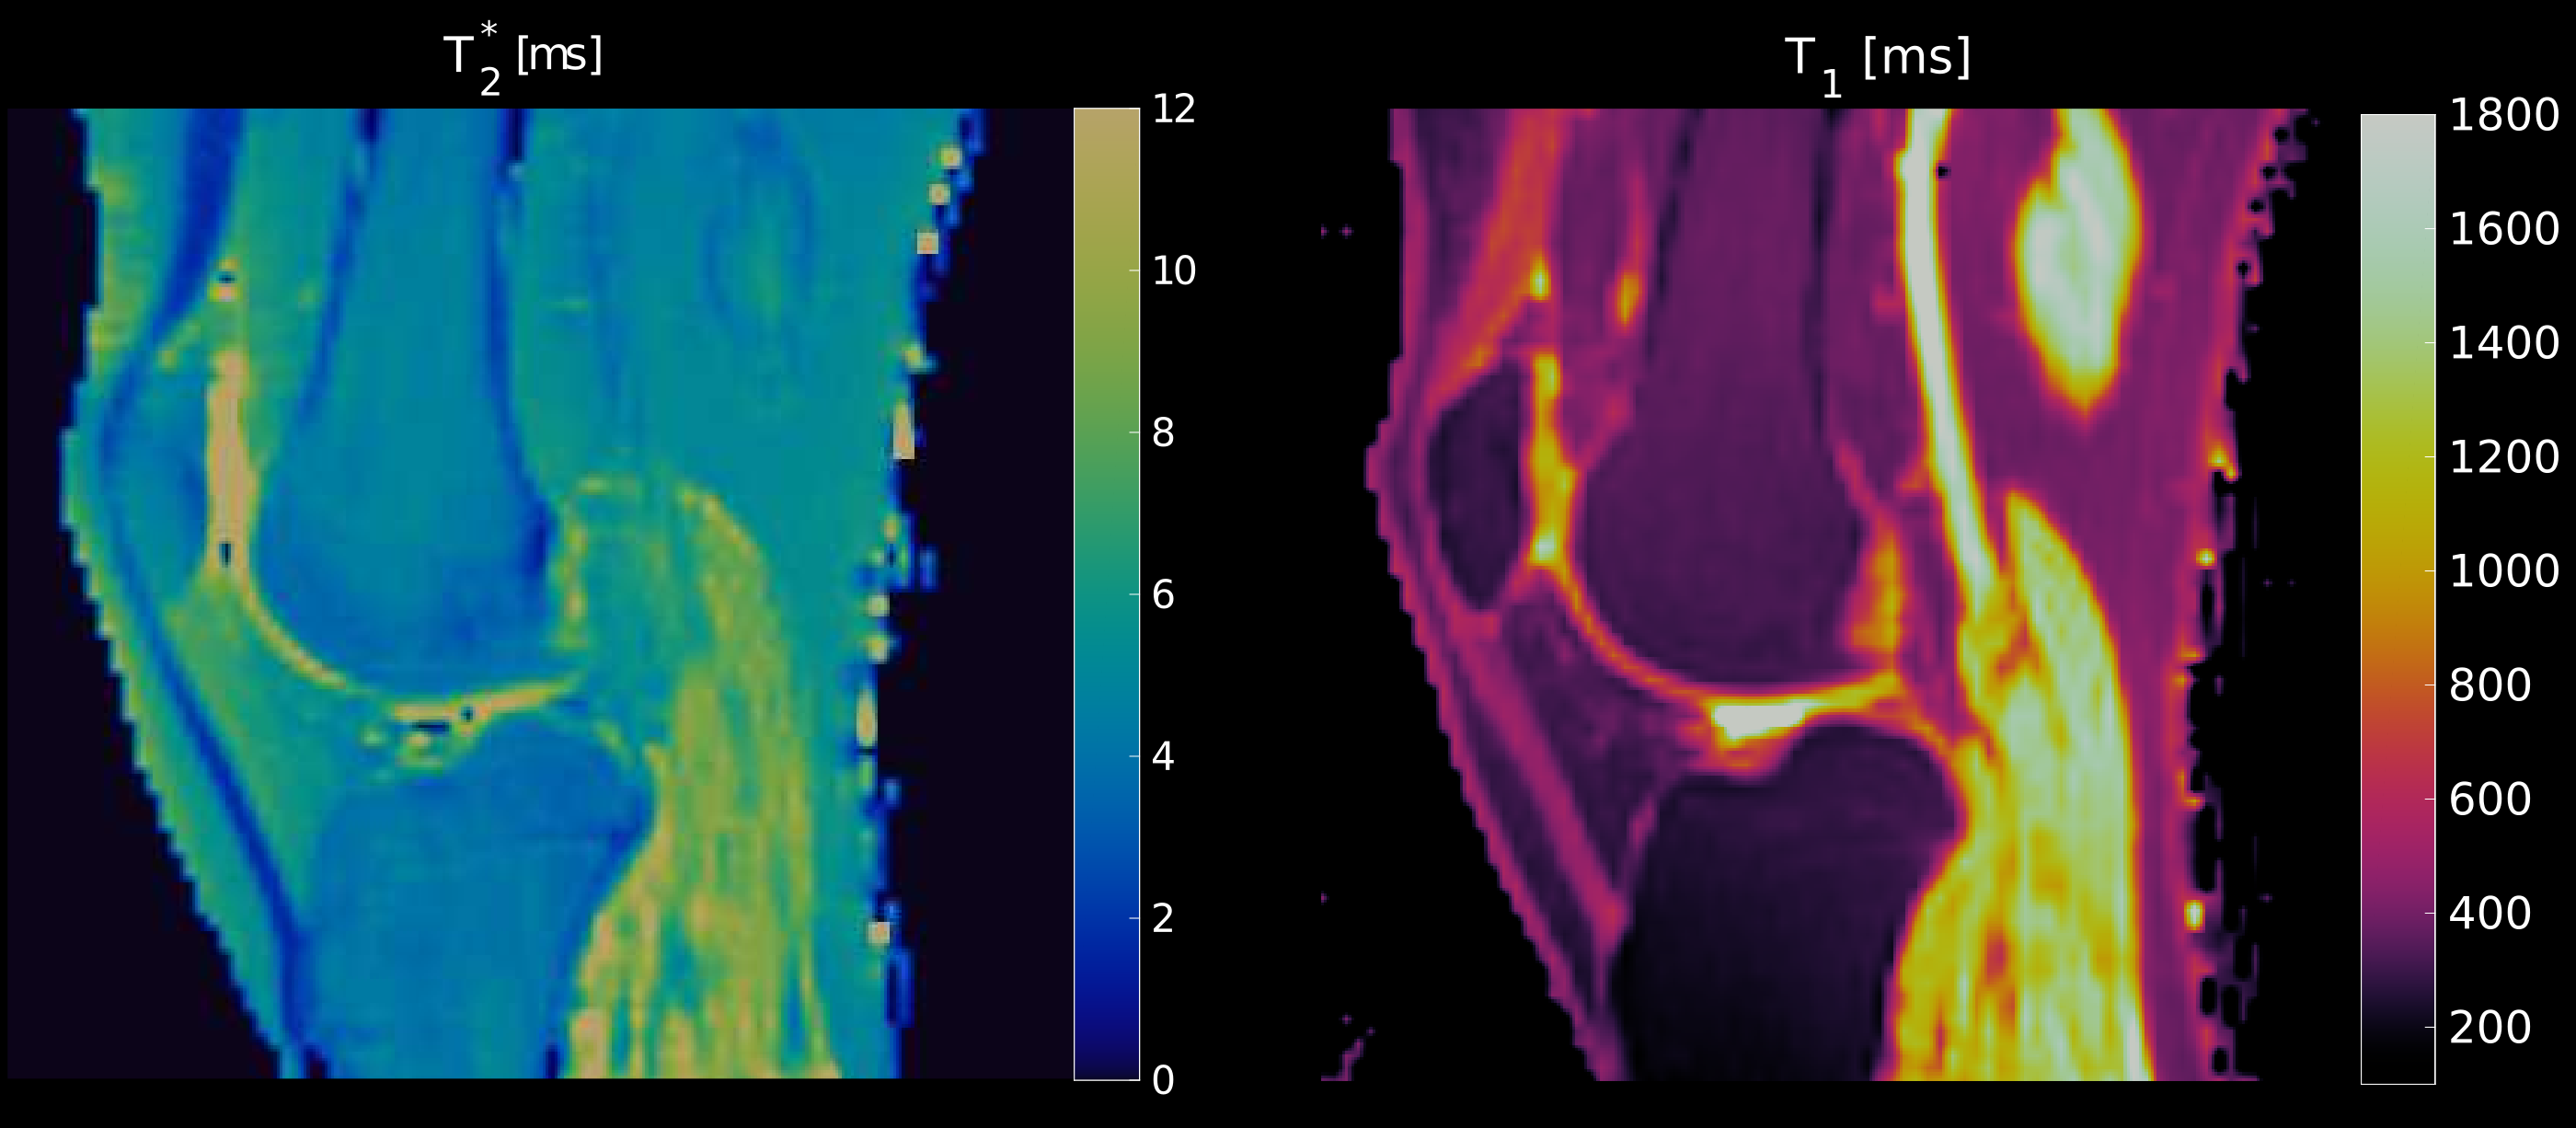
T2*-map
(left)
and T1-map
(right)
of a single subject, scaled between 0 ms and 12 ms and between 100 ms
and 1800 ms, respectively. On both maps, the patellar and the
quadriceps tendons are easily identified by their different
relaxation times compared to the surrounding tissues.
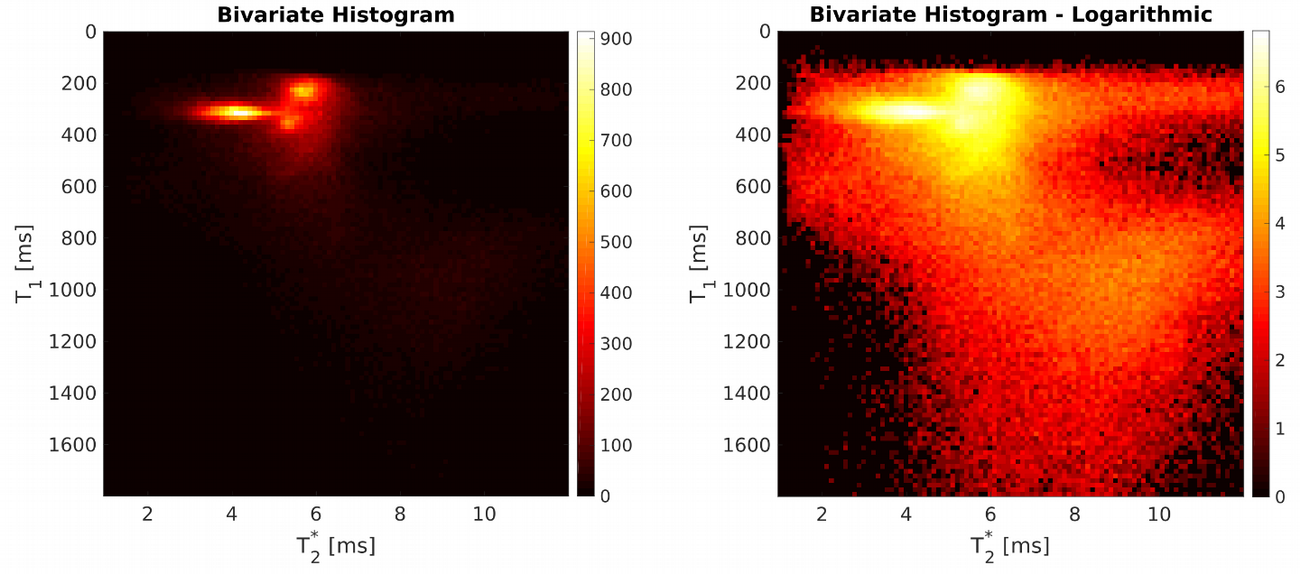
Bivariate
histogram with linear (left)
and logarithmic scaling (right)
with T2*
on the x- and T1
on the y-axis. The color-coding shows the number of voxels
corresponding to the respective relaxation times.
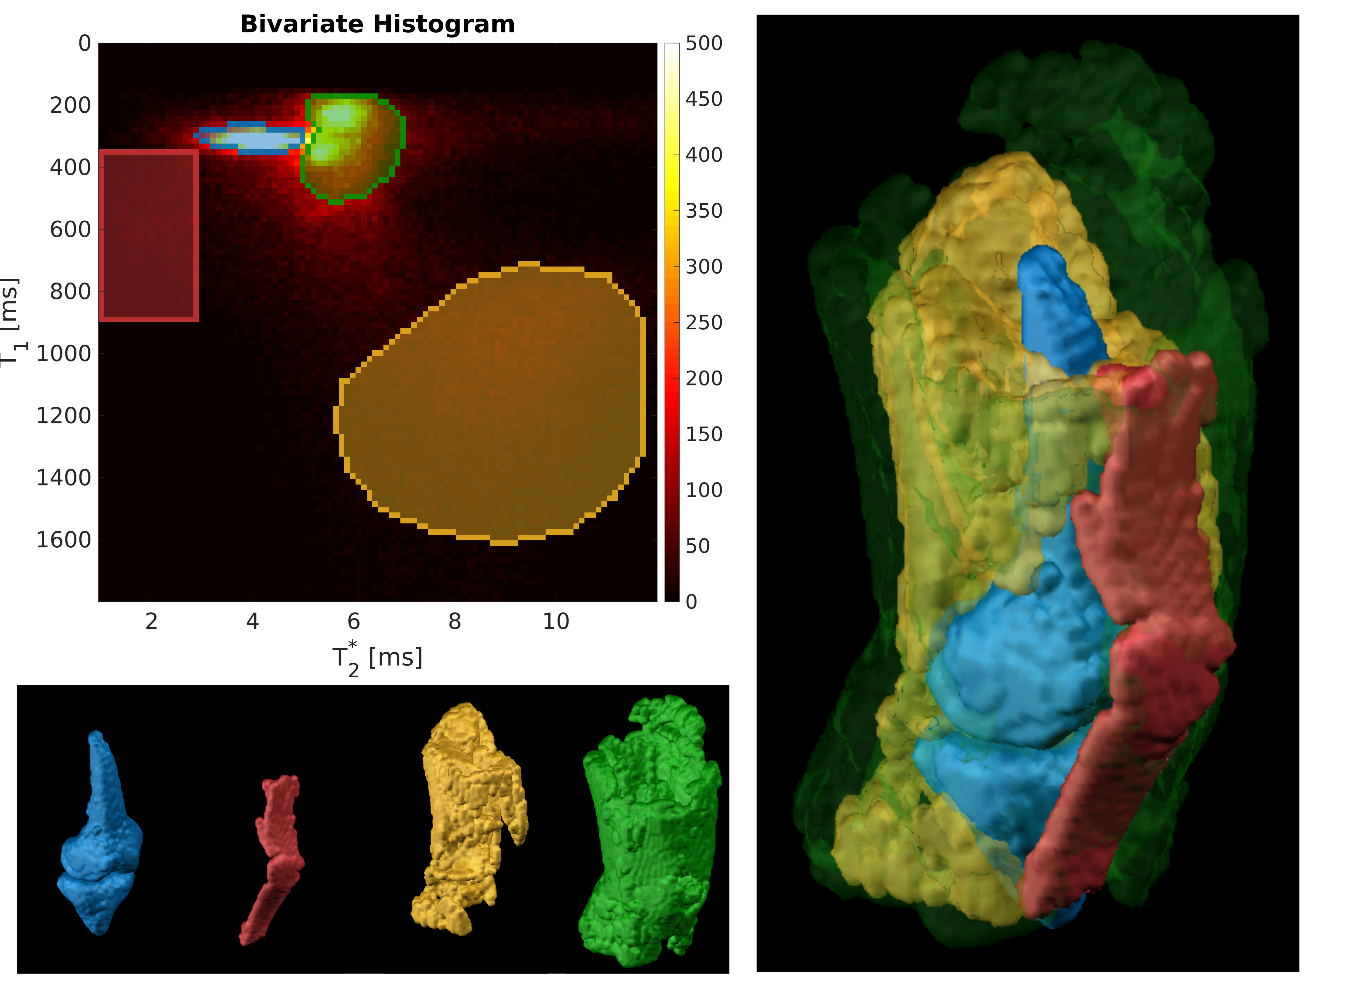
Visualization
of bone marrow (blue), patellar and quadriceps tendons (red), muscle
(yellow) as well as skin and other fatty tissue (green) based on
manually selected regions-of-interest in the bivariate histogram
(top
left).
On the right, a combination of all extracted surfaces is shown.
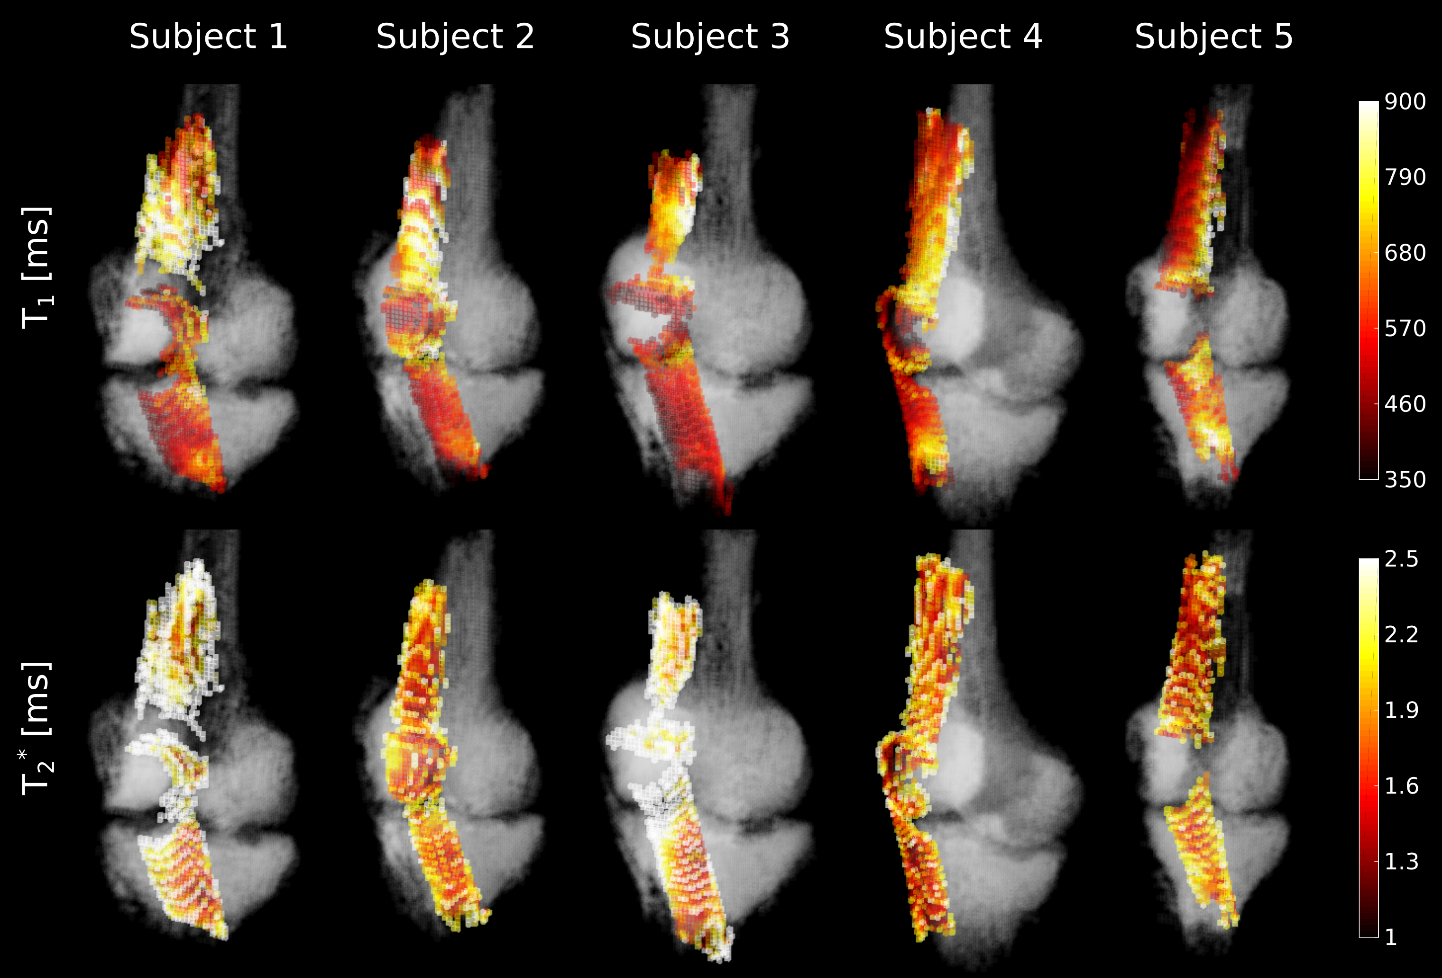
Color-coded
volumetric visualization of T1
and T2*
relaxation times for all five subjects based on the bivariate
histogram segmentation. The segmented bones are also shown for
geometrical reference (in gray).