2807
The influence of the knee position on vTE-T2* values of patellar- and quadriceps tendon measured at 3T and 7T1Department of Biomedical Imaging and Image-guided Therapy, High Field MR Centre, Medical University of Vienna, Vienna, Austria, 2CD Laboratory for Clinical Molecular MR Imaging, Vienna, Austria, 3Department of Orthopaedics and Trauma Surgery, Medical University of Vienna, Vienna, Austria, 4Department of Radiology, Division of Radiological Physics, University of Basel Hospital, Basel, Switzerland, 5Department of Biomedical Engineering, University of Basel, Allschwil, Switzerland
Synopsis
In our study in which we used a variable echo-time sequence for T2*-mapping of tendons in vivo at 3T and 7T, we showed that even small changes in the knee position in the knee coil can lead to significant changes in the T2*-values of the patellar tendon and quadriceps tendon. We have also shown that the T2*-values of the tendons correlate well with the angle of the bulk of the collagen fibers to the magnetic field. Based on these results, we recommend that for T2*-mapping it is important to examine the tendon in exactly the same position in the follow-up.
Introduction
Quantitative T2* mapping of highly ordered collagen-rich tissues such as tendons and ligaments is associated with major challenges. Although it has been shown that T2*-mapping has a great potential to detect degenerations in these tissues non-invasively and earlier than with conventional morphological MRI1, many peculiarities of these quantitative mapping methods are still not fully understood. A major one, is the orientation dependence of the transverse relaxation (T2/T2*) of these tissues, which stems from the structural composition of collagen, where water molecules have slow movement in the water surrounding the collagen fibres and have a preferred orientation (the molecular director remains perpendicular to the fibre) and translational motion2,3,4 which, when subjected to an external magnetic field, as is the case in an MRI, causes a residual dipolar coupling of protons in the tissue – an effect that is usually simply referred to as the magic angle effect. This effect occurs at any angle in measurements with short echo-times and inherently cannot be suppressed.In this study we performed T2*-mapping of the patellar (PT) and quadriceps tendon (QT) in two knee positions (as extended and as flexed as possible) and at two field strengths (3T and 7T) using a variable echo-time sequence (vTE)5 which allows very short echo-times for signal to be acquired from tendons.
Methods and Materials
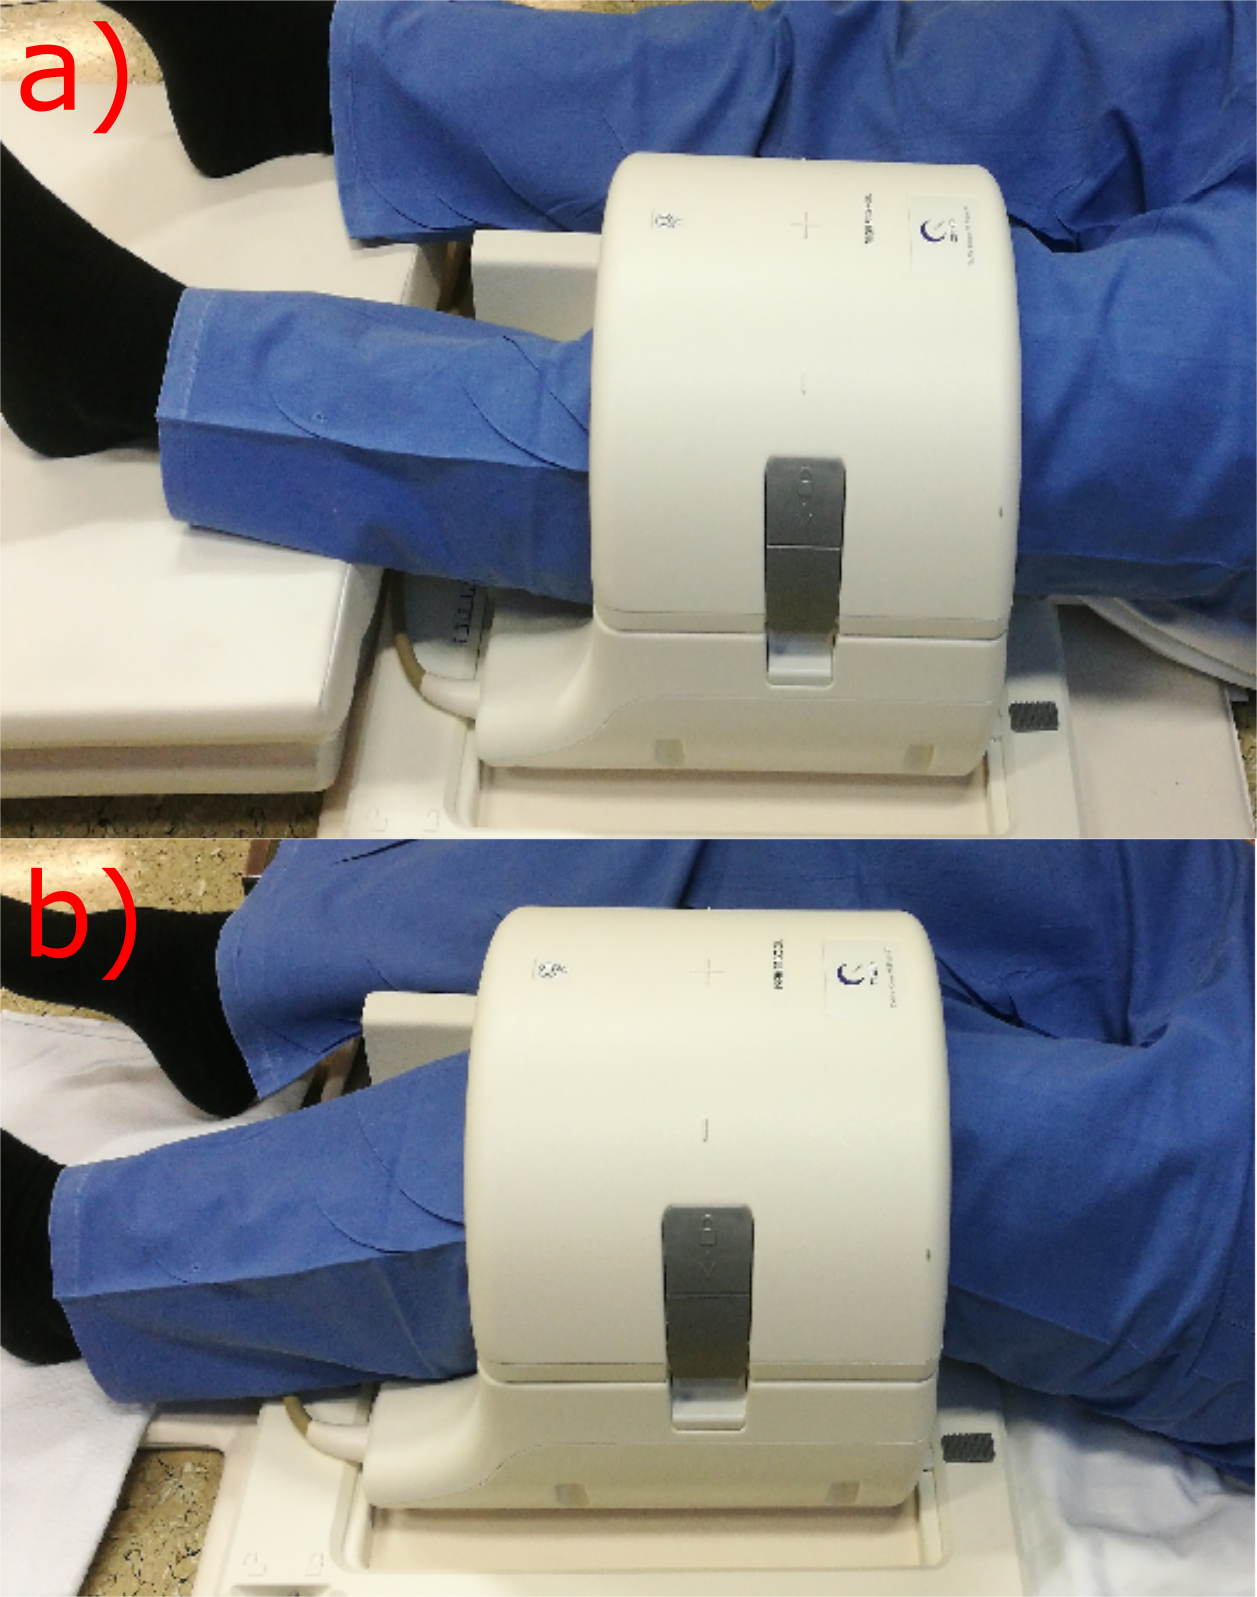
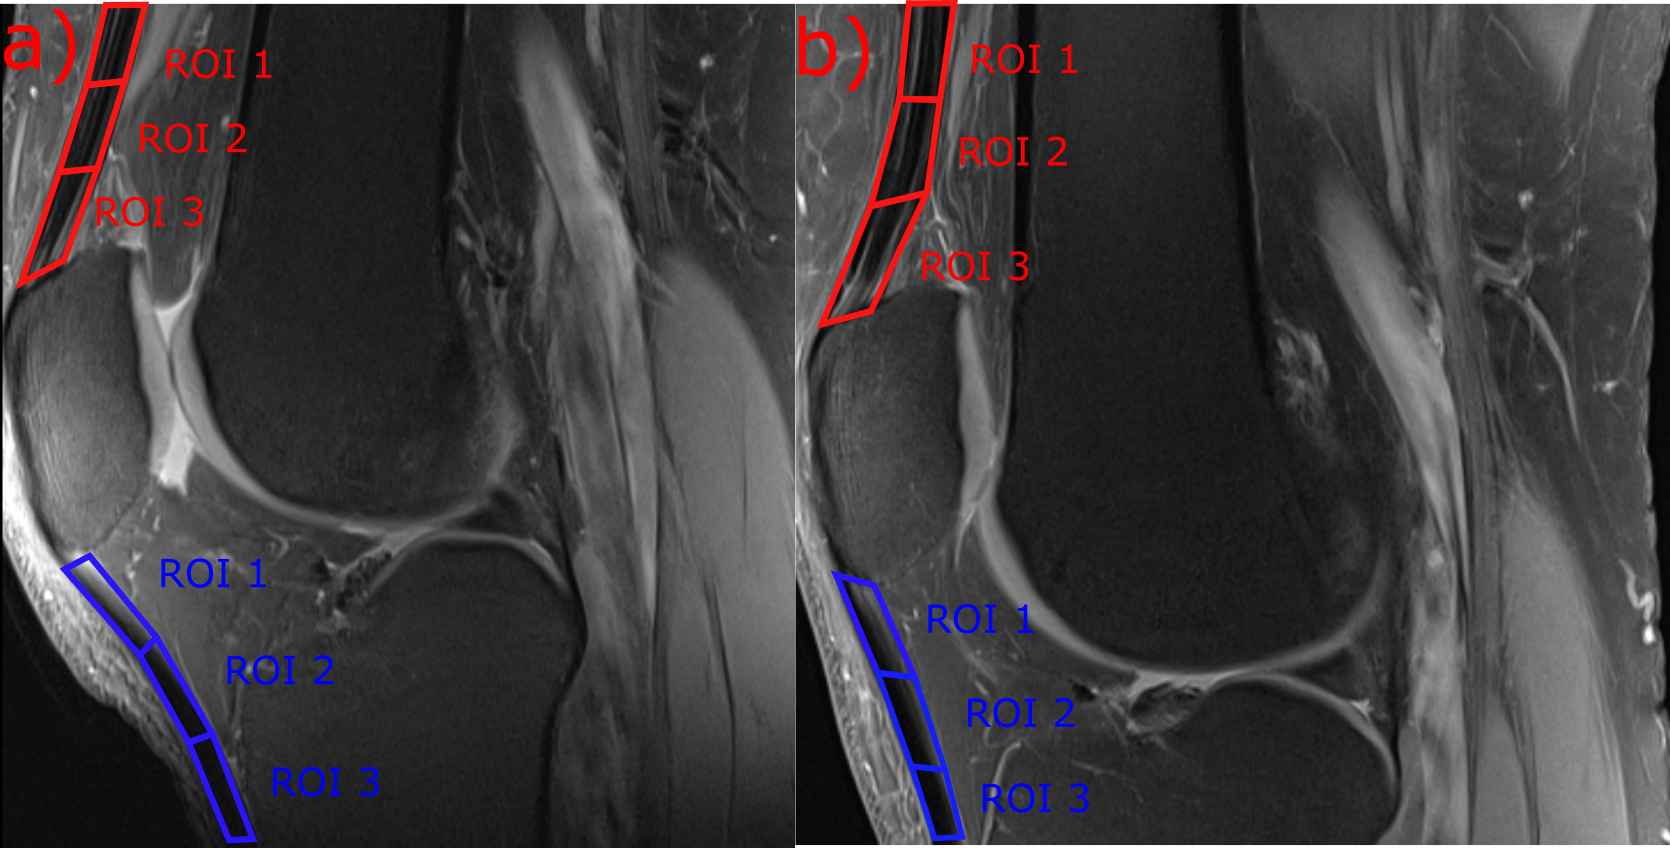
This study was approved by the local ethics committee and written informed consent was obtained from all volunteers. Six healthy volunteers (mean age 27.5±2.99 years; m:f = 4:2) without knee pain, and without known history of injury or trauma and surgery were selected for this study. MRI was performed on a 3T Prisma Fit using a 15-channel knee coil (Quality Electrodynamics LLC, Cleveland, USA) and on an 7T scanner (MAGNETOM; Siemens Healthineers, Erlangen, Germany) using a 28-channel knee array coil (Quality Electrodynamics LLC, Cleveland, USA). The volunteers were measured in two different angles of the knee in the knee coil; as extended and as flexed as possible (Figure-1). A 3D variable echo-time sequence was used for T2*-mapping in a very similar protocol for both field strengths. The T2* mapping imaging protocol for 7T was: 12 echo-times ranging from 1.02-21.6ms, TR=32ms, pixel size=0.4x0.4mm2, slice thickness=2mm; and for 3T: 12 TEs ranging from 1.03-21.96ms, TR=32 ms, pixel size=0.4x0.4mm2, slice thickness=2mm. In addition, a morphological MRI protocol, containing, among others, a sagittal proton-density-weighted fast-spin-echo (PD-FSE) sequence and a sagittal T1-weighted TSE sequence was performed. Each measurement was performed with the field of view parallel with the scanner z-axis, in order to simplify the angle measurement of the tendons in the images. Three regions of interest (ROIs) were selected from three consecutive slices from the center of the tendons (Figure-2) and subsequently mean T2*-values were determined for every region.Results
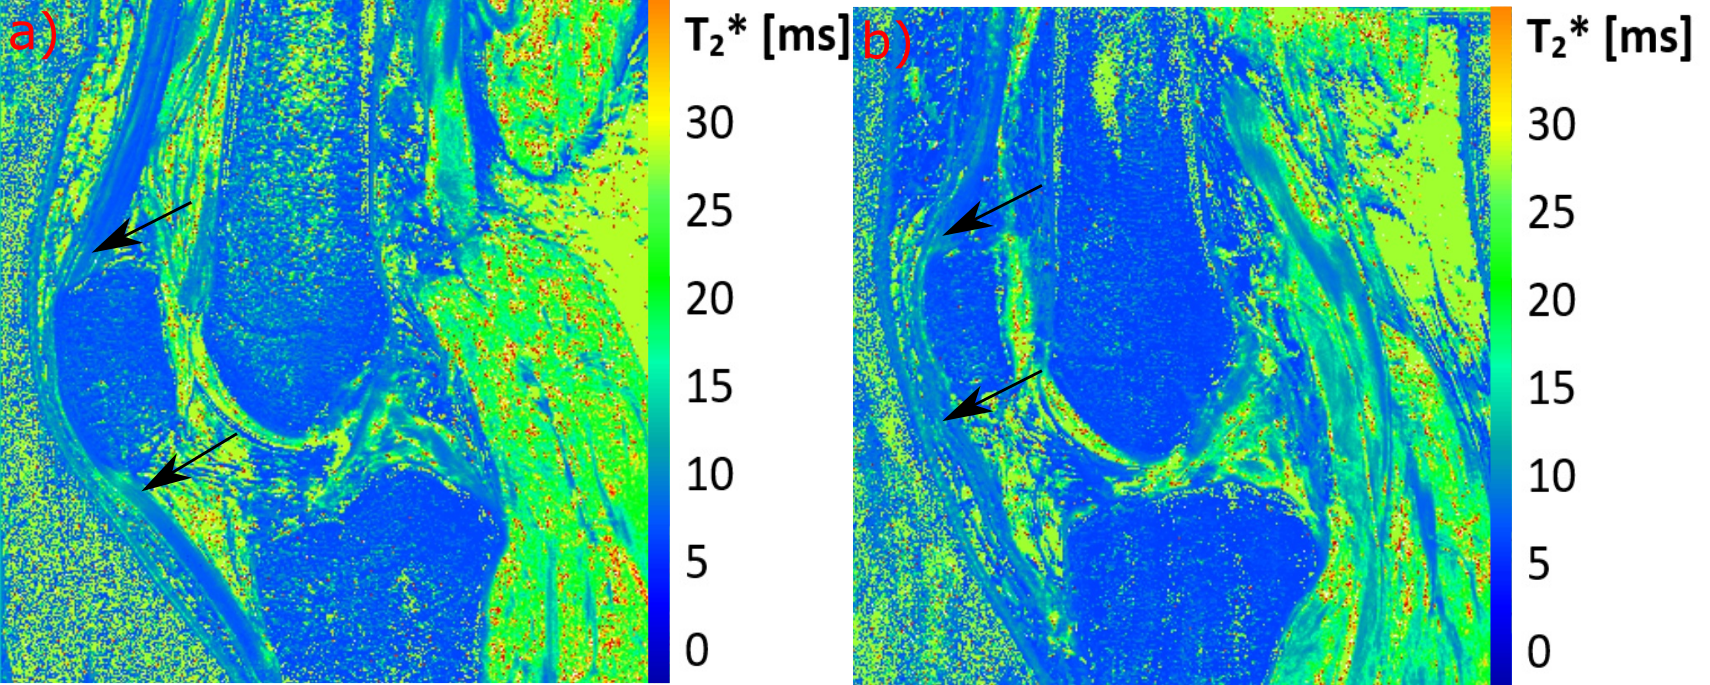
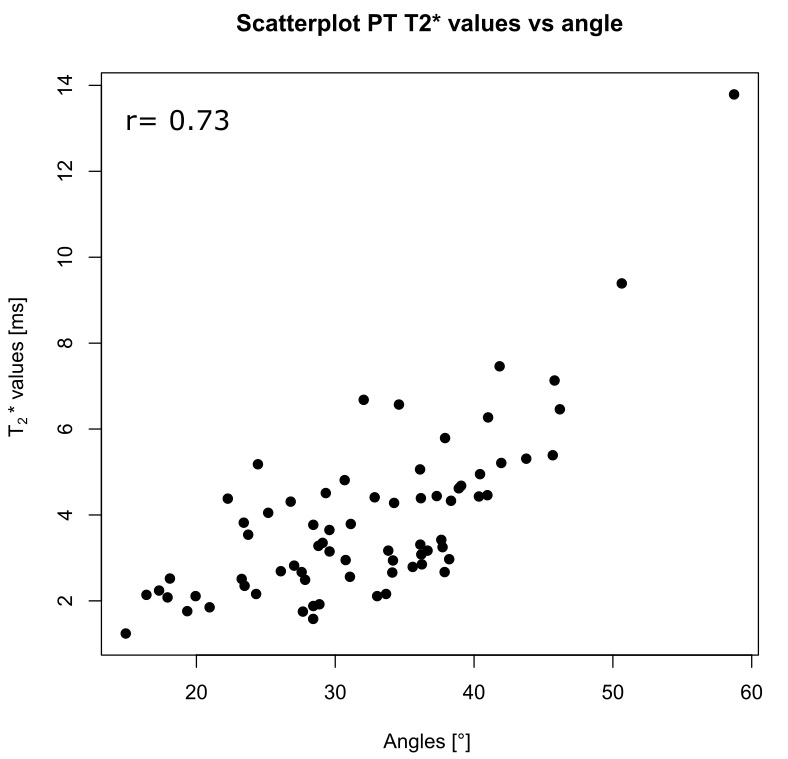
The mean angles for patellar tendon region 1, 2 and 3 in extened position were: 27, 28, 32°, respectively, for 3T and 30, 30, 34° for 7T. In flexed position the mean angles were 39, 31, 29°, respectively, for 3T and 41, 35, 30° for 7T. The mean T2* values for patellar tendon region 1, 2 and 3 in extended position were: 4.03, 2.82, 3.4ms, respectively, for 3T and 3.52, 3.36, 4.48ms, respectively, for 7T. In flexed position the mean values were 6.78, 2.98, 3.09ms, respectively, for 3T and 5.98, 3.21, 2.64ms, respectively, for 7T MRI. The QT showed a very similar pattern compared to the PT, with highest values and angles for the ROI-1 of the QT. The correlation of the different subregion T2* value means with their respective angles for all patellar tendons and for both volunteer knee positions is strong for PTs (r=0.73) (Figure-4) and moderate for QT (r=0.36).Discussion
We showed that by changing the knee positions T2*-values of PT and QT show a strong variation and thus might complicate the interpretation of T2*-values with regard to degenerations. Both the PT and QT show strong variation of T2*-values in the individual subregions, which can predominately be explained by differences in fiber-to-field angle of each region. The ROI-1 from the PT and QT in flexed position have the highest T2*-values on average and also the largest angles. This effect of residual dipolar coupling is often misunderstood, even by experienced radiologists as shown by a recent survey6. When using very short echo times, this effect modulates T2/T2*-decay for any angle and is not only ‘active’ at or near a fiber-to-field angle of 55°, as it is the case in morphological MRI where longer TEs are used. Based on anatomical investigations of patellar and quadriceps tendons, it can be assumed that the collagen fibers in the center of the tendon are approximately straight along the long-axis of the tendon and therefore it can be assumed that the determined angle in this study corresponds well to the bulk angle of the fibers to the magnetic field. Based on these results, we recommend that in the T2*-mapping of tendons it is important to examine the tendon in exactly the same position in the follow-up.Conclusion
The results show that the position of tendons, and thus their fiber-to-field angle is crucial for performing quantitative T2* mapping when using short echo-times.Acknowledgements
No acknowledgement found.References
[1]Juras V. et al., Bi-exponential T2 analysis of healthy and diseased Achilles tendons: an in vivo preliminary magnetic resonance study and correlation with clinical score. Eur Radiol., 23(10):2814-22 (2013)
[2] Tourell, M.C. et al., Molecular dynamics of a hydrated collagen peptide: insights into rotational motion and residence times of single-water bridges in collagen. The journal of physical chemistry, B 120 (49), 12432-12443 (2016)
[3] Fullerton GD, Rahal A, Collagen structure: the molecular source of the tendon magic angle effect. J Magn Reson Imaging, 25: 345‐ 361 (2007)
[4] Momot, K.I. et al, Anisotropy of spin relaxation of water protons in cartilage and tendon. NMR in Biomedicine, 23(3), 313-324 (2010)
[5] Deligianni X. et al., High-resolution Fourier-encoded sub-millisecond echo time musculoskeletal imaging at 3 Tesla and 7 Tesla. Mag. Reson. Med., 70(5): 1434-1439 (2012).
[6] Richardson M.L. et al., Some new angles on the magic angle: what MSK radiologists know and don’t know about this phenomenon. Skeletal Radiology, 47(12):1673-1681 (2018)
Figures