2805
The Angular Dependence of 3D Ultrashort Echo Time Cones Adiabatic T1ρ (3D UTE Cones-AdiabT1ρ) Imaging of the Achilles Tendon1Department of Radiology, University of California, San Diego, San Diego, CA, United States, 2Department of Radiology, Guangzhou First People’s Hospital, School of Medicine, South China University of Technology, Guangzhou, China, 3Radiology Service, VA San Diego Healthcare System, San Diego, CA, United States
Synopsis
This study investigated the magic angle effect in three-dimensional ultrashort echo time Cones Adiabatic T1ρ (3D UTE Cones-AdiabT1ρ) imaging of the Achilles tendon on a clinical 3T scanner. The magic angle effect was investigated by repeated UTE Cones-AdiabT1ρ imaging of five human Achilles tendon samples at five angular orientations ranging from 0° to 90° relative to the B0 field. Conventional Cones continuous wave T1ρ (Cones-CW-T1ρ) and Cones-T2* sequences were also applied for comparison. Cones-AdiabT1ρ showed a much reduced magic angle effect as compared to regular Cones-CW-T1ρ and Cones-T2*, suggesting its potential use as a novel biomarker for musculoskeletal (MSK) imaging.
Introduction
A major confounding factor in quantitative magnetic resonance imaging of MSK tissues is the magic angle effect (1-3). The ordered collagen fibers in MSK tissues are subject to dipole-dipole interactions that are modulated by the term 3cos2(θ)-1, where θ is the angle between the fiber orientation and B0. Both T2 and continuous wave T1ρ (CW-T1ρ) show a strong magic angle effect, demonstrating up to several-fold increase when θ is changed from 0° to 55° (3). Adiabatic T1ρ (AdiabT1ρ) relaxation has been proposed to address this challenge (4-10). Regular AdiabT1ρ sequences cannot evaluate many of the MSK tissues with short T2 relaxation. Ultrashort echo time (UTE) sequences can image short T2 tissues (11). More recently, the combination of 3D-UTE-Cones data acquisition and adiabatic T1ρ preparation (3D UTE Cones-AdiabT1ρ) has been proposed for magic angle insensitive imaging of both short and long T2 tissues in the MSK system. The Achilles tendon has a more organized collagen fiber structure than most other MSK tissues, and is thus expected to be subject to a greater magic angle effect. The purpose of this study was to investigate the magic angle effect in 3D UTE Cones-AdiabT1ρ imaging of the Achilles tendon on a clinical 3T scanner.Methods
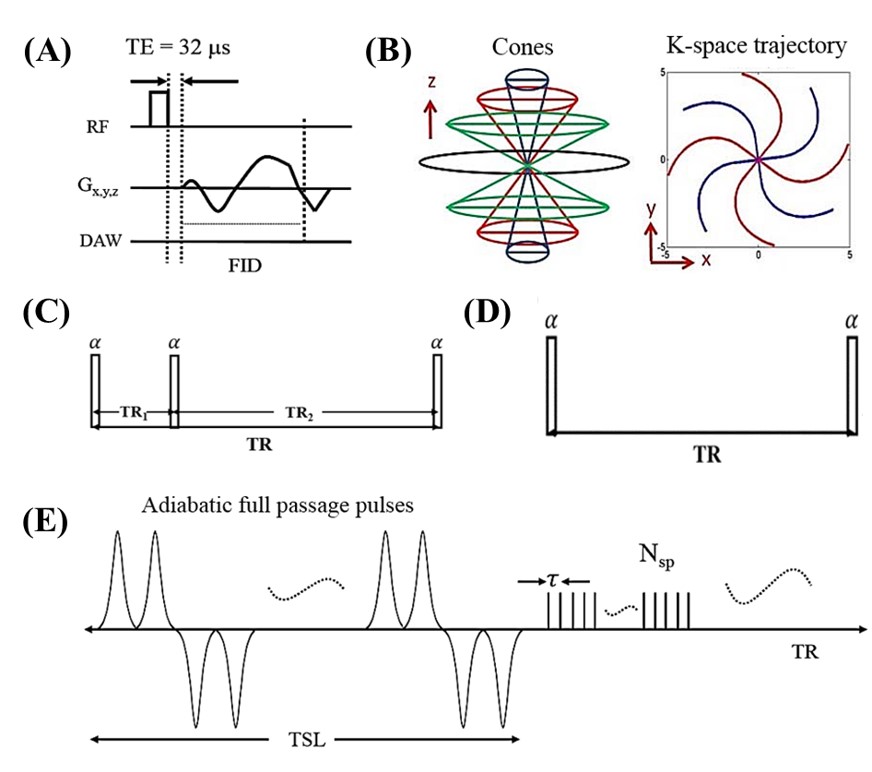
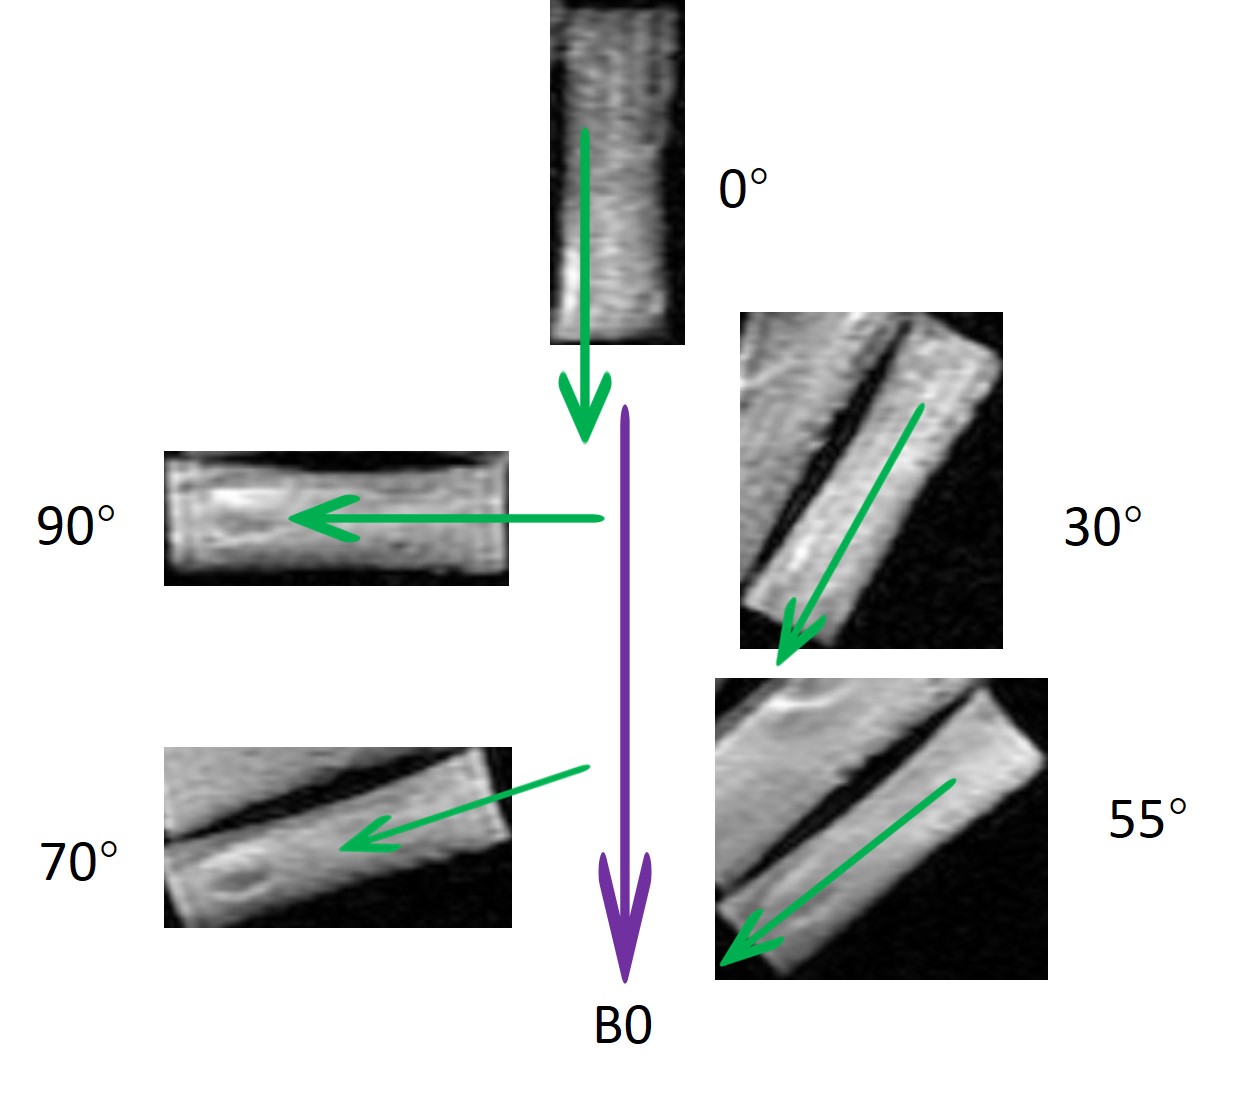
The 3D UTE Cones-AdiabT1ρ sequence employed an even number of adiabatic inversion recovery (NIR) pulses followed by regular UTE Cones imaging, during which a short rectangular pulse excitation was followed by Cones sampling. Following each adiabatic T1ρ preparation, fast Cones data acquisition was performed using a number of spokes (Nsp) with an equal time interval τ. The spin lock time (TSL) is defined as the total duration of the train of adiabatic IR pulses, i.e. TSL=NIR×Tp (Tp is duration of a single adiabatic IR pulse). Accurate T1 measurement is needed for T1ρ calculation because of the use of a relatively short TR. 3D UTE Cones actual flip angle imaging (AFI) was used to map B1 inhomogeneity, which, together with a variable flip angle (VFA) method (3D UTE Cones-AFI-VFA), was used for accurate T1 mapping (11,12). Features of the sequences used in this study are shown in Figure 1. Typical imaging parameters included a field of view (FOV) of 5×5 cm2, a slice thickness of 0.4 mm, and a receiver bandwidth (BW) of 105 kHz. Other sequence parameters were: 1) UTE Cones-AFI (11): TR1/TR2 = 20/100 ms, flip angle (FA) = 45°; 2) UTE Cones-VFA (13): TR = 20 ms; FA = 4°,7°,10°,15°, 20°, 25°, and 30°; 3) UTE Cones-AdiabT1ρ (13): TR = 1000 ms; FA = 10°; Nsp = 11; NIR = 0, 2, 4, 6, 8, 12, 16, and 20; 4) UTE Cones-CW-T1ρ (13): TR = 1000 ms; FA = 10°; Nsp = 11; TSL = 0, 1, 3, 6, 10, and 15 ms; 5) UTE Cones-T2*: TR = 80 ms, FA = 15°, fat saturation, one set of multi-echo acquisitions (TEs = 0, 2.2, 4.4, 8.8, 14, 20 ms). The imaging protocol was repeated on five human Achilles tendon samples (five donors aged 28-84 years, mean age 60.4±27.2 years; 2 males, 3 females) five times, each with a different orientation (0°, 30°, 55°, 70°, and 90° relative to B0). The rotating scheme is shown in Figure 2. Single-component model was applied to fit T1, T1ρ, AdiabT1ρ, and T2*. The angular dependence of each biomarker was analyzed.Results
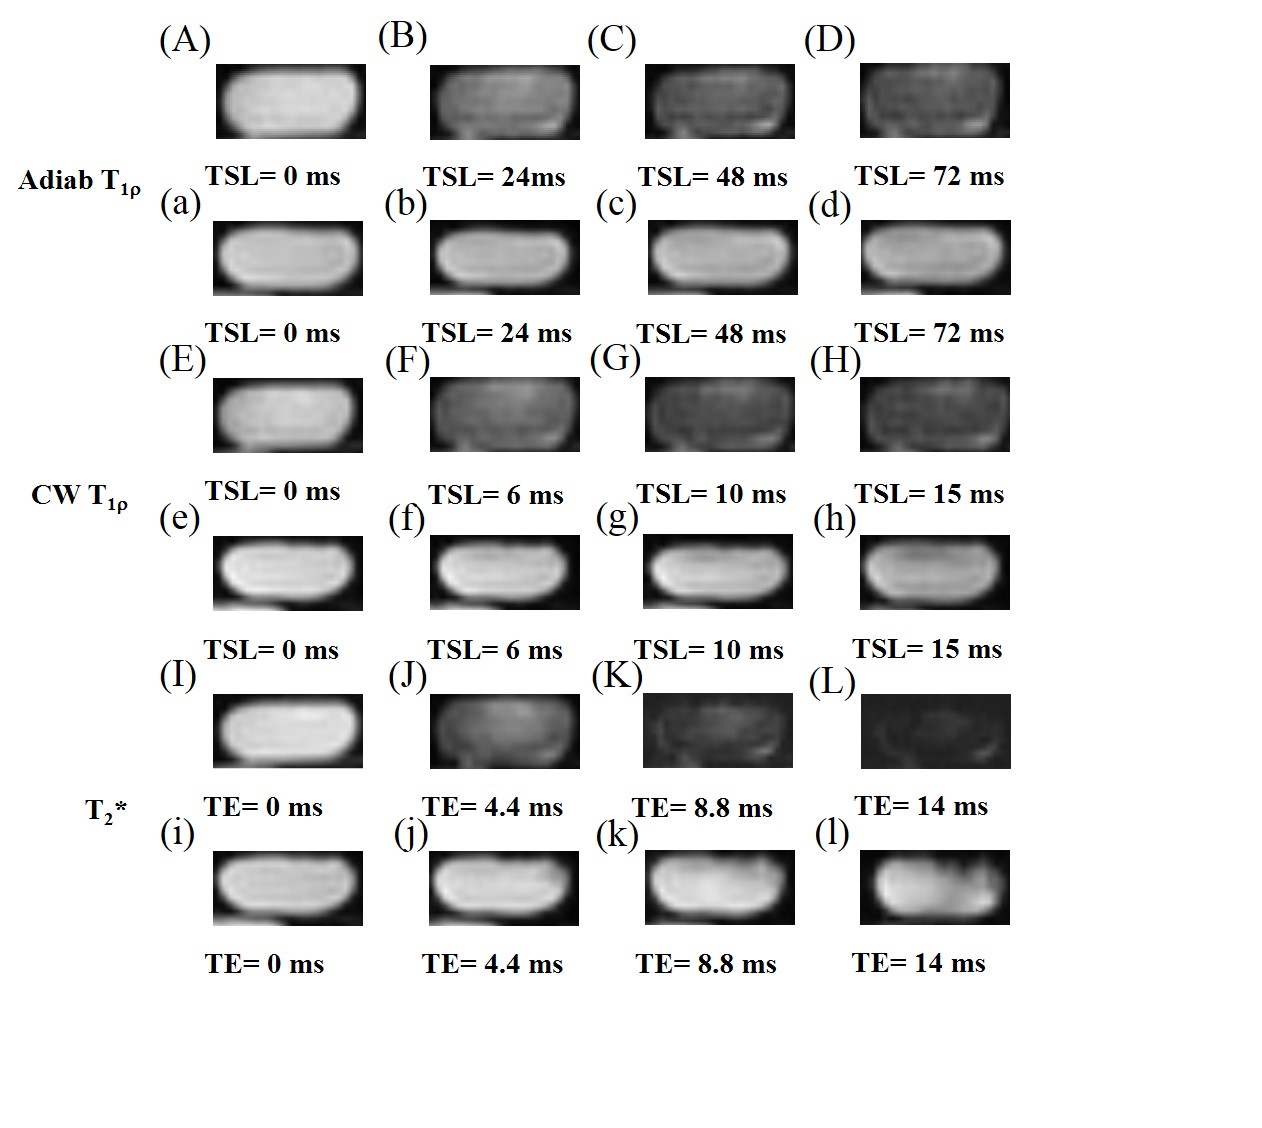
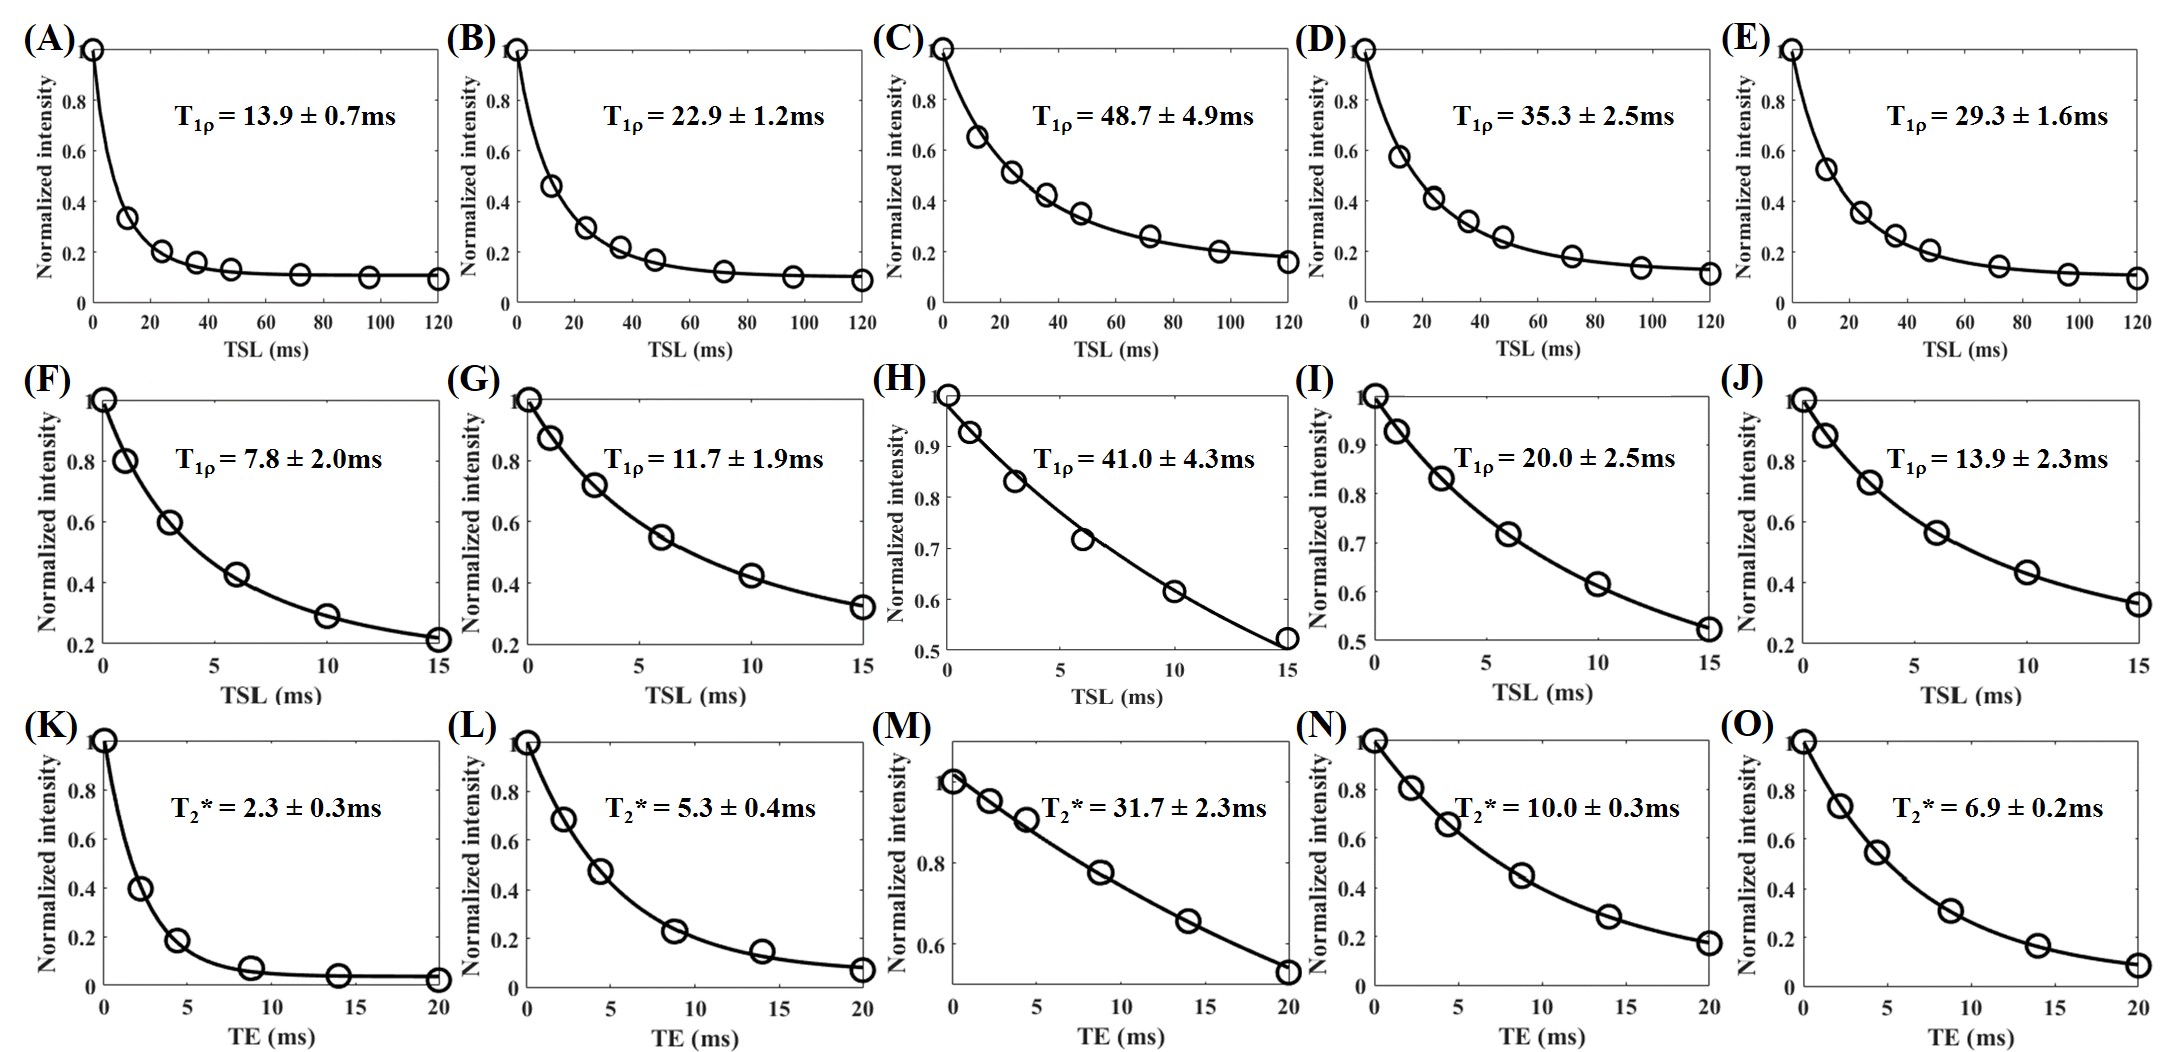
Figure 3 shows representative images from 3D UTE Cones-AdiabT1ρ imaging, regular UTE Cones CW-T1ρ imaging, and UTE Cones-T2* imaging of the same Achilles tendon sample oriented 0° and 55° relative to the B0 field, respectively. Signal from the Achilles tendon decayed much faster at 0° than at 55° when scanned using the regular UTE Cones-CW-T1ρ and UTE Cones-T2* sequences, but slower when scanned using the 3D UTE Cones-AdiabT1ρ sequence.Figure 4 shows exponential fitting curves for a global ROI of an Achilles tendon sample oriented 0°, 30°, 55°, 70°, and 90° to the B0 field using 3D UTE Cones-AdiabT1ρ, regular UTE Cones CW-T1ρ, and UTE Cones-T2* imaging, respectively. AdiabT1ρ values show the smallest magic angle effect with a 3.5-fold increase through the minimization of dipolar interaction at 55°. In comparison, CW-T1ρ and T2* showed much stronger magic angle effects with 5.3-fold and 13.8-fold increase, respectively.
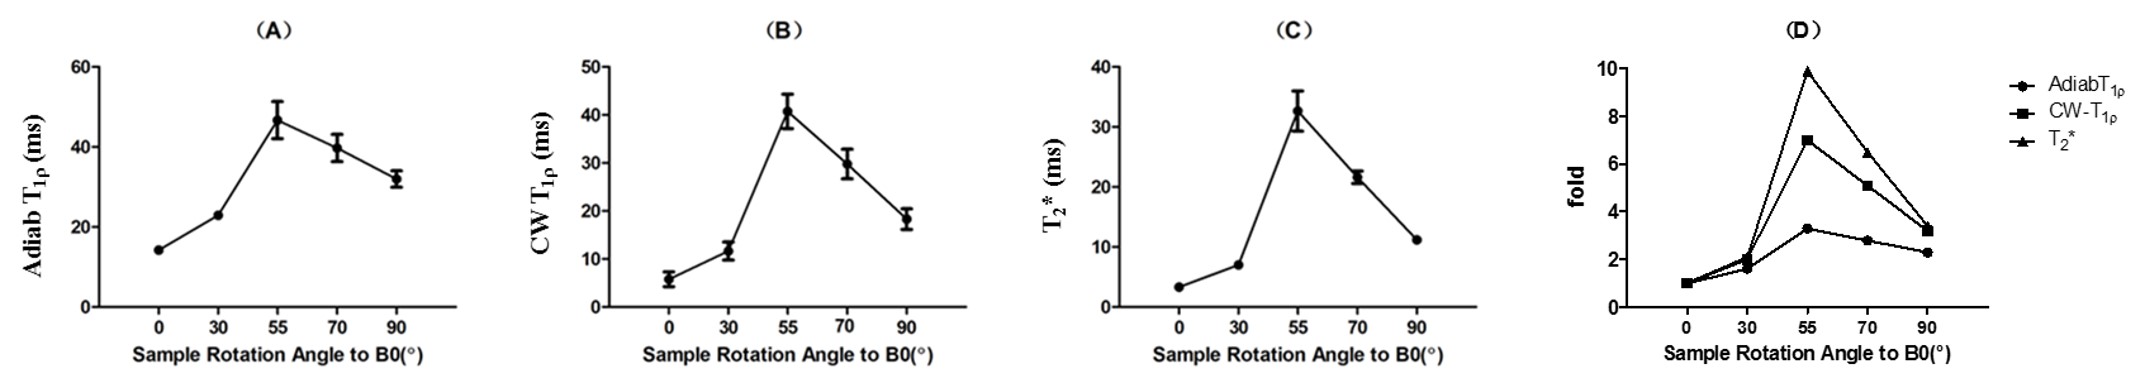
Figure 5 shows the angular dependence of 3D UTE Cones-AdiabT1ρ, regular UTE Cones CW-T1ρ, and UTE Cones-T2* for a representative human Achilles tendon sample. The UTE Cones-AdiabT1ρ values show a much reduced magic angle effect as compared with the regular UTE Cones CW-T1ρ (3.7-fold reduction) and UTE Cones-T2* values (6.6-fold reduction).
The average AdiabT1ρ values show the smallest magic angle effect, with a 3.6-fold increase from 13.6 ms at 0° to 48.4 ms at 55°. The average CW-T1ρ values show much increased magic angle effect, with a 6.1-fold increase from 7.0 ms at 0° to 42.0 ms at 55°, while the average T2* values show the strongest magic angle effect, with a 12.3-fold increase from 2.9 ms at 0° to 35.8 ms at 55° .
Conclusion
The 3D UTE Cones-AdiabT1ρ sequence is less sensitive to the magic angle effect than Cones-CW-T1ρ and Cones-T2*, and may be used as a novel biomarker for MSK imaging.Acknowledgements
The authors are thankful for support from R01AR075825, 1R01NS092650, 2R01AR062581, 1R01AR068987, I01CX001388, and I01RX002604.References
1. Eckstein F, Burstein D, Link TM. Quantitative MRI of cartilage and bone: degenerative changes in osteoarthritis. NMR in Biomedicine. 2006; 19:822–854.
2. Shao H, Pauli C, Li S, Ma Y, Tadros AS, Kavanaugh A, Chang EY, Tang G, Du J. Magic angle effect plays a major role in both T1rho and T2 relaxation in articular cartilage. Osteoarthritis Cartilage 2017; 25:2022-2030.
3. Du J, Statum S, Znamirowski R, Bydder GM, Chung CB. Ultrashort TE T1ρ magic angle imaging. Magn Reson Med. 2013; 69(3): 682–687.
4. Garwood M, DelaBarre L. The return of the frequency sweep: designing adiabatic pulses for contemporary NMR. J Magn Reson. 2001; 153: 155-177.
5. Michaeli S, Grohn H, Grohn O, Sorce DJ, Kauppinen R, Springer CS Jr, Uğurbil K, Garwood M. Exchange-influenced T2rho contrast in human brain images measured with adiabatic radio frequency pulses. Magn Reson Med. 2005; 53(4): 823-829.
6. Michaeli S, Sorce DJ, Springer CS Jr, Ugurbil K, Garwood M. T1rho MRI contrast in the human brain: modulation of the longitudinal rotating frame relaxation shutter-speed during an adiabatic RF pulse. J Magn Reson. 2006; 181: 135-147.
7. Casula V, Autio J, Nissi MJ, Auerbach EJ, Ellermann J, Lammentausta E, Nieminen MT. Validation and optimizationof adiabatic T1ρ and T2ρ for quantitative imaging of articular cartilage at 3 T. Magn Reson Med. 2017; 77(3): 1265-1275.
8. Nissi MJ, Mangia S, Michaeli S, Nieminen MT. Orientation anisotropy of rotating frame and T2 relaxation parameters in articular cartilage. In: Proceedings of the 21st Annual Meeting of ISMRM, Salt Lake City, UT, 2013. Abstract 3552.
9. Hänninen N, Rautiainen J, Rieppo L, Saarakkala S, Nissi MJ. Orientation anisotropy of quantitative MRI relaxation parameters in ordered tissue. Sci Rep. 2017; 7(1): 9606.
10. Zhang J, Nissi MJ, Idiyatullin D, Michaeli S, Garwood M, Ellermann J. Capturing fast relaxing spins with SWIFT adiabatic rotating frame spin–lattice relaxation (T1ρ) mapping. NMR Biomed. 2016; 29(4): 420-430.
11. Ma YJ, Lu X, Carl M, Zhu Y, Szeverenyi N, Bydder GM, Chang E, Du J. Accurate T1 mapping of short T2 tissues using a three-dimensional ultrashort echo time cones actual flip angle – variable TR (3D UTE-Cones AFI-VTR) method. Magn Reson Med. 2018; 80(2):598-608.
12. Ma YJ, Zhao W, Wan L, Guo T, Searleman A, Jang H, Chang EY, Du J. Whole knee joint T1 values measured in vivo at 3T by combined 3D ultrashort echo time cones actual flip angle and variable flip angle methods. Magn Reson Med. 2019; 81(3):1634-1644.
13. Ma Y, Carl M, Searleman A, Lu X, Chang EY, Du J. 3D adiabatic T1ρ prepared ultrashort echo time cones sequence for whole knee imaging. Magn Reson Med. 2018; 80(4):1429-1439.
Figures