2803
Magic Angle Directional Imaging (MADI) standard deviation maps correlate with knee pathology in a spontaneous injury model.
Karyn Elizabeth Chappell1, Djordje Brujic2, Mihailo Ristic2, Donald McRobbie3, Wladyslaw Gedroyc4, Catherine Van Der Straeten5, and Richard Meeson6
1Medicine, Orthopaedic Surgery, Stanford University, Redwood City, CA, United States, 2Mechanical Engineering, Imperial College London, London, United Kingdom, 3University of Adelaide, Adelaide, Australia, 4Imperial College London, London, United Kingdom, 5Imperial College London/Ghent University, Ghent, Belgium, 6Royal Veterinary College, London, United Kingdom
1Medicine, Orthopaedic Surgery, Stanford University, Redwood City, CA, United States, 2Mechanical Engineering, Imperial College London, London, United Kingdom, 3University of Adelaide, Adelaide, Australia, 4Imperial College London, London, United Kingdom, 5Imperial College London/Ghent University, Ghent, Belgium, 6Royal Veterinary College, London, United Kingdom
Synopsis
A proof of concept study in a spontaneous ligament rupture dog model assessed if the magic angle effect disappears in unhealthy tissue. Ten dogs were scanned using the MADI technique. Standard deviation (SD) maps of signal intensity were computed and measured in an interactive display. Three subjects showed abnormally high SD; two at the ACL origin, one in the trochlear articular cartilage. Fibre orientation maps showed either disorganised or highly organised collagen fibres in these subjects. On dissection two subjects had partially torn ACLs and the other a fibrocartilage lesion. There was excellent correlation between the MADI and dissection findings.
Introduction
It has been suggested that the magic angle effect (MAE) will disappear in tissue which is not healthy or when the collagen structure is disrupted1,2. Chang et al. postulate that ligament tearing or significant degeneration decreases tissue anisotropy which disrupts the contrast mechanism2. Evidence for this comes from several non-physiological models that mimic degeneration, ageing and injury3,4,5,6. For this work a model for clinical cruciate rupture with associated ligament pathology was sought. A small proof of concept study in dogs was performed as the best alternative for an animal model to assess a spontaneous ligament rupture. Dogs are prone to spontaneous arthritis7 and frequently suffer ACL ruptures, secondary changes of OA and meniscal injuries8.Methods
Ethical approval from the Royal Veterinary College (RVC) was sought and approved (URN 2017 1659-3). Any large breed dog (> 15kg) which were euthanized at the RVC and whose owners indicated disposal by group cremation were included in the study. During post-mortem examination the limbs were harvested, numbered, sealed in Zip lock bags and cold stored at 4˚C. Harvested limbs were scanned within five days using the MADI technique9.Once scanned the limbs were frozen until they could be dissected, photographed and a pathological diagnosis from a specialist orthopaedic veterinarian performed.
Visual comparison using a standard deviation (SD) map composed of signal intensity variations from nine 3DT1 FLASH volumes orientated differently to B0 was computed in Matlab 2015b. An interactive display was used to measure the SD range and enable segmentation of the ACL and articular cartilage (AC). Signal intensities for each segmented voxel were used to compute the net collagen orientation of the voxels. The results of this process calculated fibre direction vectors for each voxel displayed as fibre orientation maps (FOM). The vectors glyphs were also displayed in 3D using ParaView 5.1.2. A unique experimental number given to the dog knee during limb harvesting was used to un-blind the dog knees so the results could be correlated.
Results
During a 6 month data collection period ten knees were harvested and scanned from five dogs (fig1).The SD values were much higher in subjects 1,9 & 10. The high SD areas on subject 9 (fig2A) and subject 10 (fig2B) corresponded to the origin of the ACL. The measured voxel SD were much higher (0.85-0.92) than other voxels containing the ACL (0.4-0.6). This indicated that there was a big variation of signal intensity over the corresponding voxels in these particular areas. The third brighter voxel area was identified on subject 1 (fig2C) and corresponded to the articular cartilage between the trochlear grooves. Again the SD of the voxels in this area was much higher (0.88) than the other voxels containing articular cartilage (0.4-0.55).
Subject 1’s AC in the trochlear groove had a high SD area appearing as a voxel void which was seen on both the FOM and the ParaView plots (fig3). The small high signal SD area was segmented and showed a 4x5mm area with disorganised fibres on the FOM.
Subject 9’s SD map (fig4) showed an increase for voxels corresponding to the origin of the ACL. The FOM showed fibres that were identically orientated explaining the high SD values and was very clearly visualised on the ParaView plots. A similar appearance was noted on subject 10’s SD map (fig5).
During dissection subjects 9 and 10 were found to have tearing and degeneration of the anteromedial band of the ACL. The posterolateral band was intact in both cases. Subject 1 had an abnormal AC area in the trochlear groove with no abnormality on the patellar AC surface. The specialist orthopaedic veterinarian felt it was an area where the AC had been replaced with fibrocartilage because it was spongy when probed. The area measured 5mm x 4mm with a depth of around 1.5mm.
Discussion
There was excellent correlation between the MADI and dissection findings. Furthermore the three subjects with notable high SD voxels on the SD map were also those found to have pathology at dissection.Subject 1’s possible fibrocartilage lesion needs further exploration to explain how the MAE behaved in this instance. MAE was reduced in this region due to fibre disorganisation. However the higher SD values of the voxels suggests a large signal intensity variation that would only occur with a large MAE.
Subjects 9 and 10 partially torn anteromedial bands of the ACL have an increased MAE at the ACL origin. We postulate that the highly uniform fibre orientations resulted from the force that the ligament was under when it was torn. The initial stretch of the fibres at the origin pulled the collagen fibres into a highly aligned orientation as the bundle tore. The fibres have become ‘stuck’ in a highly aligned state rather than recoiling like elastic once the tension was removed.
Conclusion
The spontaneous ligament rupture dog model has not been used in any previous magic angle studies. The blinded spontaneous injury model found the MADI technique could distinguish healthy and injured knees in a dog model providing proof of concept. We chose this model as a natural injury would test the ability of the technique to determine pathology with the associated physiological changes.Acknowledgements
We are grateful to Charing Cross Hospital MRI department and Imaging Committee for the kind use of the Siemens 3T Verio. We would also like to thank the RVC PM technician Richard Prior for his assistance with canine knee harvesting.References
- Fullerton, G. D. & Rahal, A. (2007) Collagen structure: The molecular source of the tendon magic angle effect. J Magn Reson Imaging 25, 345-361.
- Chang, E. Y., Szevernyi, N. M., Statum, S. & Chung, C. B. (2014) Rotator Cuff Tendon Ultrastructure Assessment with Reduced-Orientation Dipolar Anisotropy Fiber Imaging. Am J Roentgenol 202, w376-w378.
- Rahal, A., Chhaya, S. A., Garcia, G. M., Heim-Hall, J. & Fullerton, G. D. (2005) High frequency ultrasound and MR imaging of tendons: evaluation of ex vivo models of normal and injured bovine tendon with histopathologic correlation. Proceedings of the 91st Annual Meeting RSNA 2005 Chicago, IL, USA.
- Rahal, A. & Fullerton, G. D. (2006) MRI measurement of advanced glycation end products: The MRI hyperglycemic damage index. Proc. Intl. Soc. Mag. Reson. Med. 14, 1673.
- Spriet, M., Murphy, B., Vallance, S. A., Vidal, M. A., Whitcomb, M. B. & Wisner, E. R. (2012) Magic Angle Magnetic Resonance Imaging of diode laser induced and naturally occurring lesions in equine tendons. Veterinary Radiol Ultrasound 53, 394-401.
- Bachmann, E., Rosskopf, A. B., Gotschi, T., Klarhofer, M., Deligianni, X., Hilbe, M., Pfirrmann, C. W. A., Snedeker, J. G. & Fischer, M. A. (2019) T1- and T2*-Mapping for Assessment of Tendon Tissue Biophysical Properties: A Phantom MRI Study. Invest Radiol 54, 212-220.
- Gregory, M. H., Capito, N., Kuroki, K., Stoker, A. M., Cook, J. L. & Sherman, S. L. (2012). A review of translational animal models for knee osteoarthritis. Arthritis 2012, 764621.
- Meeson, R. L., Todhunter, R., Blunn, G., Nuki, G. & Pitsillides, A. A. (2019) Dog Osteoarthritis - a 'one medicine' vision. Nature Reviews Rheumatology 15, 273-287.
- Chappell, K.E., Brujic, D., Straeten, C.V.D., Meeson, R., Gedroyc, W., McRobbie, D., Ristic, M. (2019) Detection of maturity and ligament injury using Magic Angle Directional Imaging (MADI). Magnet Reson Med, 82, 1041-1054.
Figures
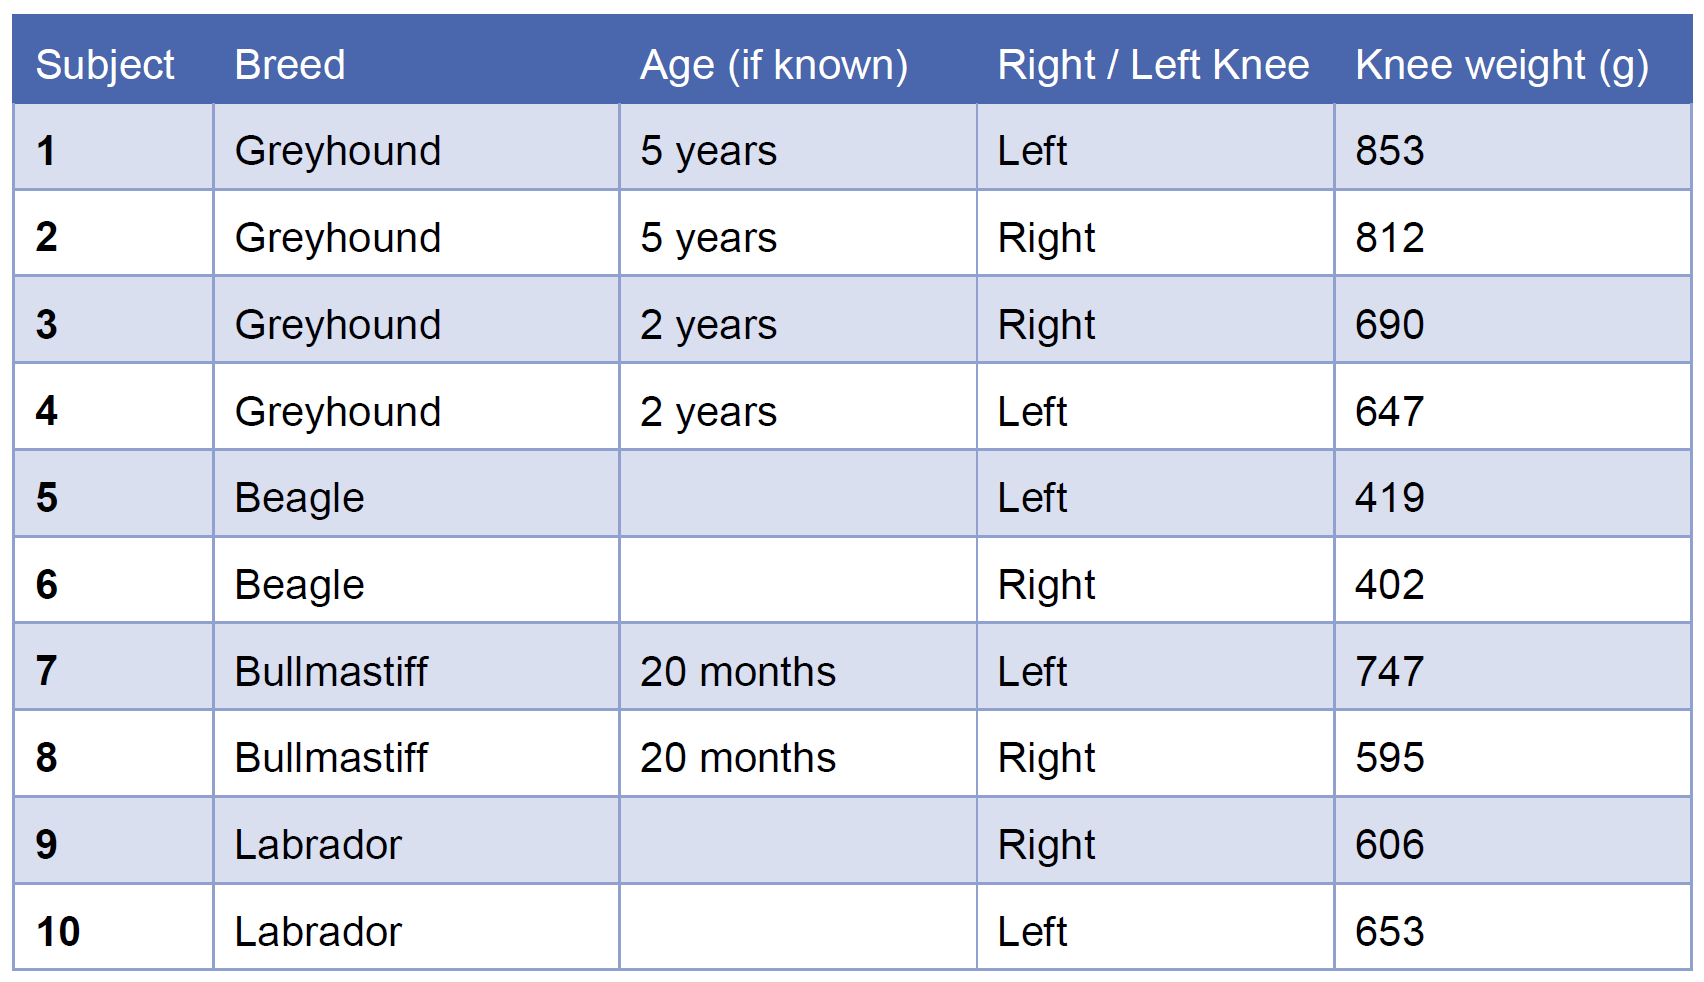
Figure 1: Subject information about the breed, age of dog (if
known), right or left knee and the weight of the harvested specimen.
Additional
information was provided by the Post Mortem technician about the Labrador
(subject 9 and 10), which was an older (exact age unknown) overweight (36kg)
neutered female (normal weight range for female Labrador 25-32kg).
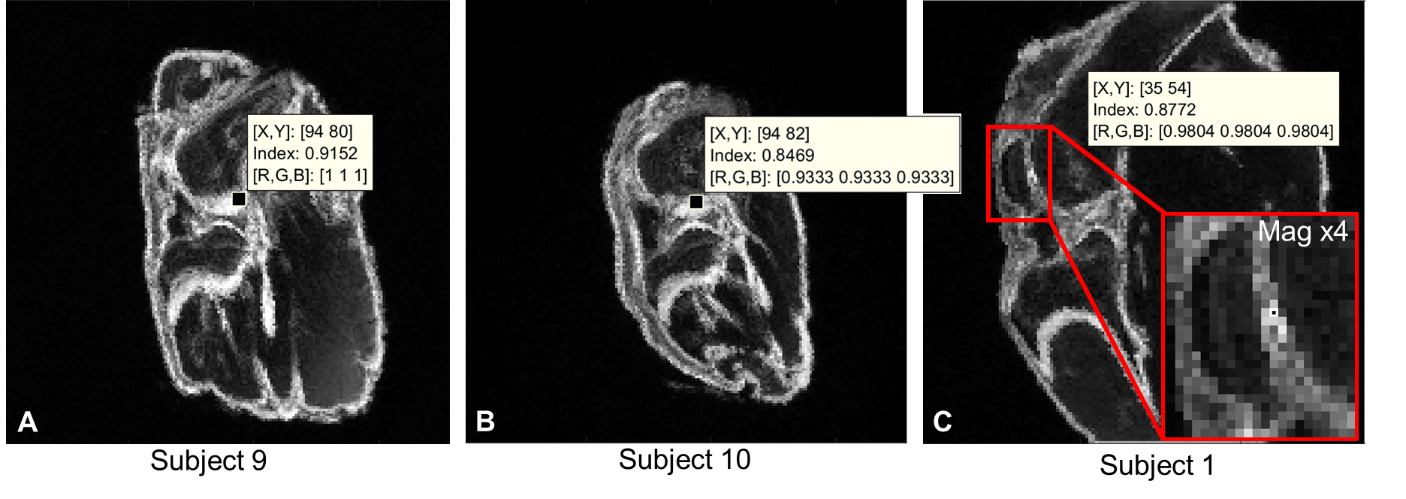
Figure 2: Standard deviation (SD) maps from 3 subjects with voxels with higher SD
values.
A. Subject 9 measured
a SD of 0.92 at the origin of the ACL. B. Subject 10 measured a SD of
0.85 in a similar area corresponding to the origin of the ACL. The SD values of
other voxels containing ACL were 0.38-0.62. C. Subject 1 measured a SD
of 0.88 in a few voxels in an area of articular cartilage (AC) around the
trochlear groove. The SD of other voxels containing AC was between 0.4-0.55.
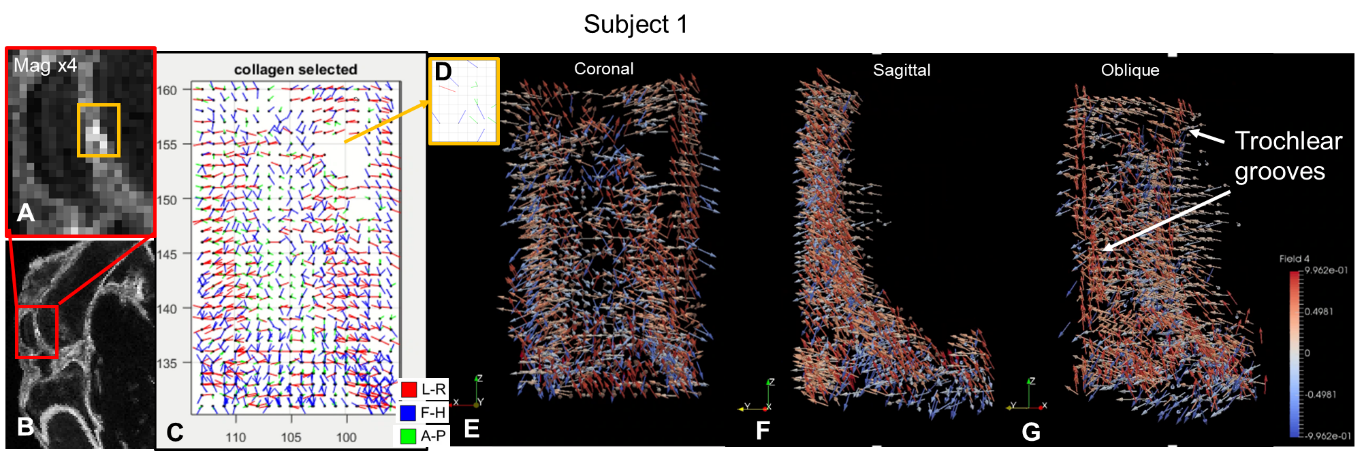
Figure 3: Subject 1 higher
SD voxels explored. A. SD map of patella
magnified x4 shows small area (orange box) with higher SD. B. SD map shows
magnified area in A. C.FOM of the area between the trochlear
grooves. Voids correspond to the high SD area. D. FOM of segmented high SD
voxels show disorganised fibre orientations. E. ParaView (coronal) of
void in the top right corner. F. ParaView (sagittal) of femoral deep
layer AC. G. ParaView (oblique) of trochlear grooves highlighted by red
vectors.
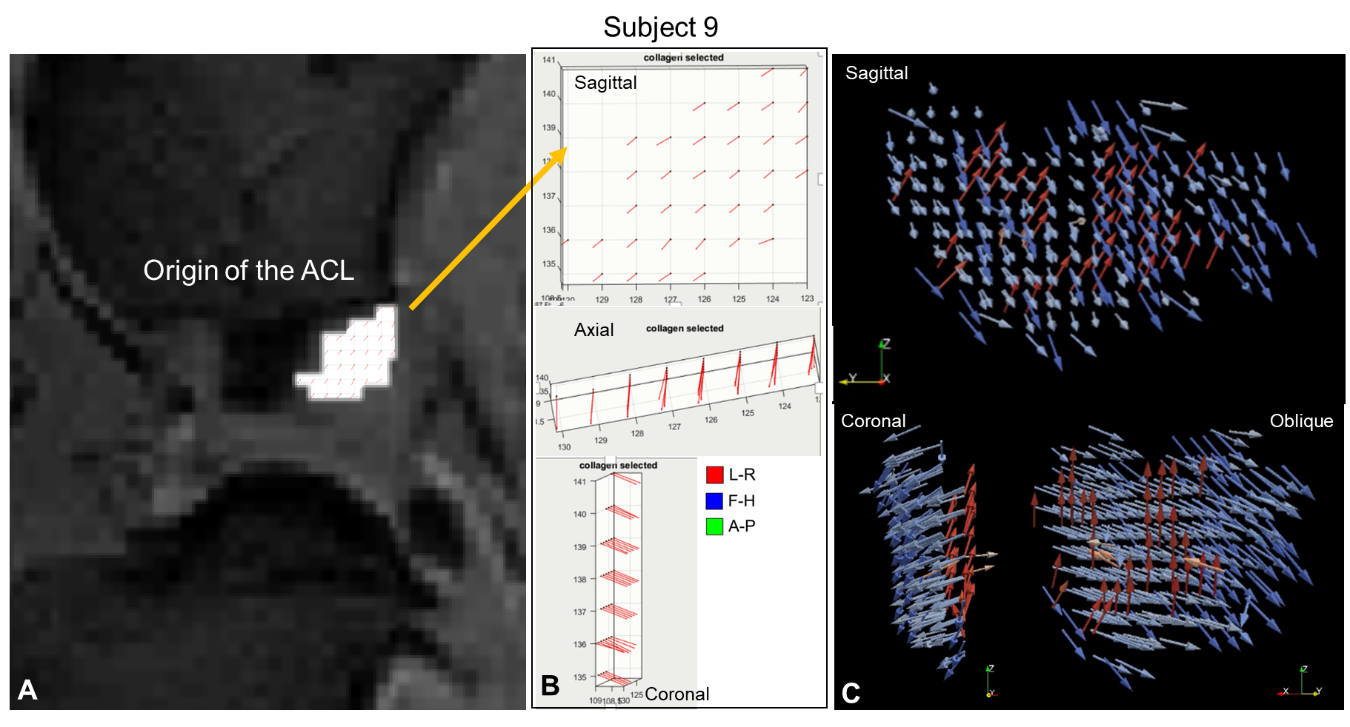
Figure 4: Subject 9
higher SD voxels explored. A. shows higher SD voxels overlaid on the original MRI corresponding
to the origin of the ACL. B. FOM of segmented voxels with higher SD in
the sagittal, coronal & axial view. These computed fibre orientations are
highly aligned. C. ParaView glyph vector plots in a sagittal, coronal &
oblique view showing the highly aligned fibres segmented in the FOM (red
glyphs) & the ACL closets to the origin which were also highly aligned
(blue glyphs).
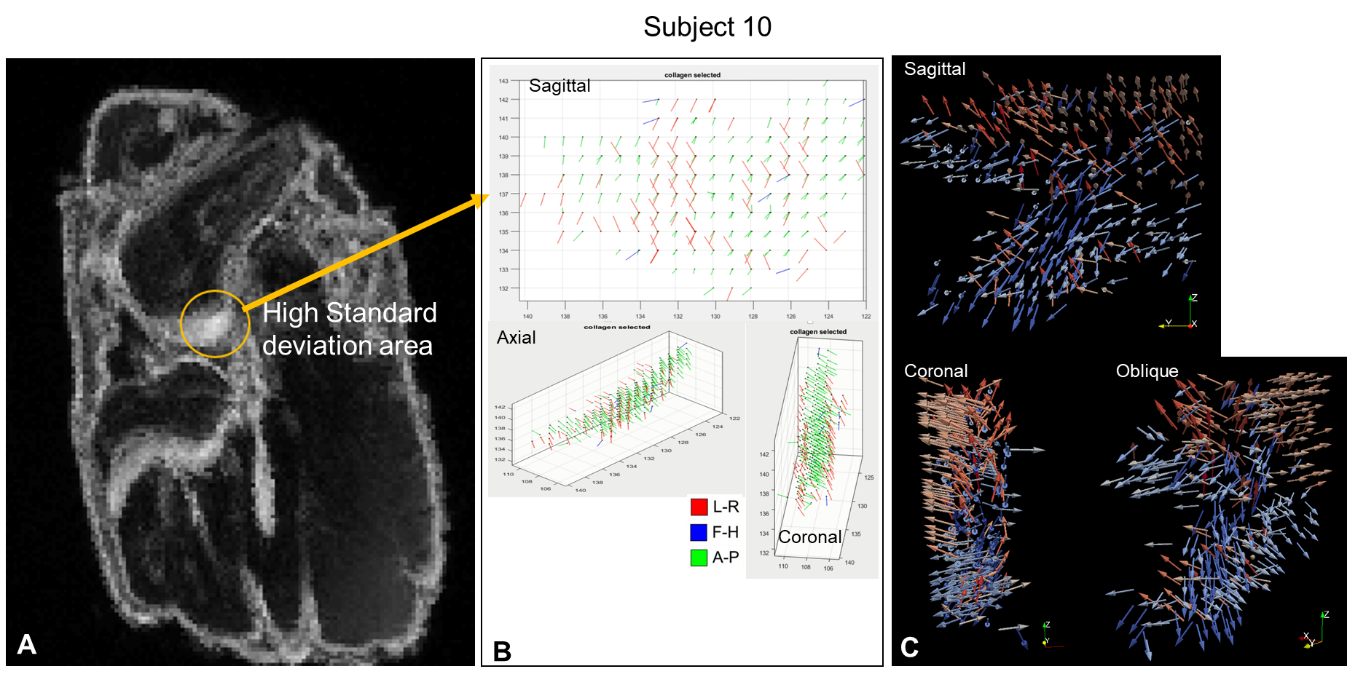
Figure 5: Subject 10
higher SD voxels explored. A. Shows the brighter area SD map corresponding to the origin of
the ACL. B. FOM of the segmented voxels with the higher SD in the
sagittal, coronal & axial view. These computed fibre orientations are highly
aligned (green A-P) fibres. C. ParaView glyph vector plots in a
sagittal, coronal & oblique view showing the highly aligned fibres from the
FOM (coral glyphs) and the ACL sparsity closest to the origin which then widens
(blue glyphs).