2800
High Angular Resolution Diffusion Imaging (HARDI) in Meniscus1Department of Radiology, Duke University, Durham, NC, United States, 2Department of Orthopaedic Surgery, Duke University, Durham, NC, United States
Synopsis
Application of diffusion magnetic resonance imaging (dMRI) to map the complex collagen fibril structures of meniscus is still challenging, due to the short T2/T2* values, low fractional anisotropy (FA) values, and relatively low signal-to-noise (SNR). In this study, we imaged the porcine menisci in a preclinical 7 T system with relatively short echo time (TE ~ 11 ms). A 3D diffusion-weighted spin-echo pulse sequence was used for whole meniscus tractography at 125 µm isotropic resolution.
Purpose
To evaluate the complex collagen fiber distributions of porcine meniscus using diffusion magnetic resonance imaging (dMRI) at high angular resolution.Introduction
The meniscus, a fibrocartilaginous cartilage, has a unique collagen structure orientation with three different layers (superficial, the lamellar, and deep layer)1. Both superficial layer and lamellar layer contain randomly orientated collagen fibers, while the deep layer consists of both circumferentially and randomly oriented fibers1. There are numerous crossing fibers existing in all the layers of meniscus. This high-ordered structure has been well studied using scanning electron microscopy and polarized light microscopy (PLM)2-3. Although these methods afford higher spatial resolution than MRI, they are destructive and the images are often presented in 2D instead of 3D. Alternatively, dMRI allows one to observe the tissue microstructure nondestructively leveraging the unique water molecular diffusion properties4. Revealing the complex crossing fiber network may improve our understanding its intrinsic functions for shock absorption, force transmission, and stability within the knee joint3,5.Methods
Two medial menisci were harvested from skeletally mature porcine knee joints obtained from a local abattoir. Scan were performed using a 3D Stejskal-Tanner diffusion-weighted spin-echo pulse sequence at 7.0 T with parameters as follows: matrix size = 192 × 120 × 80, FOV = 48 × 30× 20 mm3, TE = 10.9 ms, TR = 100 ms, 81 unique diffusion directions with a b value of 1000 s/mm2 and 8 non-diffusion-weighted (b0) measurements. All the diffusion-weighted images (DWIs) were registered to the baseline images (b0) to correct for eddy currents. The DTI model was used to characterize the primary diffusion direction of the fiber in meniscus. The scalar indices including FA and MD (mean diffusivity) were also calculated. The model-free generalized q-sampling imaging method (GQI) was used to quantify the diffusing water at different orientations6. Both DTI and GQI were used for resolving fiber orientations and the whole meniscus tractography was generated using GQI method.Results
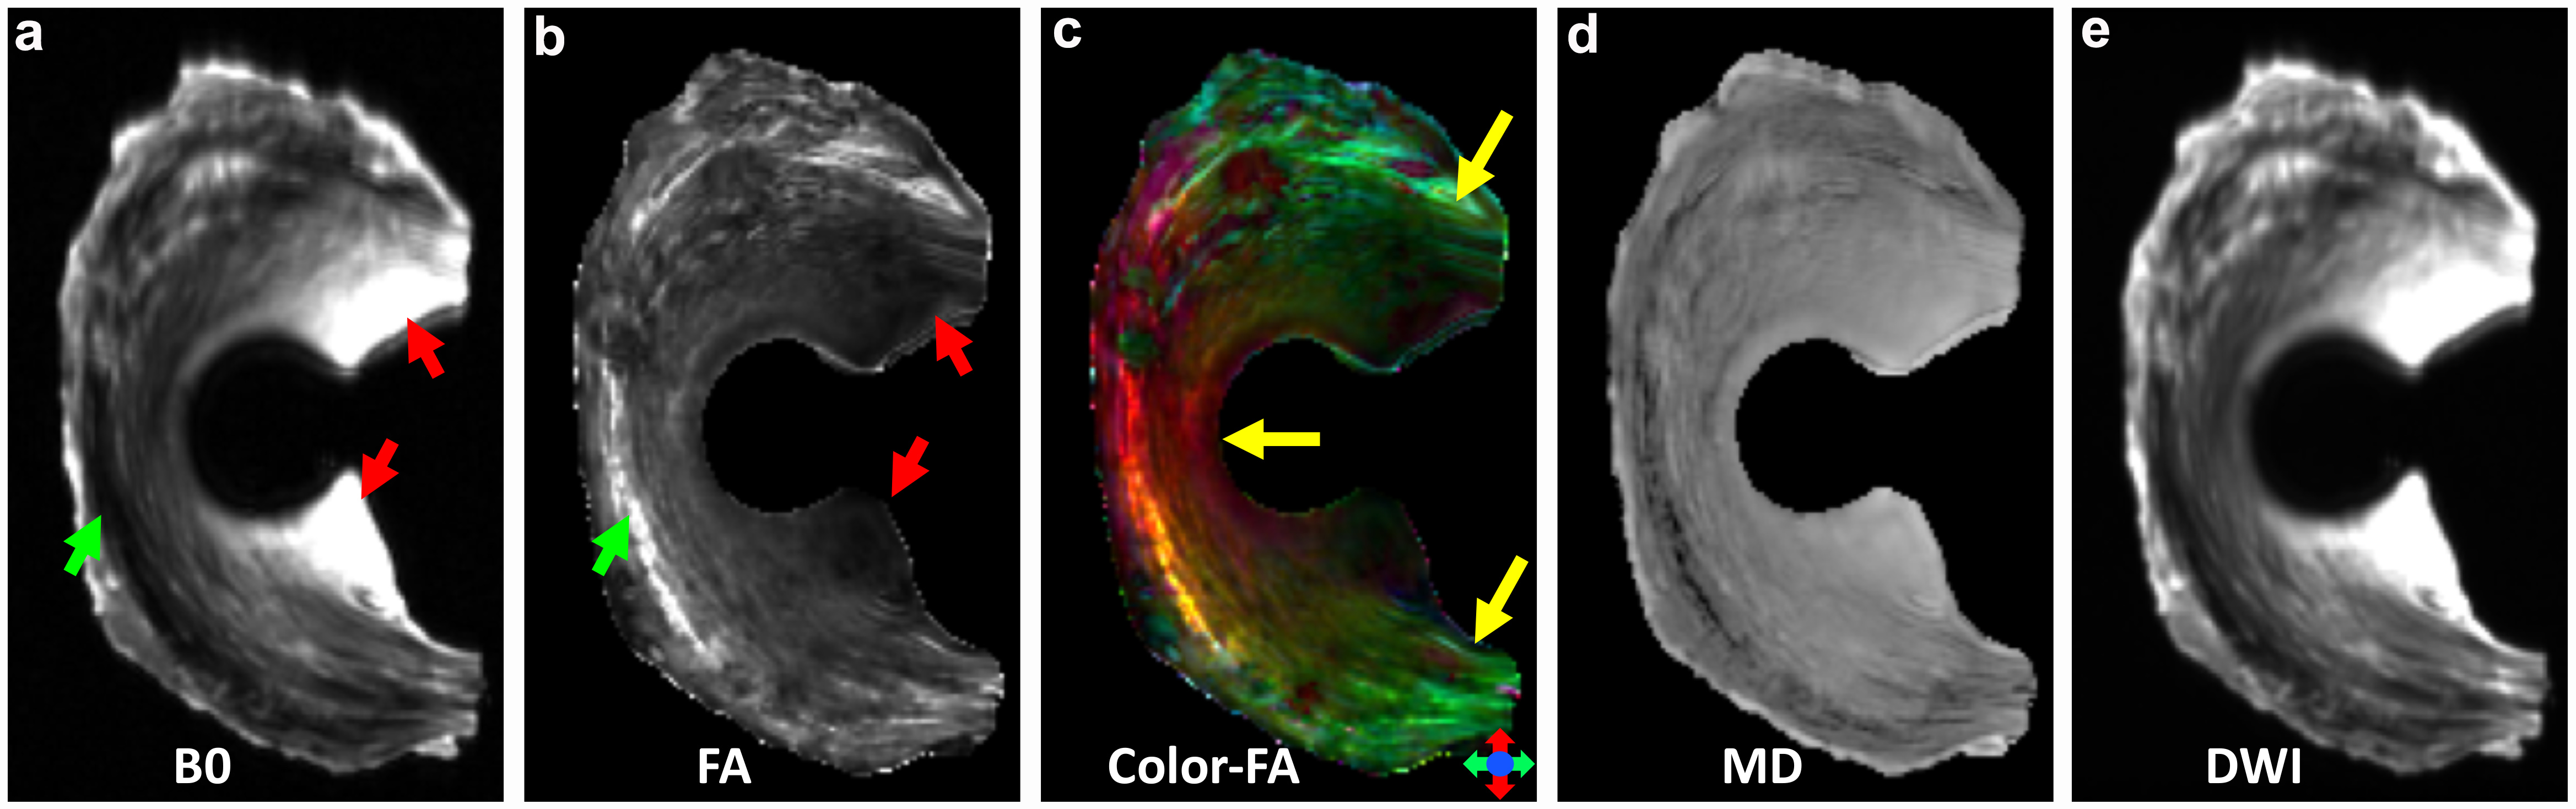
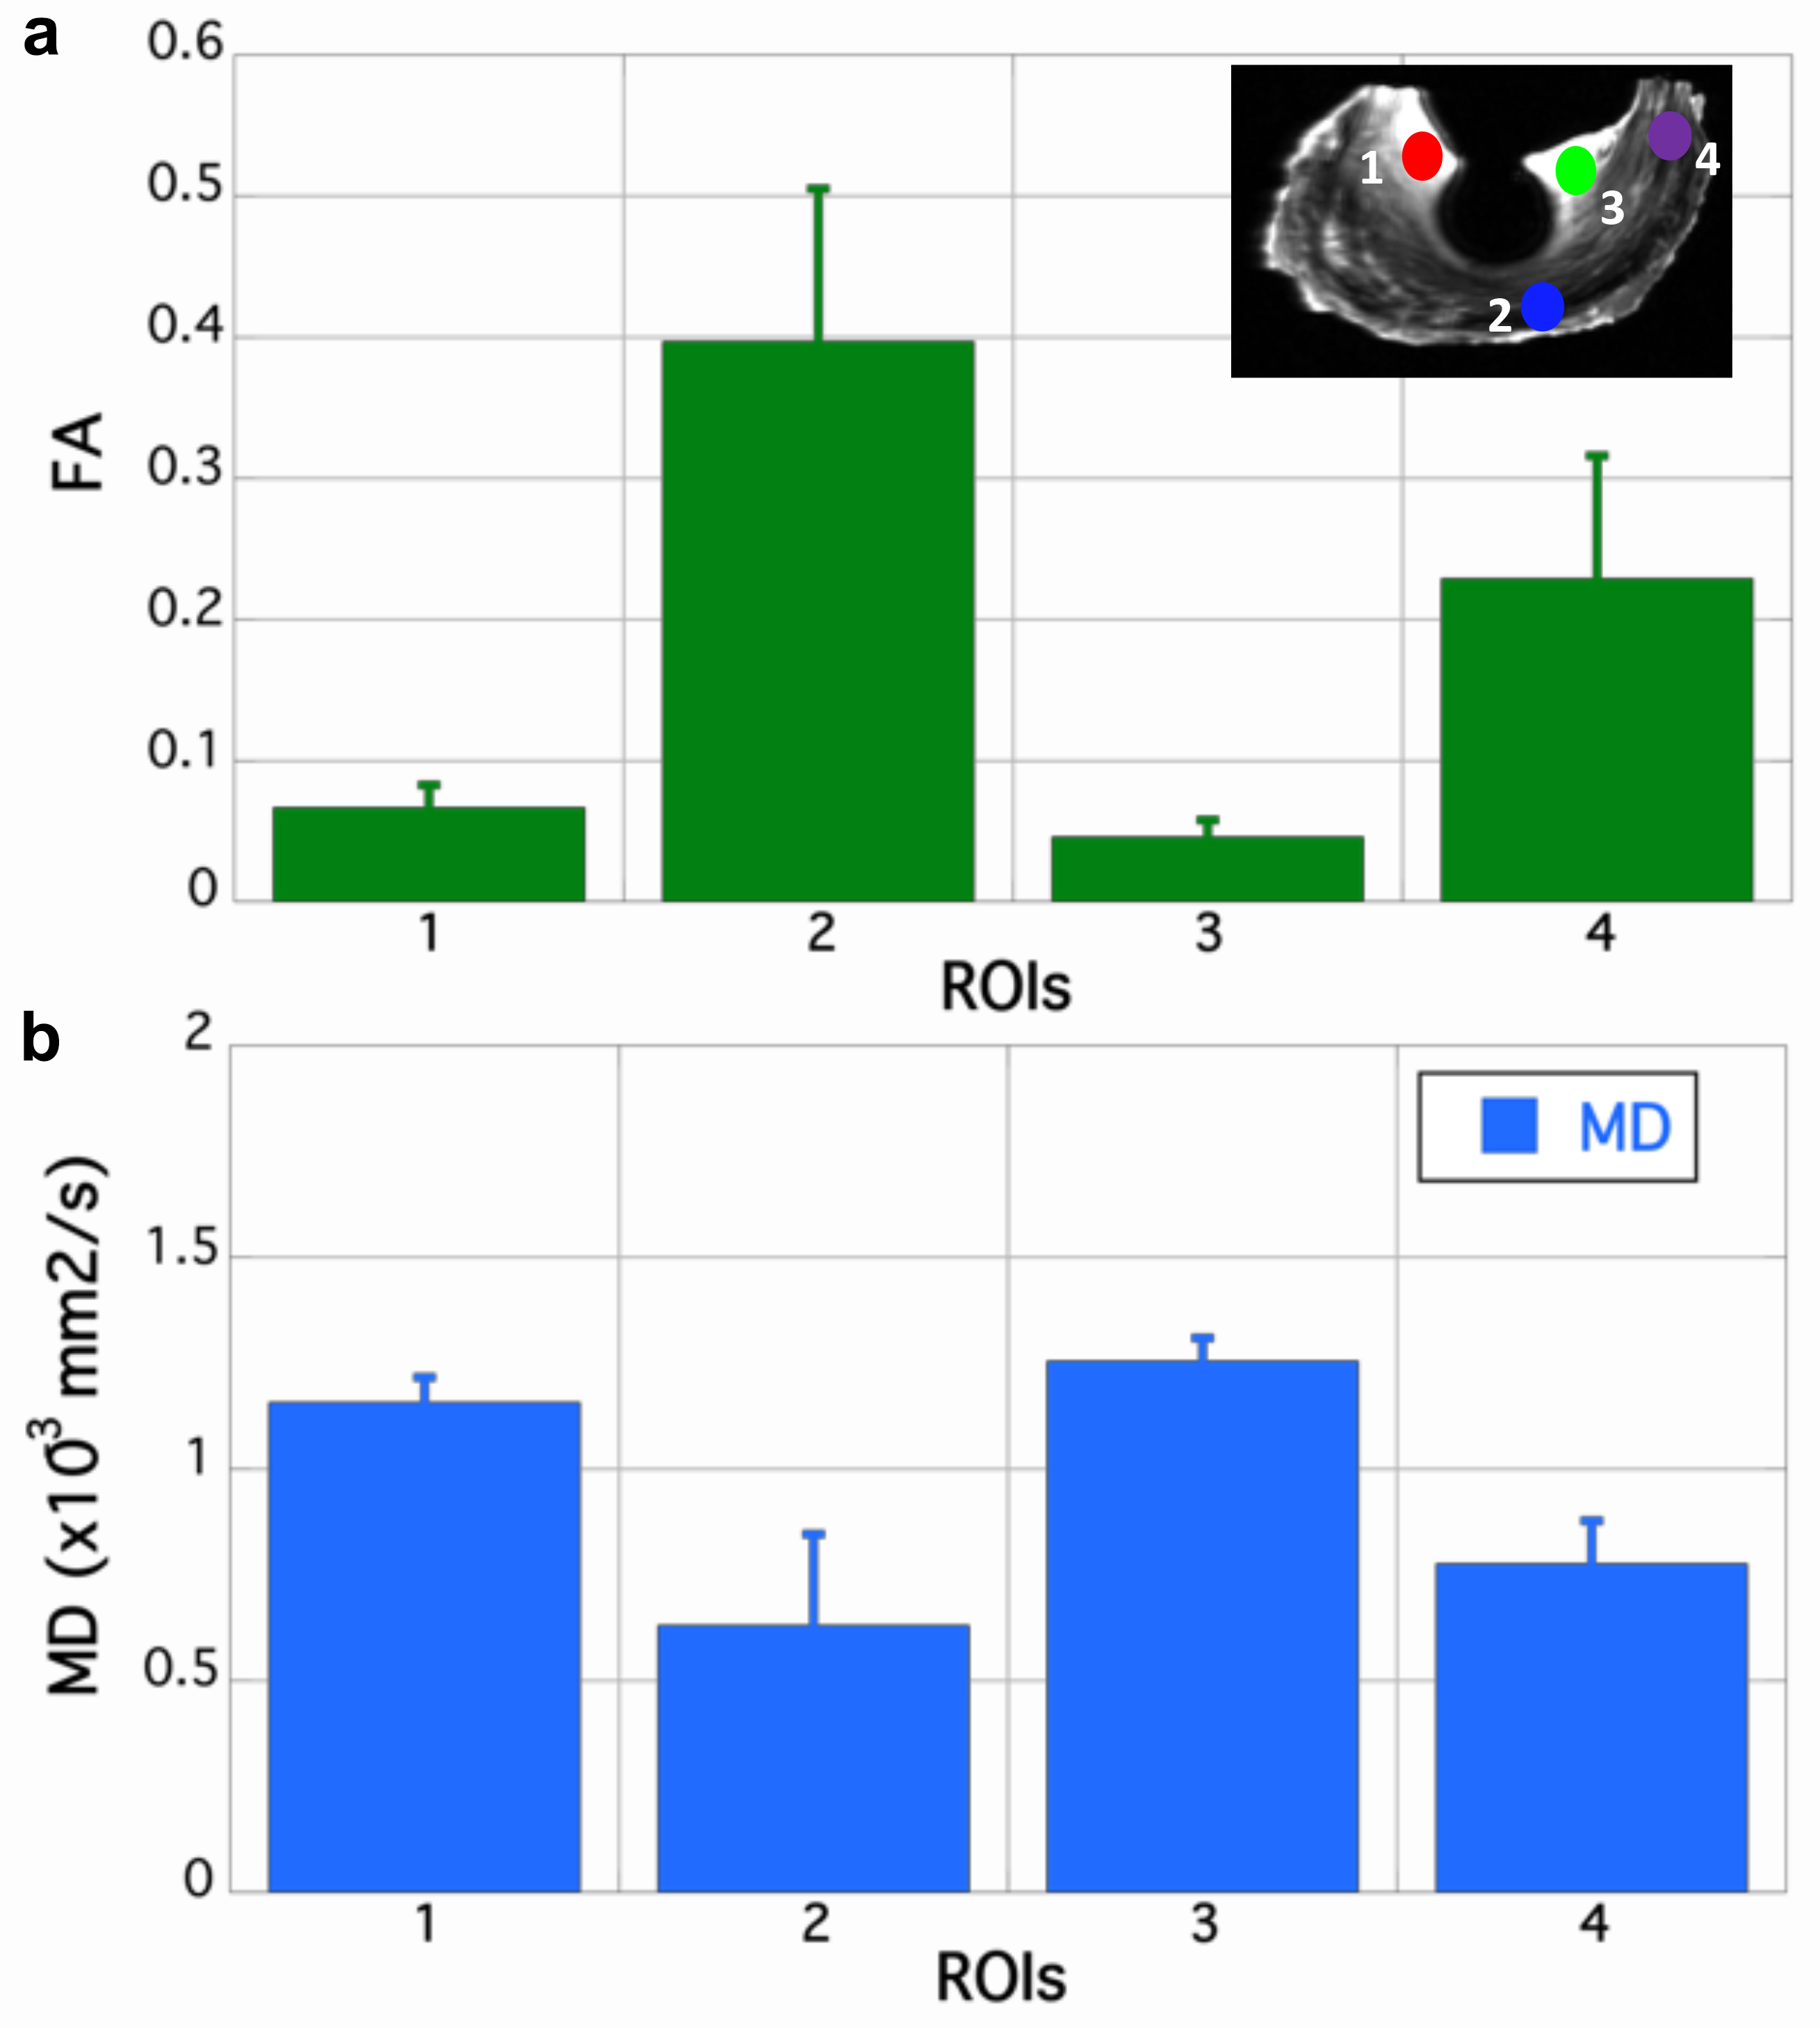
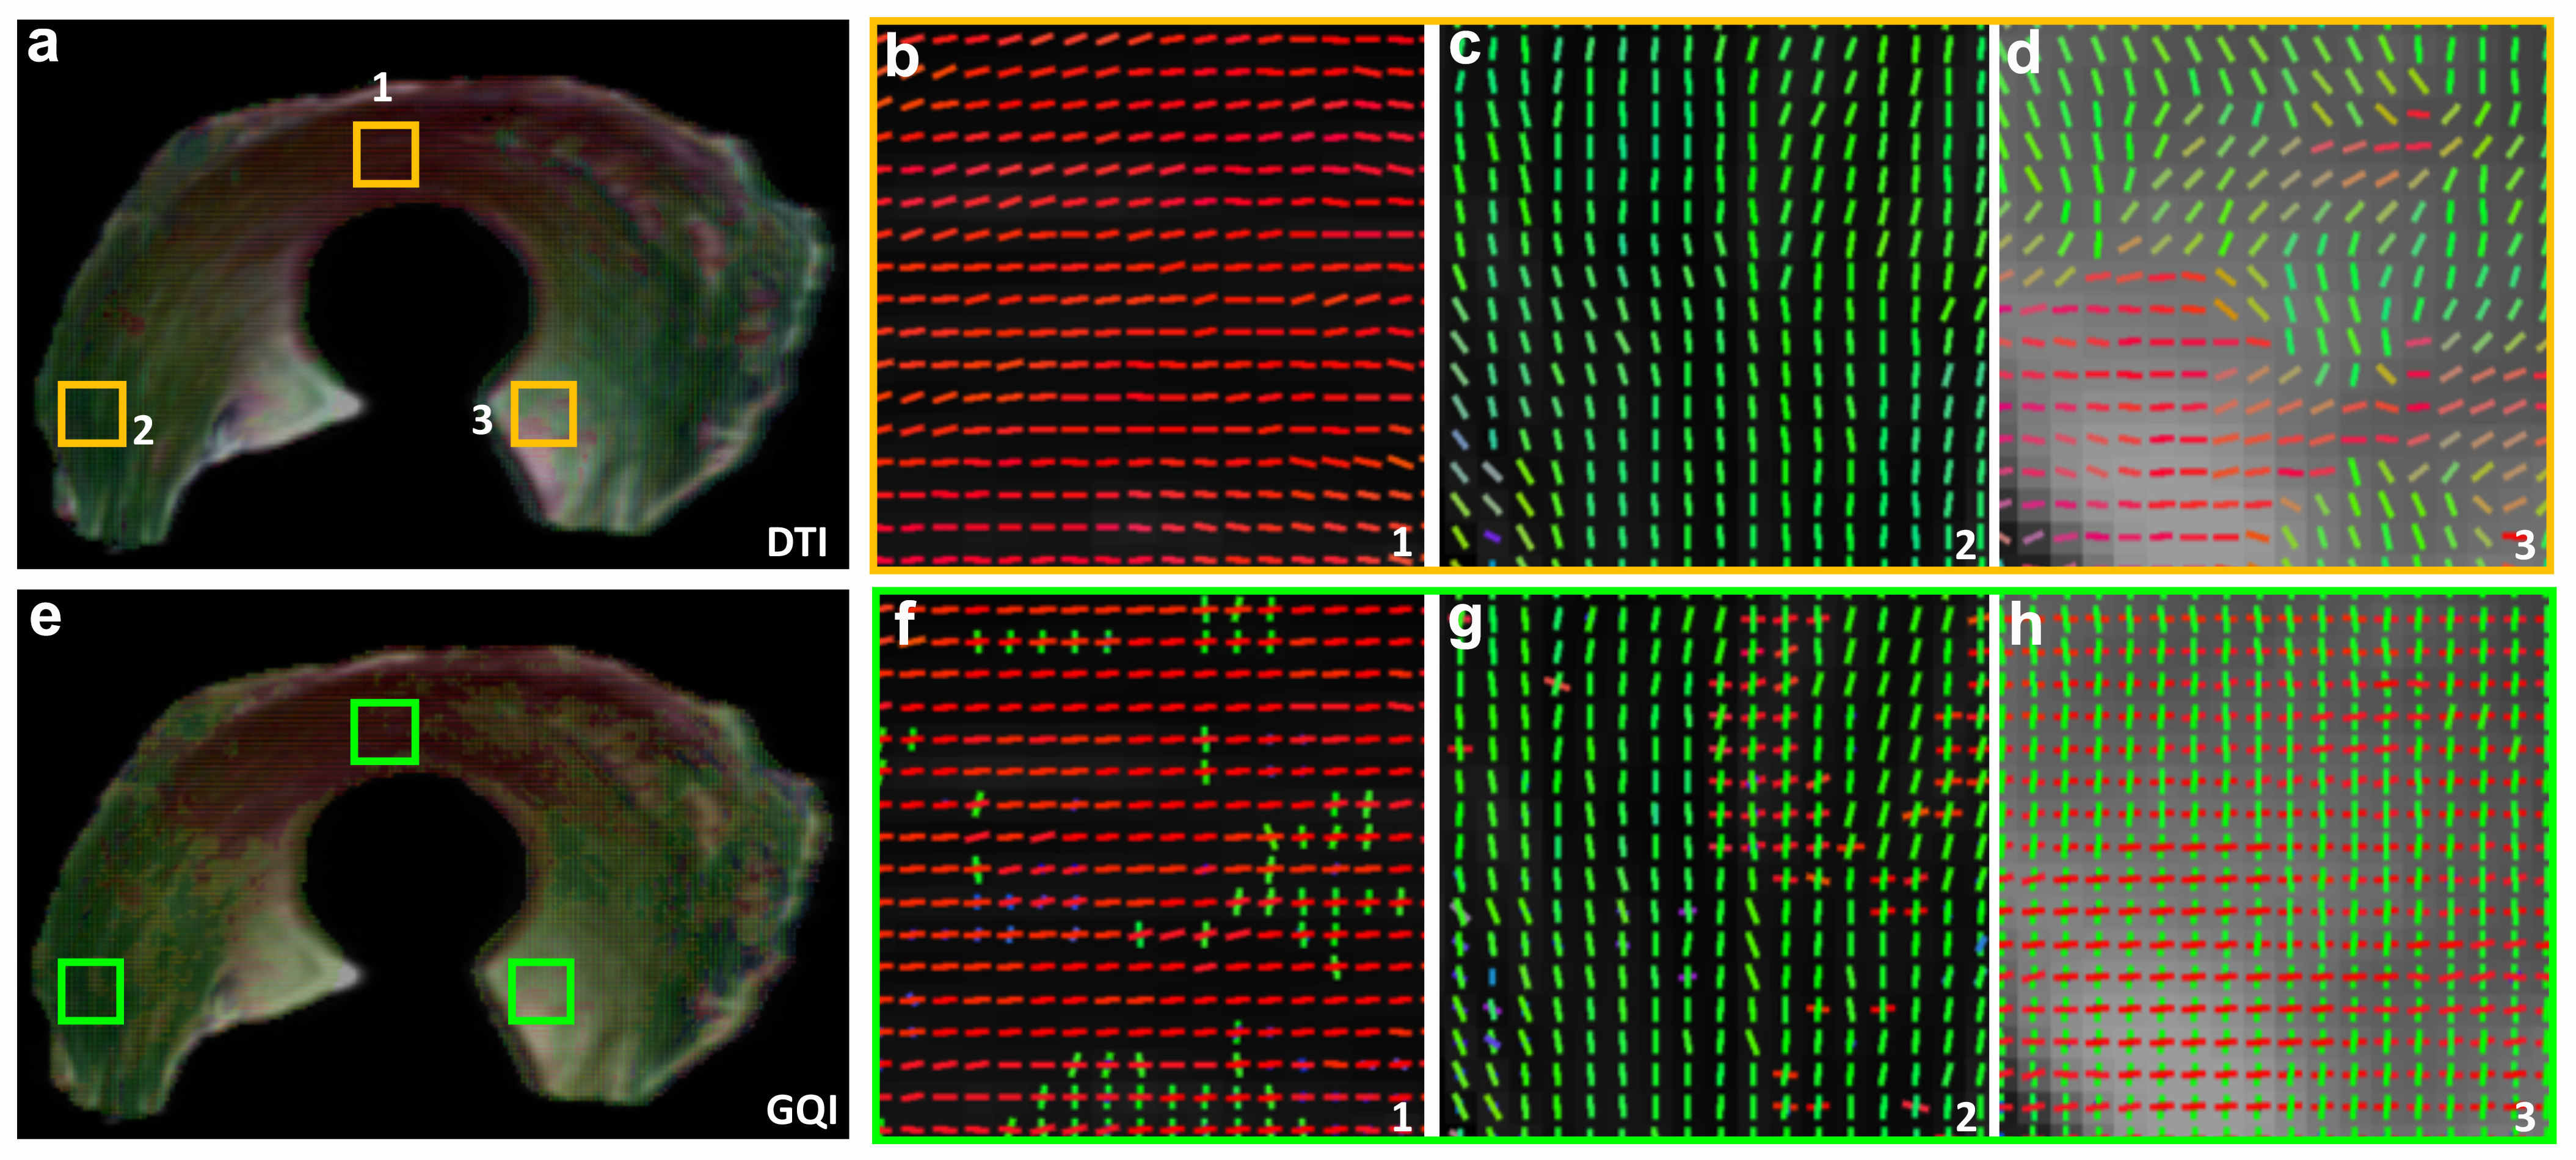
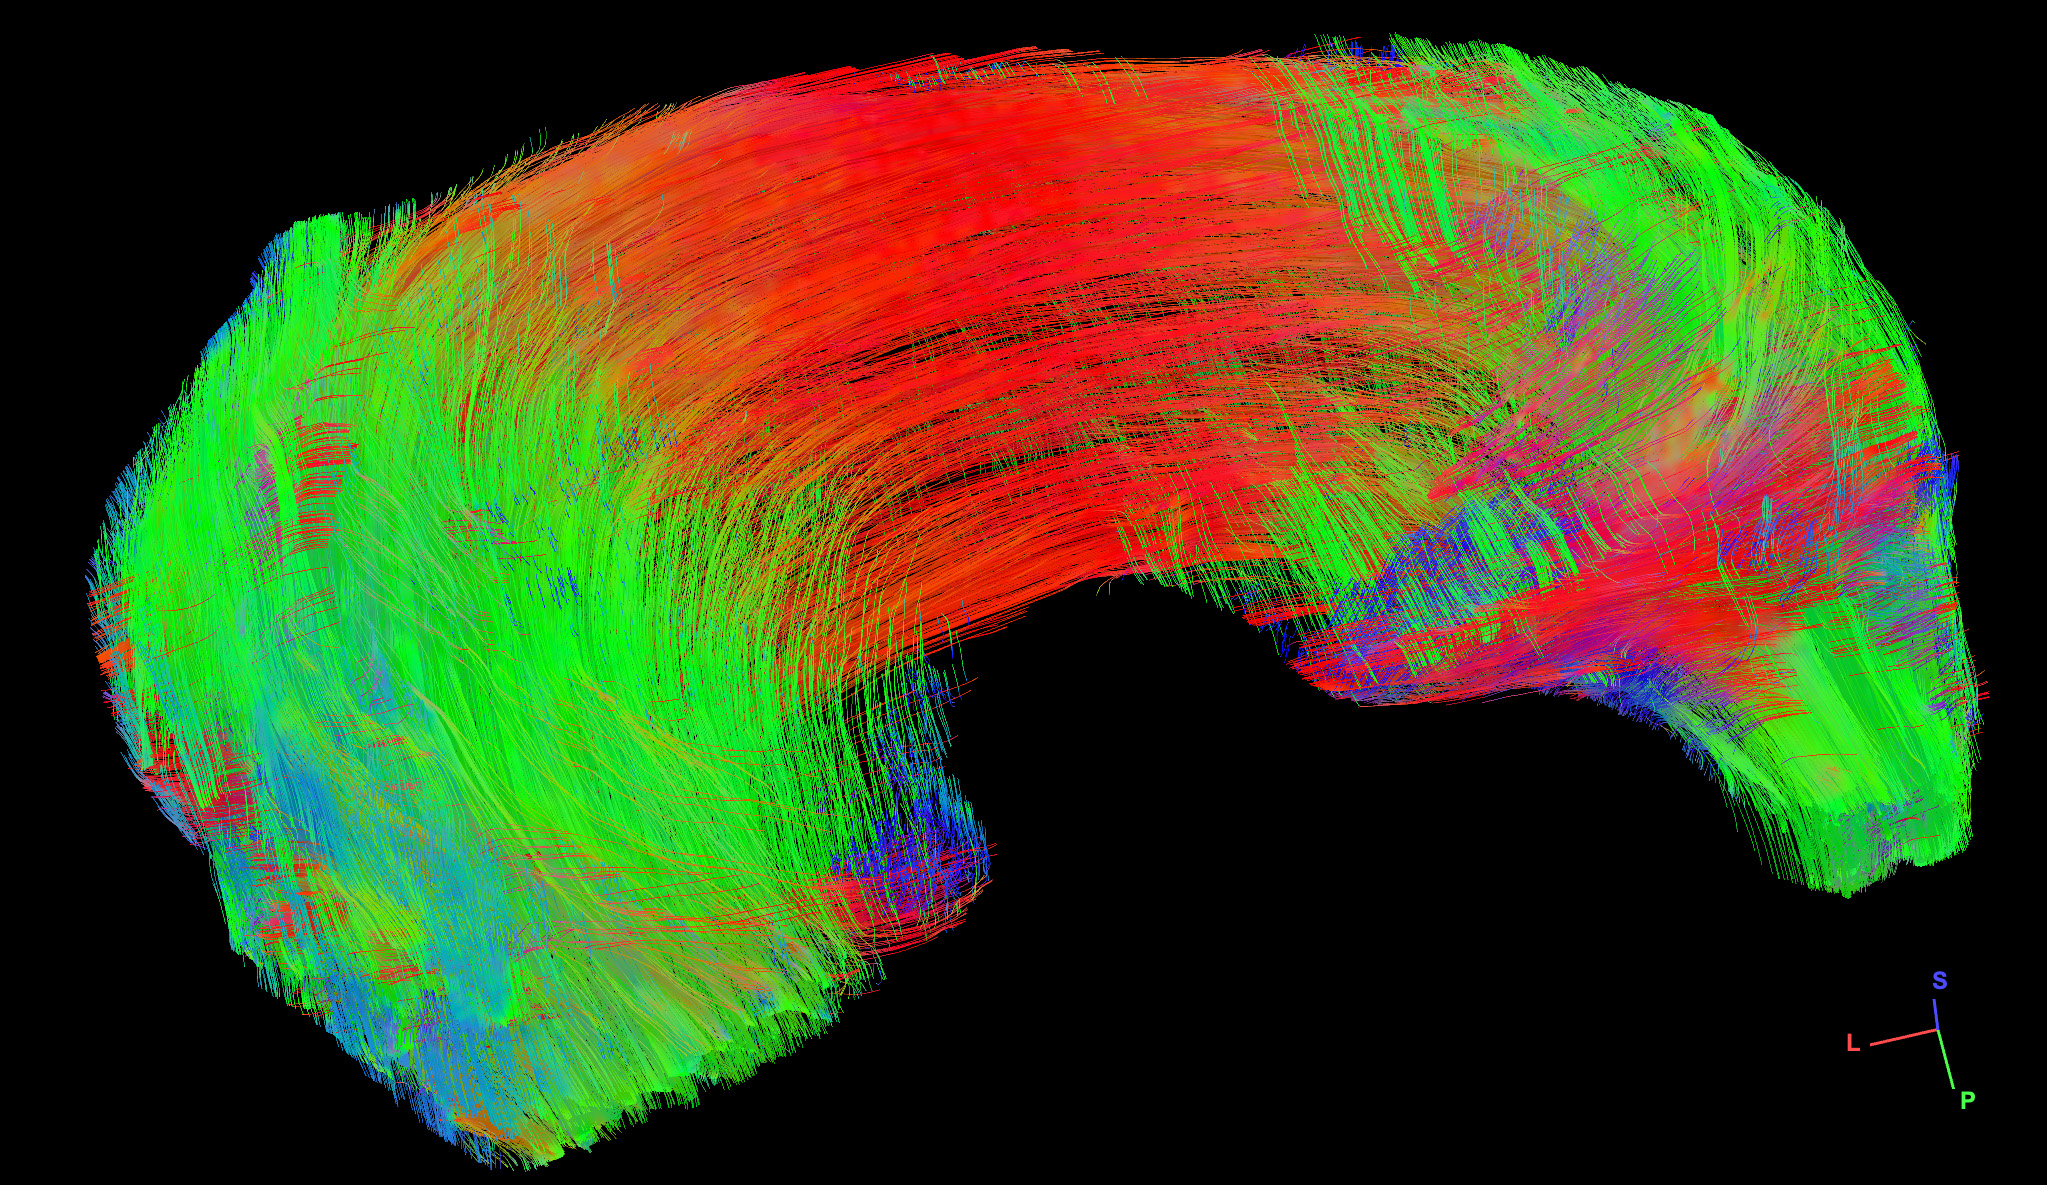
Figure 1 shows the representative b0 (a), FA (b), Color-FA (c), MD (d), and diffusion weighted images (DWI, e) at 125 µm isotropic resolution. The image intensity variation of meniscus is apparent in b0 image (red and green arrows, a), MD image (d), and DWI image (e). The FA values also vary at different part of the meniscus, probably due to the fiber orientations and fiber densities. The fiber direction can be distinguished in the Color-FA image by different colors (c). Figure 2 shows the FA (a) and MD (b) values at different regions of meniscus. These values are derived from the ROIs delineated in b0 images (a) by different colors. The FA values vary from 0.05 to 0.40, while the MD values vary from 0.63 to 1.26 x 10⁻³ mm2/s. Figure 3 demonstrates the fiber orientation images of meniscus resolved by DTI (a-d) and GQI (e-h). Compared to DTI, there are numerous crossing fibers existing in meniscus using GQI. Crossing fibers are shown in all the 3 ROIs (green boxes, e), while region 3 is dominated by the crossing fibers. Figure 4 illustrates the whole meniscus tractography with complex fiber distributions, where the radial fibers, circumferential fibers, and cross fibers can be resolved by GQI method.Discussion and Conclusion
This study demonstrates that both FA and MD values exhibit strong inhomogeneity in different regions of meniscus. The lower FA regions may be related to the complex fiber distributions. High angular resolution dMRI can nondestructively characterize the complex collagen fiber orientations and architectures of meniscus. The diffusion tractography further helps to visualize the ultrastructure and quantifying integrity of fibril collagen network. The dMRI may help visualize complex meniscal tears that are challenging with conventional imaging and this capacity can provide unique insight in animal studies of degenerative joint disease.Acknowledgements
This work was supported by NIH/NIBIB P41 EB015897, NIH 1R01NS096720-01A1, NIH AR073221, Orthopaedic Research and Education Foundation Grant with Funding Provided by the Musculoskeletal Transplant Foundation, and Charles E. Putman MD Vision Award of the Department of Radiology, Duke University School of Medicine.References
1. Petersen W, Tillmann B. Collagenous fibril texture of the human knee joint menisci. Anat Embryol (Berl) 1998;197(4):317-324.
2. Steele JAM, McCullen SD, Callanan A, Autefage H, Accardi MA, Dini D, Stevens MM. Combinatorial scaffold morphologies for zonal articular cartilage engineering. Acta Biomater 2014;10(5):2065-2075.
3. Li Q, Qu FN, Han B, Wang C, Li H, Mauck RL, Han L. Micromechanical anisotropy and heterogeneity of the meniscus extracellular matrix. Acta Biomater 2017;54:356-366.
4. Wang N, Mirando AJ, Cofer G, Qi Y, Hilton MJ, Johnson GA. Diffusion tractography of the rat knee at microscopic resolution. Magnetic resonance in medicine 2019;81(6):3775-3786.Sweigart MA, Athanasiou KA. Toward tissue engineering of the knee meniscus. Tissue Eng 2001;7(2):111-129.
5. Sweigart MA, Athanasiou KA. Toward tissue engineering of the knee meniscus. Tissue Eng 2001;7(2):111-129.
6. Yeh FC, Wedeen VJ, Tseng WY. Generalized q-sampling imaging. IEEE Trans Med Imaging 2010;29(9):1626-1635.
Figures