2795
Multi-parametric MRI in the evaluation of lumbar intervertebral disc and cartilage endplate degeneration at clinical 3 T1The affiliated Jiangning hospital of Nanjing medical university, Nanjing, China, 2GE Healthcare, MR Research China, Beijing, China, 3GE Healthcare, MR Research China, Nanjing, China
Synopsis
multi-parametric MRI was applied to qualitatively and quantitatively investigate the degenerations of lumbar intervertebral disc and cartilage endplate. After measuring twenty-nine patients with low back pain, we found that, for intervertebral discs, its relaxation properties of T2 and T1rho, the image SNR as well as the fat fraction revealed strong correlations with its degeneration degrees. Moreover, zero echo time (ZTE) imaging also showed promise in the visualization of cartilage endplate. Therefore, multi-parametric MRI can be considered an effective tool in the evaluation of spinal degeneration, especially at the early stage.
Introduction
The degeneration of lumbar intervertebral disc and cartilage endplate is the leading cause of pain and disability in Chinese population1. Recently, many MRI studies have shown the feasibility in the diagnosis of spinal degeneration diseases, by investigating the morphological alterations or relaxation properties2-4. However, none study has performed a systematic assessment for both diseases at different severities.Zero-echo-time (ZTE) MRI, as a relative novel imaging technique, has been widely used in musculoskeletal imaging for high signal-to-noise-ratio (SNR) and insensitivity to local field inhomogeneities5. It is thus assumed in this study that this technique might have the potential to detect the degenerations of lumbar intervertebral disc and cartilage endplate morphologically.
Therefore, this study aimed to qualitatively and quantitatively investigate the degenerations of both intervertebral disc and cartilage endplate at different severities with multi-parametric MRI. To achieve this goal, the morphological features, the relaxation properties (i.e., T2 and T1rho) and the fat content of both intervertebral disc and cartilage endplate in patients with different severities were assessed.
Materials and methods
SubjectsTwenty-nine patients (mean age: 44±5.65 years), suffering from low back pain, were recruited in this study.
MRI experiment
All MR experiments were performed at a 3T-MR scanner (750W, GE, USA) equipped with an 8-channel spinal coil. Routine T2-weighted MRI, ZTE imaging, T2 mapping, T1rho mapping as well as iterative-decomposition-of-water-and-fat-with-echo -asymmetry-and-least-squares estimation (IDEAL-IQ) imaging were applied for each patient.
For 3D-ZTE imaging, the scan parameters were of field-of-view (FOV) =300x300mm2,slice thickness=4.0mm, number of slice=78, flip angle=5degree, matrix size=200x384, NEX=3.0, and bandwidth=25Khz.
A spin-echo based multi-TE sequence was used for T2 mapping measurement. The scan parameters included FOV=240x240mm2, TR=600ms, eight TEs from 8.6 to 68.7ms, matrix size=256x192, slice thickness=6ms, number of slices=13, and bandwidth=31.25Khz.
For T1rho measurement, a 3D spoiled-gradient-echo based sequence with a 500Hz spin lock frequency for T1rho preparation and four TEs (1.7, 10, 30, 60ms) was applied. Other scan parameters included FOV=300x300mm2, matrix size=256×192, TR=7.3ms, slice thickness=7.0mm, number of slices=50and bandwidth=62.5Khz.
The IDEAL-IQ sequence was used to measure the fat fraction in tissues. The following scan parameters were applied, including FOV=240x240mm2, TR=11.7ms, six TEs from 1.6 to 6.6ms, matrix size=256x224, number of slices=46, slice thickness=5.0mm, and bandwidth=111.11Khz.
Total scan time was less than 40 minutes.
Data analysis
T2 and T1rho maps were respectively obtained by fitting multi-TE data with the mono-exponential model:
S(TE) = S0*exp(-TE/TX)
, where S(TE) is the signal intensity at a specific TE, S0 is the pseudo-spin density and TX represents T2 or T1rho.
The parametric fat fraction maps were then automatically calculated after running IDEAL-IQ sequence.
Regions of interest (ROIs) for nucleus pulposus, anterior and posterior annulus fibrosus were manually drawn based on T2-weighted images (Figure.1). These ROIs were then copied onto T2 and T1rho maps. Separate ROIs were also chosen for both upper and lower cartilage endplates from L1/L2 to L5/S1 on fat fraction maps and ZTE images.
The SNR of nucleus pulposus at ZTE images (Figure.2) was also calculated:
SNR = (SIroi - SIbackgroud)/SDbackground
, where SIroi and SIbackgroud are the signal intensity of the ROI for nucleus pulposus and for the background, and the SDbackgound is the corresponding standard deviation of the background.
In SPSS software, the embedded independent-two-sample nonparametric analysis was separately used to estimate the differences of T2, T1rho and SNR values of degenerated intervertebral discs with different severities, and of fat fraction values between health and degenerated endplates. Additionally, Spearman correlation analysis was applied to evaluate the relationships among T2, T1rho and SNR values of intervertebral disc components. Significance threshold was set as p<0.05.
Results
Of 29 patients, 145 discs were included for assessment. According to Pfirrmann standard6, six were classified as gradeⅠ, eighty-four as gradeⅡ, fourteen as gradeⅢ, thirty-two as gradeⅣ, and six as gradeⅤ.T2 values of nucleus pulposus at gradeⅠ showed separately significant differences with those at gradeⅢ, Ⅳ, and Ⅴ (all p<0.05;Figure.3). Meanwhile, nucleus pulposus at gradeⅡ had significantly different T2 values relative to those at grade Ⅲ, Ⅳ and Ⅴ (all p<0.05). In comparison, similar patterns of T1rho distribution of nucleus pulposus at different grades were found. Additionally, for posterior annulus fibrosus, the T1rho values were significantly different between gradeⅡ and Ⅳ (p<0.001).The differences between the SNR values of intervertebral discs at different severities were also compared. A significant difference was revealed between gradesⅠand Ⅳ(p=0.003). Different fat fractions were found between healthy and diseased cartilage endplates (p=0.002).A significant correlation was obtained between T1rho and T2 values for all nucleus pulposus (r=0.686;p<0.001;Figure.4).Discussion and conclusion
In this study, intervertebral disc and endplate degenerations were systematically investigated with multi-parametric MRI. For intervertebral discs, its relaxation properties of T2 and T1rho and the image SNR revealed strong correlations with its degeneration degrees. Moreover, ZTE imaging also showed promise in the visualization of cartilage endplate. Additionally, the IDEAL-IQ derived fat fraction might be a biomarker to detect the endplate degeneration.In conclusion, these multi-parameters applied can be considered effective biomarkers to detect early spinal degeneration.
Acknowledgements
Thank the orthopedic doctor for his case and cooperation of enrolled patients.References
1.RajPP.Intervertebraldisc:anatomy-physiology-pathophysiology-treatment. Pain Pract 2008;8:18–44. [PubMed: 18211591]
2.Karakida O, Ueda H, Ueda M, Miyasaka T. Diurnal T2 value changes in the lumbar intervertebral discs. Clin Radiol 2003;58:389–392. [PubMed: 12727168]
3.Johannessen W, Auerbach JD, Wheaton AJ, Kurji A, Borthakur A, Reddy R, Elliott DM. Assessment of human disc degeneration and proteoglycan content using T1rho-weighted magnetic resonance imaging. Spine 2006;31:1253–1257. [PubMed: 16688040]
4.Nguyen AM, Johannessen W, Yoder JH, Wheaton AJ, Vresilovic EJ, Borthakur A, Elliott DM.Noninvasive quantification of human nucleus pulposus pressure with use of T1rho-weightedmagnetic resonance imaging. J Bone Joint Surg Am 2008;90:796–802. [PubMed: 18381318]
5. Weiger M, Pruessmann KP, Bracher AK. High-resolution ZTE imaging of human teeth. NMR Biomed. 2012;25:1144-51.6.Adams MA, Roughley PJ. What is intervertebral disc degeneration, and what causes it? Spine 2006;31:2151–2161. [PubMed: 16915105].
6.Adams MA,Roughley PJ.What is intervertedral disc degederation,and what causes it?Spine 2006;31:2151-2161.[Pudmed:16915105].
Figures
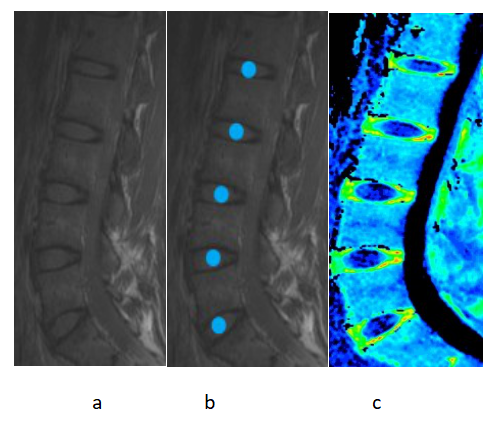
Figure1
Multi-echo T2-weighted images in sagittal view were acquired, and T2 maps(a) were calculated on a pixel-by-pixel basis. A representative T2-weighted image at TE=8.6ms is shown. Mean T1rho and T2 values were calculated in 5mm-diameter regions of interest(b) that were drawn manually in the center of the nucleus in discs L5/S1, L4/L5, L3/L4,L2/L3, and L1/L2 for each subject. A T2 color map(c) of the intervertebral discs in a young patient is shown. T1rho maps were obtained analogously.
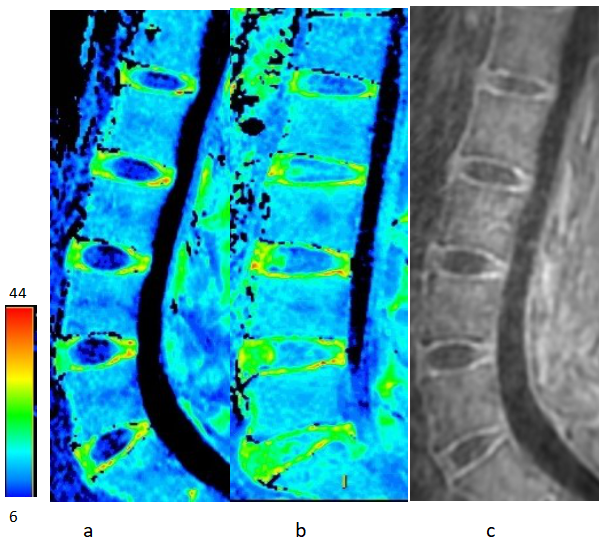
Figure2
Representative T2 color maps from (a) a 21-years-old subject (Pfirrmann grades L5/S1 = 1, L4/L5 = 1, L3/L4 = 1, L2/L3 = 1, L1/L2 = 2); (b) a 44-years-old subject with mildly degenerated discs (Pfirrmann grades L5/S1 = 4, L4/L5 = 4, L3/L4 = 3, L2/L3 = 3, L1/L2 = 3). (c) The ZTE images of intervertebral disc and cartilage endplate is also presented for the same subject as shown in Figure2a.
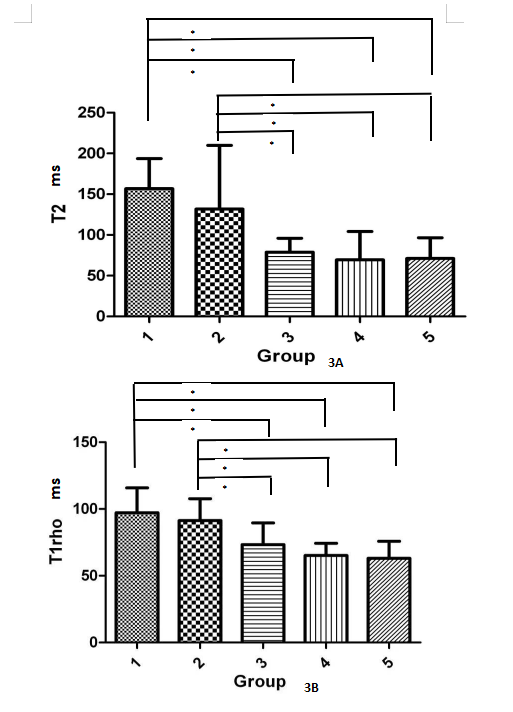
Figure3
The bar-diagrams provide an illustration of the T2 (3A)and T1rho (3B)values at different Pfirrmann grades. Note that the T2 and T1rho values in the Pfirrmann grade 1 discs were significantly different from those in Pfirrmann grade 3,4,5;meanwhile, grade 2 had significantly different T2 and T1rho values relative to those at grade 3,4,5(*P<0.01).
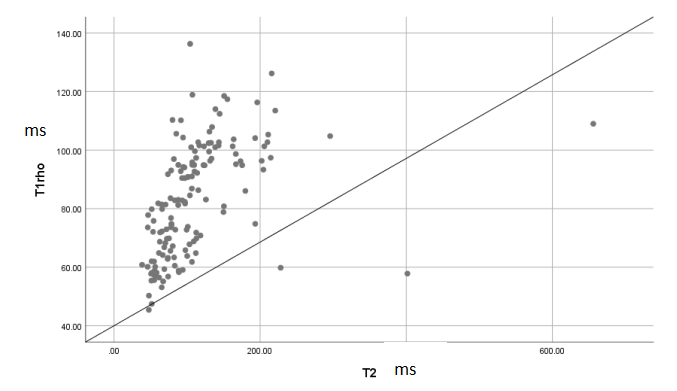
Figure4
Strong correlation between T1rho and T2 values was calculated for all patients included (r = 0.686;p < 0.001).