2786
Quantification of joint capsule laxity of the tibiotalar and subtalar joints in ballet dancers at 3T MRI1Department of Radiological Sciences, University of California, Irvine, Orange, CA, United States, 2Science and Health in Artistic Performance, Ohio University, Athens, OH, United States, 3Department of Dance, The Claire Trevor School of the Arts, University of California, Irvine, Irvine, CA, United States
Synopsis
Joint capsule laxity/thickening is one of predisposing factors of posterior ankle impingement syndrome. The purpose of this study is to quantitatively evaluate size of the tibiotalar and subtalar joint recesses in MR images in ballet dancers, compared to non-dancers. The results showed that posterior subtalar joint recess volume, distal tibiofibular joint area, medial posterior tibiotalar recess area, and medial posterior capsule distance were larger in female dancers than female non-dancers. These findings indicate that joint capsule laxity can be measured quantitatively and used for quantitative evaluation of posterior ankle impingement.
Introduction
Female ballet dancers require large ranges of motion of the ankle in dorsiflexion and plantar flexion, especially during en pointe position with maximum plantar flexion. In general, there is a possibility that the capsule around the tibiotalar and subtalar joints in ballet dancers is distended or loose due to years of weight bearing of this joint in these positions1, causing posterior ankle impingement2. The purpose of this study is to quantitatively measure joint recess volumes or areas and capsular distance on ankle MRI in young female ballet dancers and female non-dancers, and compare these values.Methods
The study protocol was approved by the institutional review board, and all subjects provided written informed consent. Ten healthy female non-dancers (mean age: 20.4 yr, range: 19-24), ten female ballet dancers (mean age: 21.7 yr, range: 19-30) and nine male ballet dancers (mean age: 23.1 yr, range: 18-40) were enrolled. All MR studies were performed on a 3.0-T scanner (Achieva, Philips Healthcare, Netherlands) using an 8-channel, dedicated ankle/foot coil. Sagittal images were acquired: fat-suppressed (FS) proton density-weighted imaging (PDWI) with true sagittal angulation parallel to the static magnetic field (B0). Additionally, axial and coronal FS PDWI were obtained. The acquisition parameters were as follows: Sagittal FS PDWI: 2D turbo spin-echo; repetition time (TR)/echo time (TE) = 3958/30 ms, number of excitations (NEX) = 1, and acquisition time = 2 min 30 sec. Axial FS PDWI: 2D turbo spin-echo; TR/TE = 4582/30 ms, NEX = 1, and acquisition time = 4 min 7 sec. Coronal FS PDWI: 2D turbo spin-echo; TR/TE = 3000/30 ms, NEX = 1, and acquisition time = 3 min 48 sec. All images were obtained with field of view (FOV) = 140x140 mm, slice thickness/gap = 3/0 mm, image matrix = 512x512, and number of slices = 20. Volumes of the anterior tibiotalar recess, posterior tibiotalar recess, and posterior subtalar recess were measured as follows. First, the area of the recess was measured in each sagittal plane (Figure 1A) and added up all the areas of each recess throughout sagittal images. Each recess area was manually segmented. The final 3-D volume rendering was generated using OsiriX Lite software (Pixmeo SARL, Geneva, Switzerland) (Figure 1B). Likewise, distal tibiofibular joint recess area was measured in coronal images and recess volume was generated from all manually segmented areas using OsiriX Lite. Among these area measurements, the largest area was defined as posterior and anterior tibiotalar joint area, posterior subtalar joint recess area, and distal tibiofibular joint area, respectively. Additionally, medial posterior joint recess area was selected as the largest area at the medial side of flexor hallucis longus tendon in sagittal plane. In axial plane, maximal medial posterior capsule distance was measured, defined by the distance between the posterior inter-malleolar line and the most posterior point of the distended medial posterior joint capsule at the level of the talar dome (Figure 2). These measurements were statistically compared among female dancers, female non-dancers, and male dancers. Values of p < 0.05 were considered statistically significant.Results
Posterior subtalar joint recess volume was significantly larger in female dancers than female non-dancers (0.130 cm3 vs 0.0646 cm3, p<0.05) (Figure 3) whereas there were no significant differences in other recess volumes (Table 1). There were no significant differences in joint recess volumes between female and male dancers. Distal tibiofibular joint recess area was larger in female dancers than female non-dancers (10.6 mm2 vs 5.49 mm2, p<0.05) (Figure 4) whereas there were no significant differences in other areas (Table 1). The posterior tibiotalar joint tended to be larger in female dancers medially. In fact, medial posterior tibiotalar joint recess area was larger in female dancers than female non-dancers (17.7 mm2 vs 7.64 mm2, p<0.05) (Table 1). Medial posterior capsule distance was larger in female dancers than female non-dancers (7.14 mm vs 4.36 mm, p<0.05) (Table 1). There were no significant differences in medial posterior joint recess or capsule distance between female and male dancers.Conclusion
Joint capsule laxity was measured quantitatively by joint recess volumes or areas and capsular distance in this study and can be used for quantitative evaluation of capsular laxity to assess posterior ankle impingement in ballet dancers.Acknowledgements
No acknowledgement found.References
1. Roges J, Dijkstra P, Mccourt P, et al. Posterior ankle impingement syndrome: A clinical review with reference to horizontal jump athletes. Acta Orthop Belg. 2010;76:572-9.
2. Robinson P, White LM. Soft-tissue and osseous impingement syndromes of the ankle: role of imaging in diagnosis and management. Radiographics. 2002;22(6):1457-69.
Figures
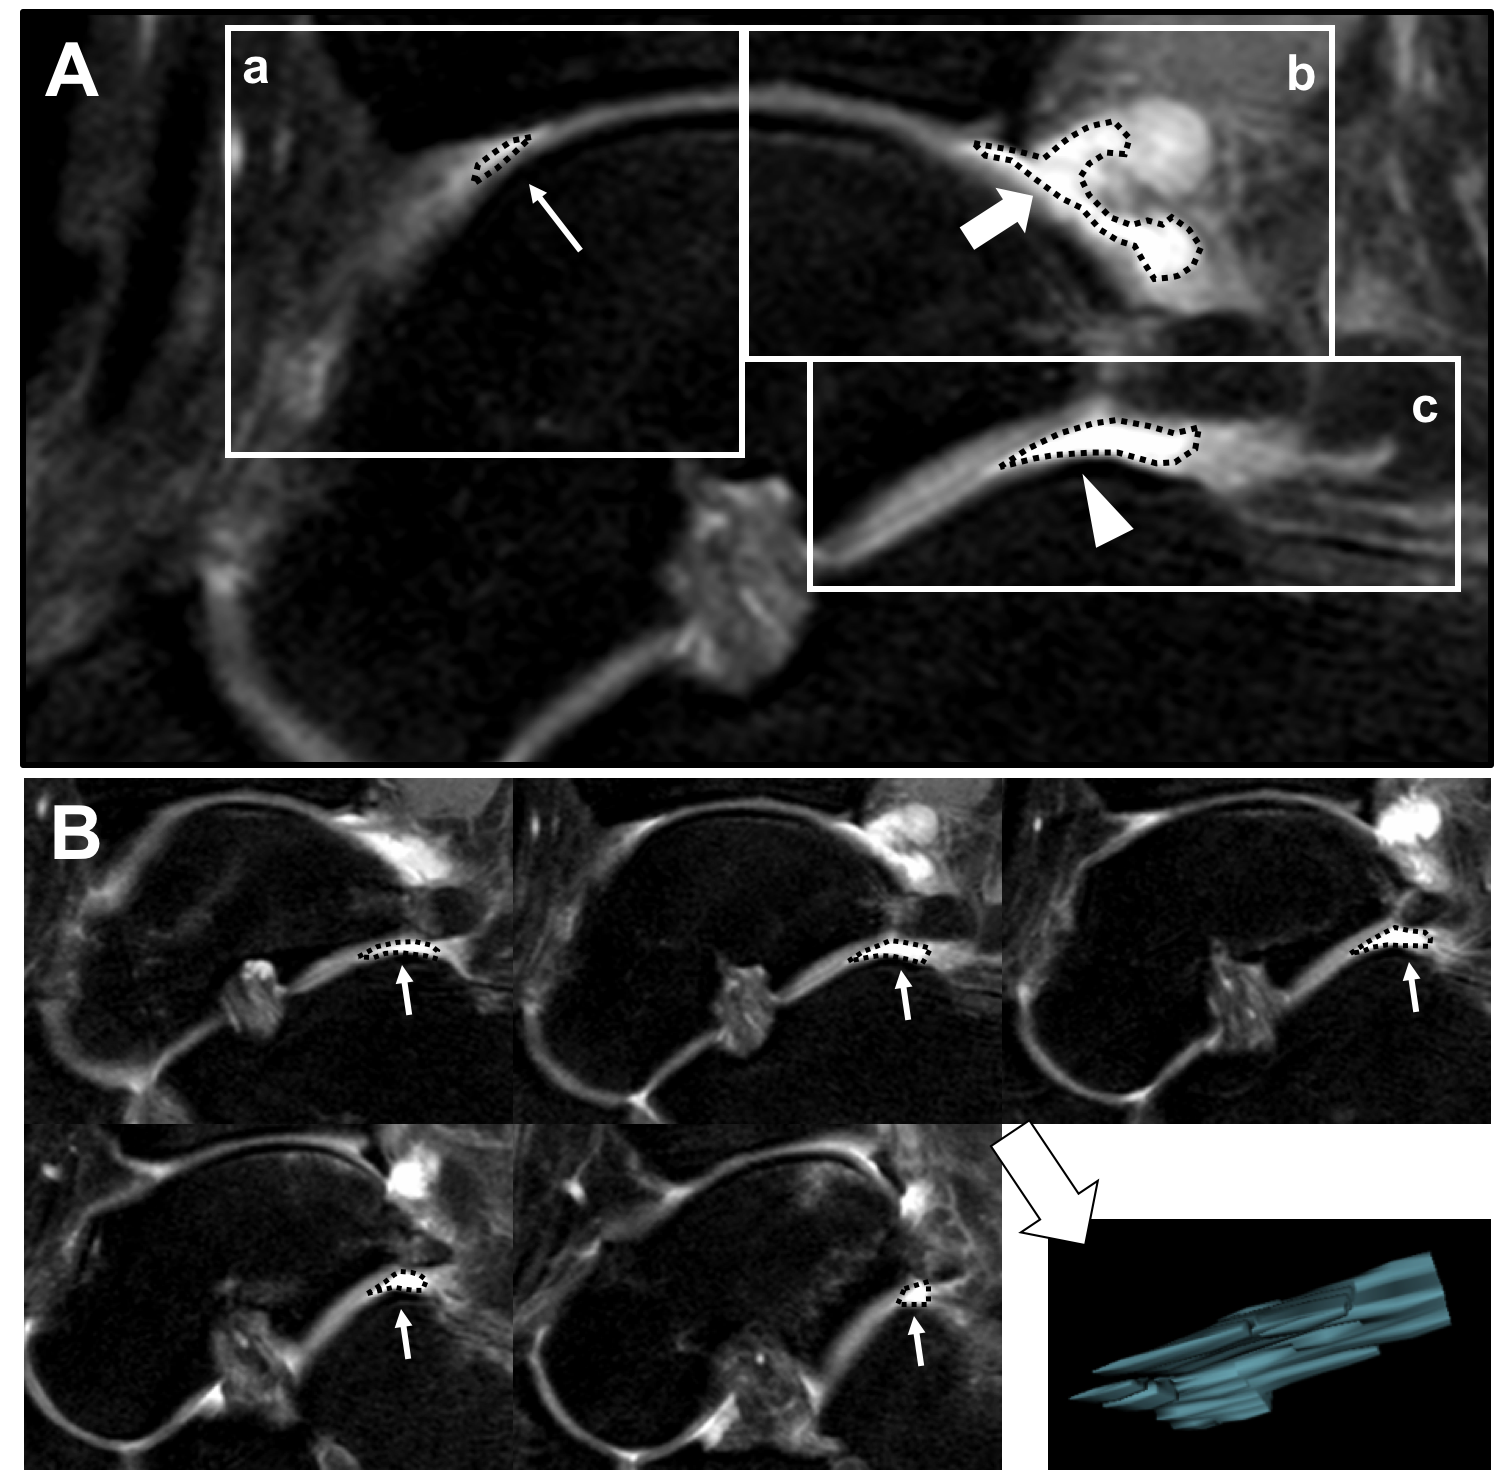
Figure 1.
A: Sagittal FS PDWI MR image of the tibiotalar and subtalar joints. (a) anterior tibiotalar recess (small arrow), (b) Posterior tibiotalar recess (large arrow), (c) Subtalar recess (arrow head).
B: Posterior subtalar joint recess volume measurement. Summation of each subtalar joint recess area x slice thickness were calculated throughout sagittal images using OsiriX Lite software.
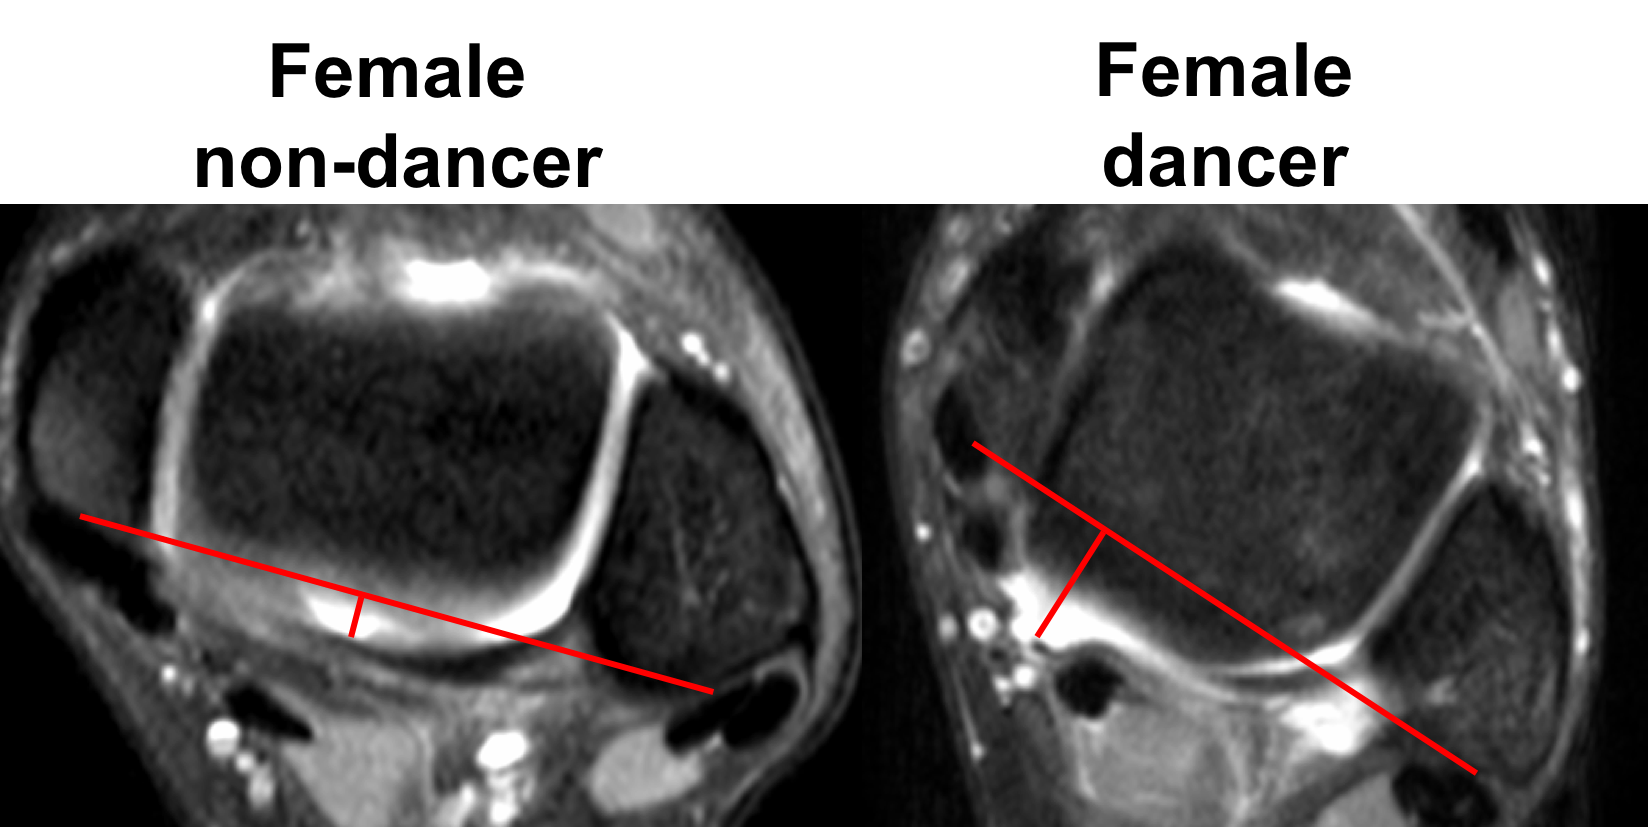
Figure 2.
Maximal medial posterior capsule distance on axial FS PDWI MR images. The distance between the posterior inter-malleolar line (from between posterior medial malleolus and posterior lateral malleolus) and the furthest point of the medial posterior joint capsule was measured at the level of the talar dome.
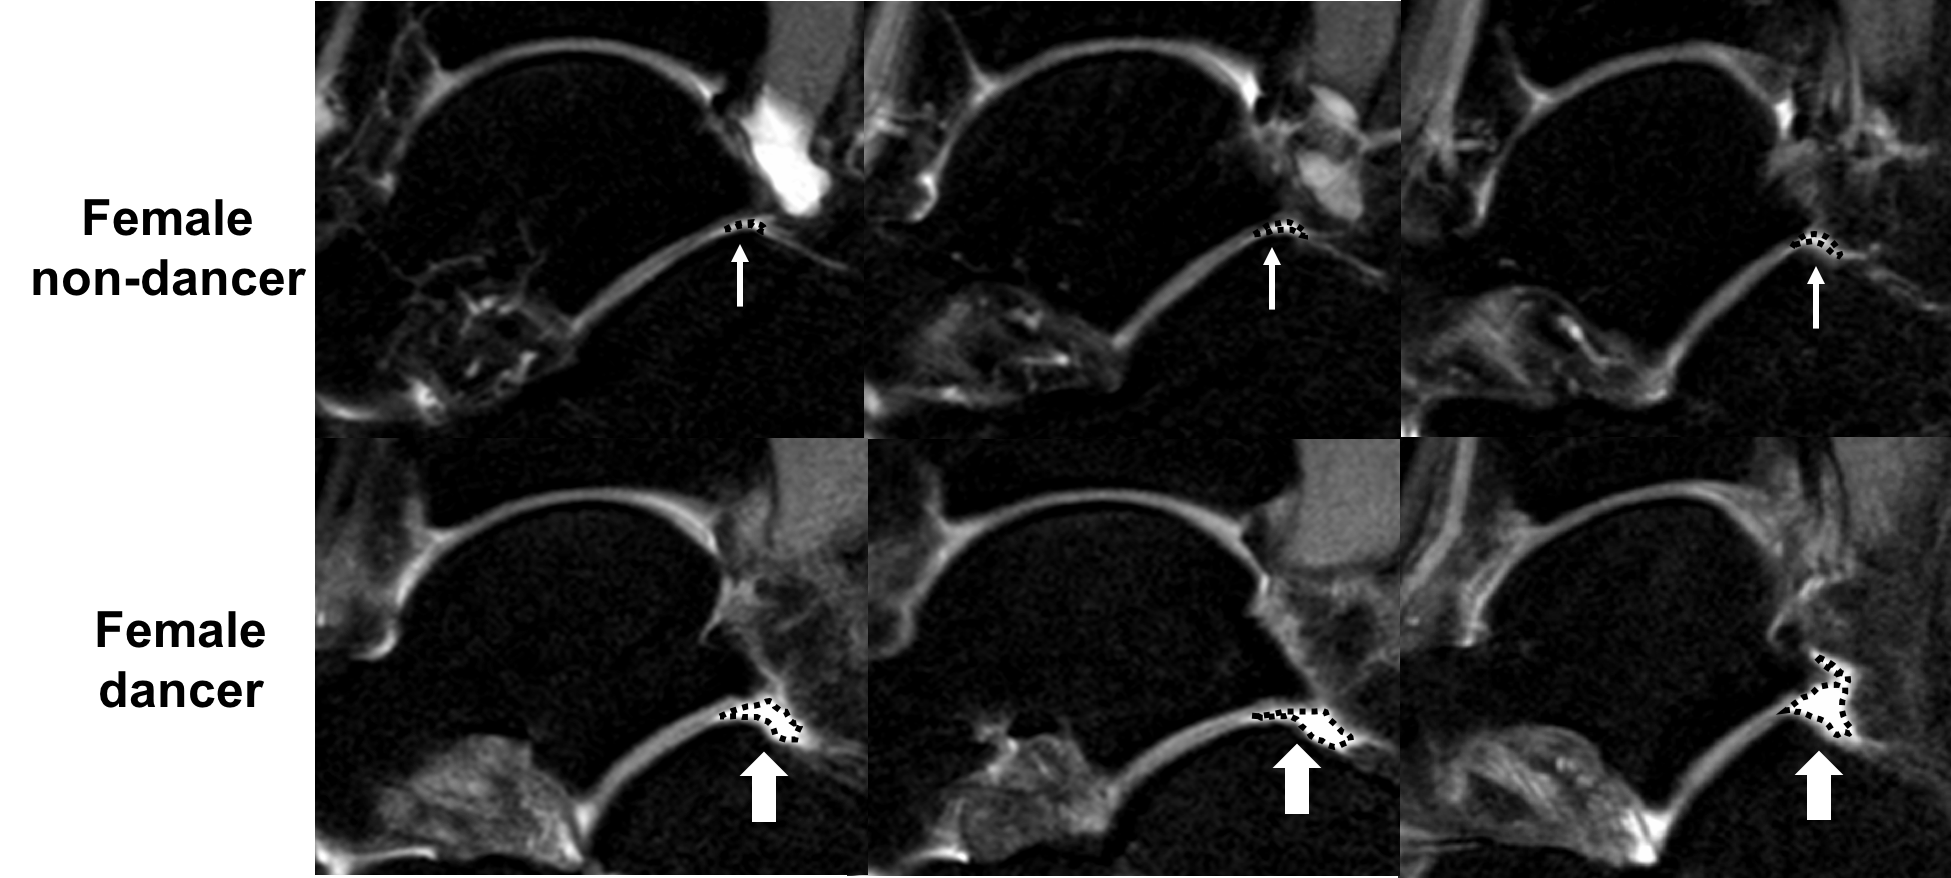
Figure 3.
Sagittal FS PDWI MR images of the posterior subtalar joint. (upper row): Small arrows show the posterior subtalar joint recess areas in female non-dancer. (lower row). Large arrows show the posterior subtalar joint recess areas in female dancer.
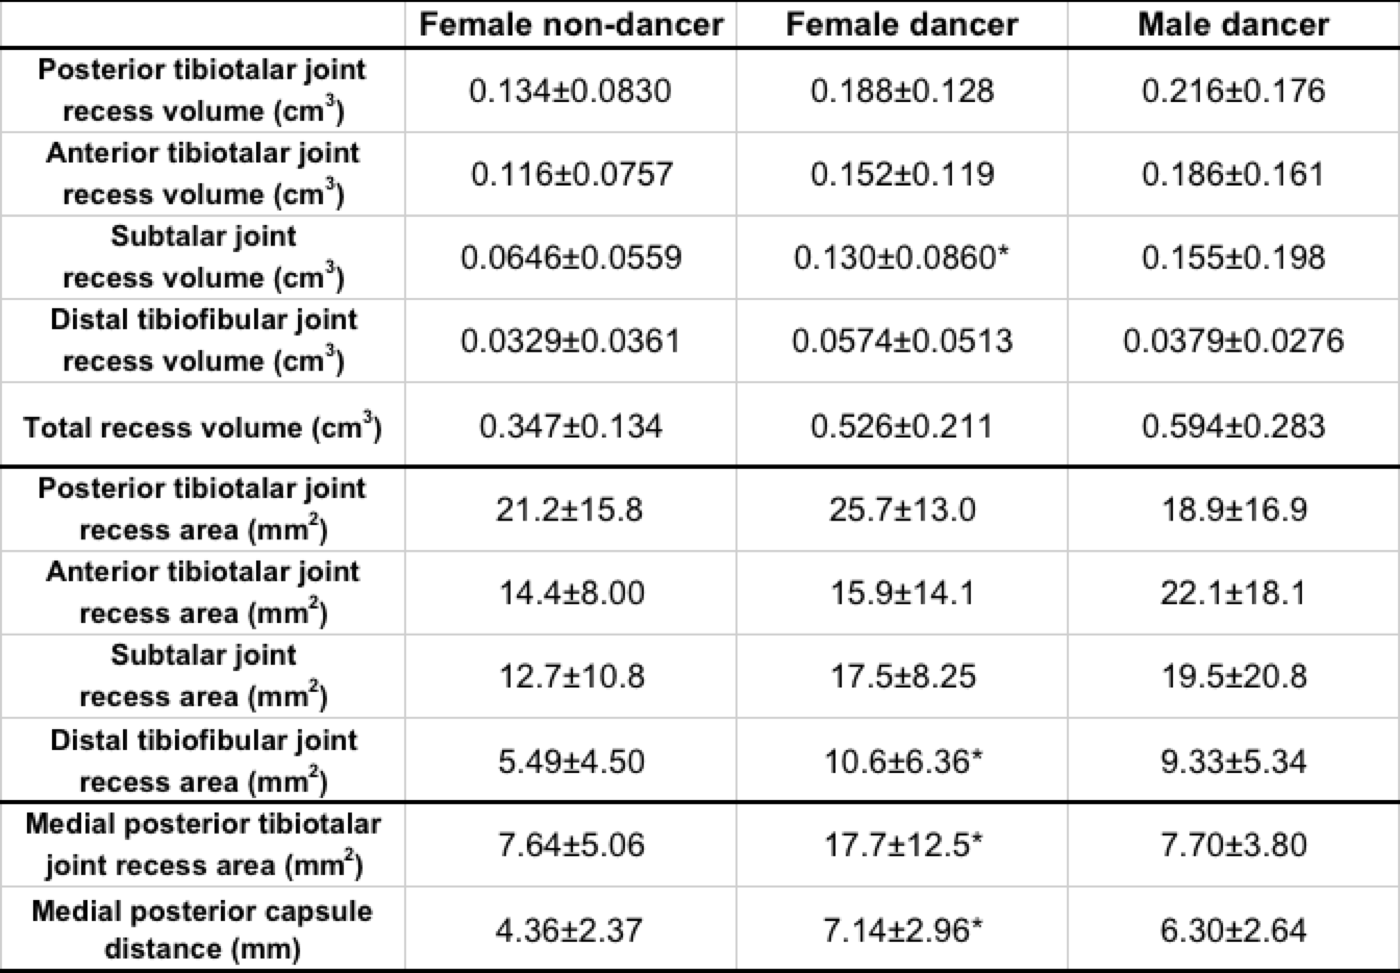
Table 1.
Comparison of posterior and anterior tibiotalar joint, subtalar joint, distal tibiofibular joint recess volume and area, and medial posterior capsule distance among female non-dancer, female dancer, and male dancer
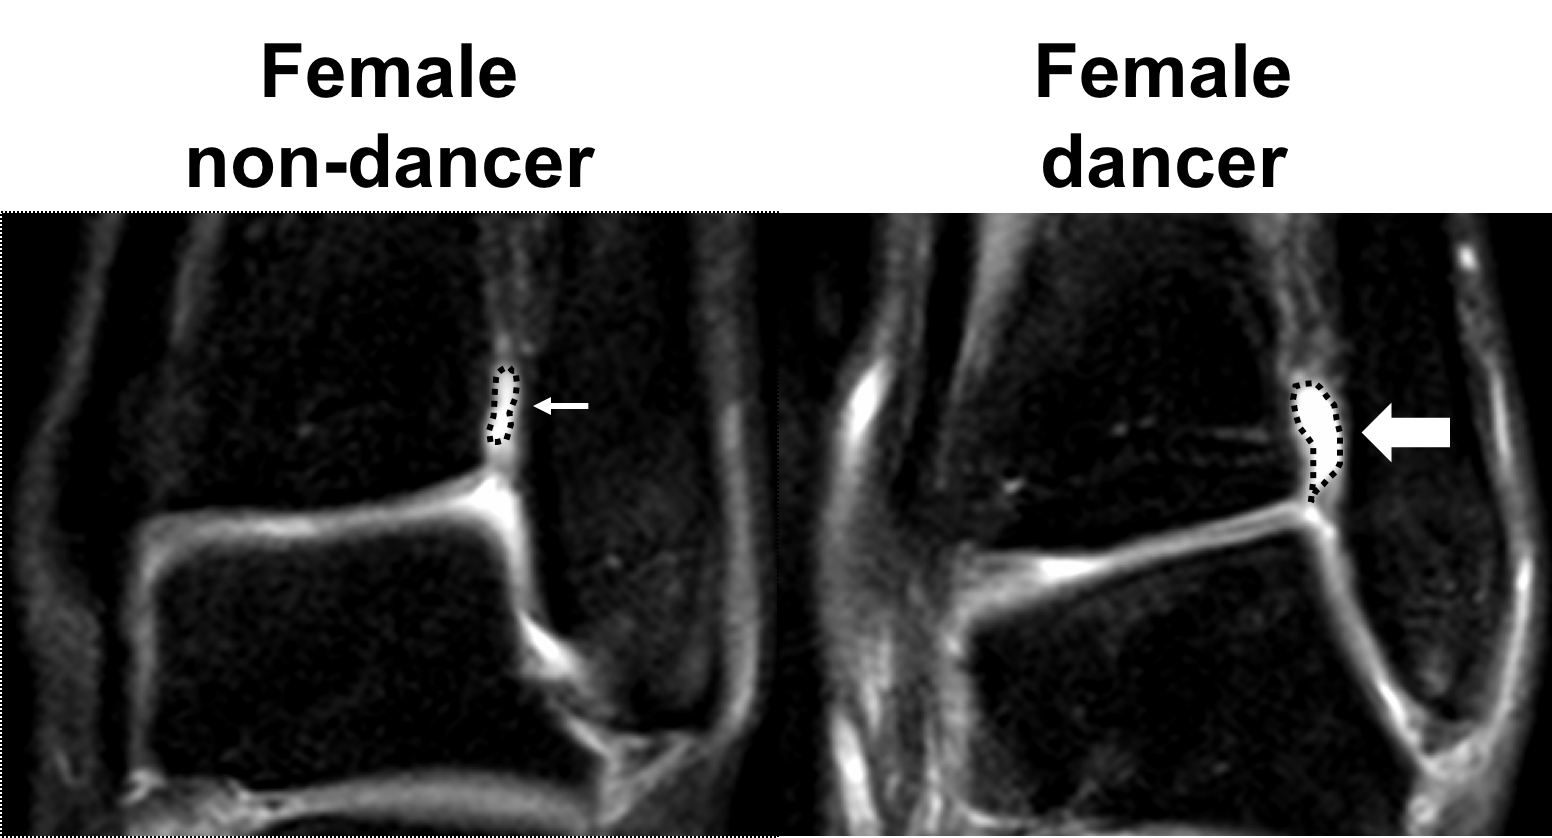
Figure 4.
Coronal FS PDWI MR image of the distal tibiofibular joint. (Left): Small arrow shows the distal tibiofibular joint recess area in female non-dancer. (Right): Large arrow shows the distal tibiofibular joint recess area in female dancer.