2785
Assessment of Ankylosing Spondylitis Activity with Intravoxel Incoherent Motion Diffusion Weighted and Dynamic Contrast-Enhanced MR Imaging1Radiology, The First Affiliated Hospital of Nanjing Medical University, Nanjing, China, 2The Affiliated Hospital of Xuzhou Medical University, Xuzhou, China
Synopsis
Effective diagnosis of ankylosing spondylitis (AS) activity plays an important role for clinical treatment and prognosis. In our study, we used intravoxel incoherent motion (IVIM) and dynamic contrast-enhanced (DCE) magnetic resonance imaging (MRI) to differentiate the active and chronic stage of AS. As a result, we found that Dslow, Ktrans and Ve had a high diagnostic sensitivity and specificity.
Introduction
To evaluate the activity of ankylosing spondylitis (AS) objectively and effectively is very important for clinical treatment and prognosis1. There have been several studies to investigate the feasibility of intravoxel incoherent motion (IVIM) and dynamic contrast-enhanced (DCE) magnetic resonance imaging (MRI) for differentiating the active and chronic stage of AS2-4. However, the quantitative relationship is not clear. We compare the diagnostic value of IVIM and DCE-MRI for AS and explore correlations between these parameters.Methods
All experiments were performed at GE 3.0 T 750W with phase-array chest-body coils. Fifty patients with AS were divided into active group (n = 32) and chronic group(n = 18). The grouping criteria is based on the Bath Ankylosing Spondylitis Disease Activity Index (BASDAI) and the level of C-reactive protein (CRP) and erythrocyte sedimentation rate (ESR). All data were analyzed at a GE MR workstation (Advantage workstation 4.6; GE Medical Systems). All patients were scored according to the Spondyloarthritis Research Consortium of Canada (SPARCC). Tissue diffusivity (Dslow), perfusion fraction (f) and pseudo-diffusion coefficient (Dfast) values for IVIM, forward volume transfer constant (Ktrans), reverse transvascular transfer rate constant (Kep), extravascular extracellular space volume (Ve) and plasma volume fraction (Vp) for DCE-MRI were all obtained from two groups. The analysis of variables between groups used t test and receiver operator characteristic (ROC) curve analysis. Multivariate logistic regression analysis was used to evaluate whether there was diagnostic improvement. Significance threshold was set as P < 0.05.Results
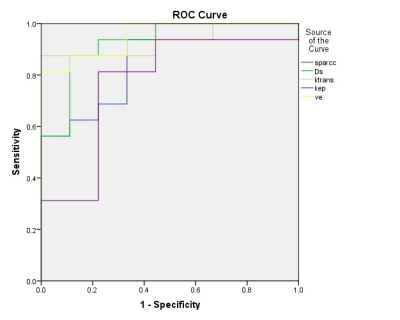
SPARCC, Dslow, Ktrans, Kep and Ve were all significantly higher in active group than these parameters in chronic group, while Dfast was significantly lower (P < 0.05, respectively). The value of f and Vp didn’t have significant difference between active and chronic groups (P > 0.05, respectively). In ROC curve analysis, area under curve (AUC) of SPARCC, Dslow, Ktrans, Kep, Ve and Dfast were 0.868, 0.924, 0.931, 0.771, 0.951 and 0.757 (Figure 1). The optimal cut-off values of SPARCC, Dslow, Ktrans, Kep, Ve and Dfast (with sensitivity, specificity, accuracy, positive predictive value, and negative predictive value) between two groups are 2 (100%, 44.4%, 64.3%, 100%, 72%), 0. 71 * 10−3 mm2/s (87.5%, 88.9%, 88.7%, 87.7%, 88.2%), 0.52 min-1 (87.5%, 100%, 100%, 88.9%, 93.8%), 0.66 min-1 (81.3%, 77.8%, 78.6%, 80.6%, 79.6%), 0.45 (81.3%, 100%, 100%, 84.2%, 90.7%) and 74.7 * 10−3 mm2/s (100%, 50%, 66.7%, 100%, 75%). In multivariate logistic regression analysis, the model of Dslow and Ktrans revealed an AUC of 0.993 ± 0.011, which showed the largest diagnostic improvement.Discussion
Our study indicates that SPARCC, IVIM and DCE-MRI showed differences between patients in active stage and chronic stage of AS. During the active stage, inflammatory cells, angioedema and destruction of microvascular structures lead to increased perfusion and impeded diffusion of water molecules. The optimal cut-off values of Dslow, Ktrans and Ve demonstrated both high diagnostic sensitivity (87.5%, 87.5%, 81.3%) and specificity (88.9%, 100%, 100%). In multivariate logistic regression analysis, we modeled these three parameters in different combinations to explore the improvement of diagnostic effectiveness. The AUC in the model of Dslow and Ktrans showed the largest increase than the other combinations suggesting a higher diagnostic sensitivity and specificity.In our study, laboratory examinations only used for grouping, but not analyzed with parameters. Further study should be performed to explore the diagnostic value when we conduct multivariate logistic regression analysis with the models of laboratory examinations and MRI parameters.
Conclusion
Quantitative IVIM and DCE-MRI parameters play an important role in differentiating active and chronic AS, especially Dslow, Ktrans and Ve. When Dslow is combined wuth Ktrans, it had the highest diagnostic sensitivity and specificity.Acknowledgements
No acknowledgement found.References
1. Sun H, Liu K, Liu H, et al. Comparison of bi-exponential and mono-exponential models of diffusion-weighted imaging for detecting active sacroiliitis in ankylosing spondylitis. Acta Radiol. 59(4). England,2018. 468-477.
2. Zhao Y, Zhang Q, Li W, et al. Assessment of Correlation between Intravoxel Incoherent Motion Diffusion Weighted MR Imaging and Dynamic Contrast-Enhanced MR Imaging of Sacroiliitis with Ankylosing Spondylitis. Biomed Res Int. 2017United States,2017. 8135863.
3. Zhao YH, Li SL, Liu ZY, et al. Detection of Active Sacroiliitis with Ankylosing Spondylitis through Intravoxel Incoherent Motion Diffusion-Weighted MR Imaging. Eur Radiol. 25(9). Germany,2015. 2754-63.
4. Zhang M, Zhou L, Huang N, et al. Assessment of active and inactive sacroiliitis in patients with ankylosing spondylitis using quantitative dynamic contrast-enhanced MRI. J Magn Reson Imaging. 46(1). United States,2017. 71-78.
