2784
Comparative analysis of the diagnostic values of T2 mapping and DWI for sacroiliitis in ankylosing spondylitis1The First Affiliated Hospital of Xinxiang Medical University, Weihui, China, 2GE Healthcare, MR Research China, Weihui, China
Synopsis
In this study, we compared and analyzed the active, inactive, and healthy control groups using T2 mapping and assessed the activity of AS using the changes in T2 values. The purposes of this study are to use T2 mapping to assess AS activity, to compare the quantitative assessment values of T2 mapping and DWI for subchondral bone marrow edema of the sacroiliac joint, and to provide potential imaging technical support for the clinical diagnosis of AS and efficacy evaluations of AS treatments.
Introduction
Ankylosing spondylitis (AS) is a seronegative spondyloarthropathy that occurs frequently in male adolescents and mainly affects the sacroiliac joint and the spinal joints.Sacroiliitis is considered one of the main diagnostic criteria for AS and is also the most important factor in AS staging.Therefore, a noninvasive method to assess early AS is very important.This study was aim to investigate the diagnostic values of T2 mapping and diffusion-weighted imaging (DWI) for active sacroiliitis in ankylosing spondylitis (AS).Methods
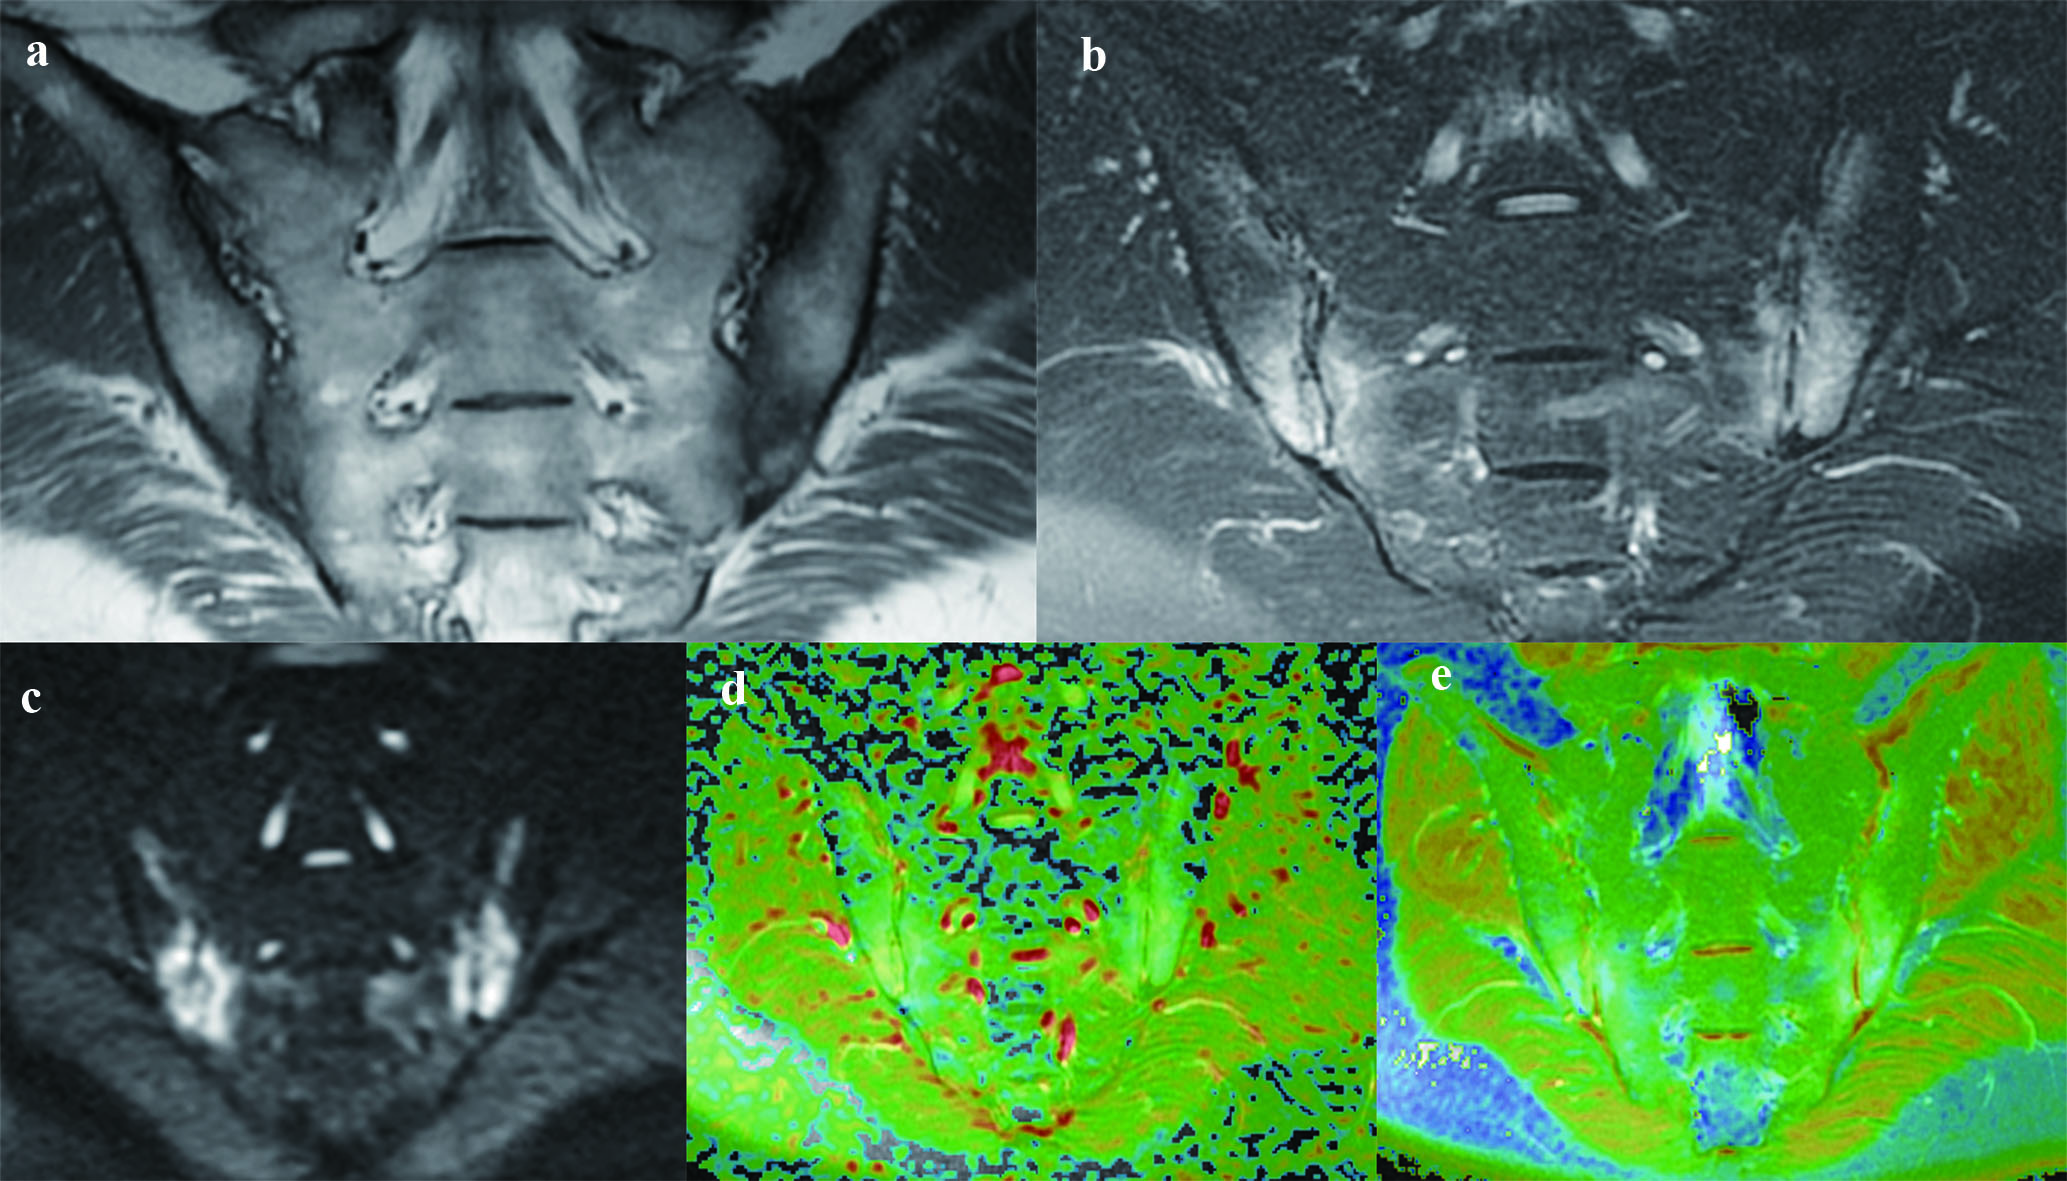
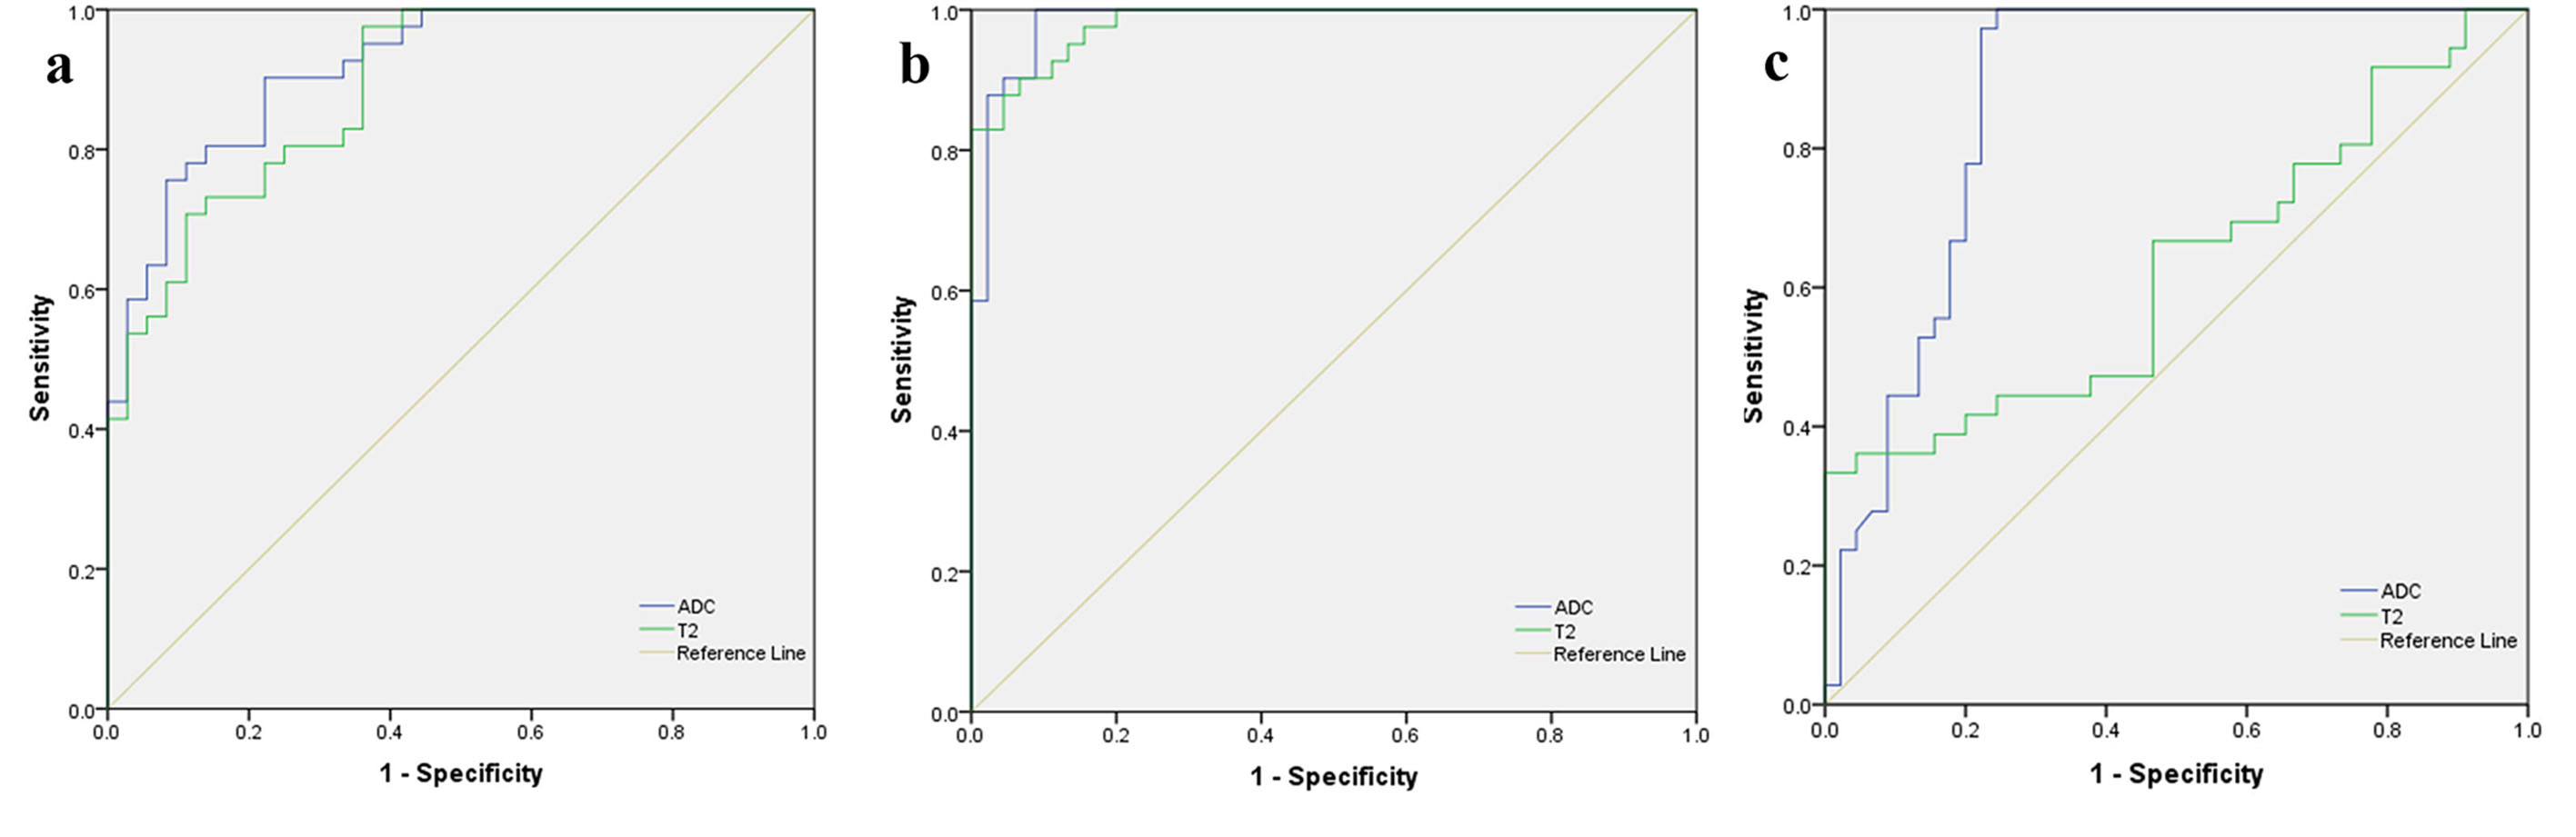
A total of 77 AS patients with sacroiliitis and 45 healthy controls were enrolled. All patients were scanned by standard magnetic resonance imaging longitudinal relaxation time (T1)-weighted imaging (T1WI), fat-saturated T2-weighted imaging (FS-T2WI)] and DWI, and T2 mapping of the bilateral sacroiliac joints. According to whether subchondral bone marrow edema was present in the FS-T2WI sequence, the 77 patients were divided into an active group (41 cases) and an inactive group (36 cases). The T2 and apparent diffusion coefficient (ADC) values of the subchondral bone marrow were measured in the active group, the inactive group and the healthy control group. The average T2 and ADC values were compared among the three groups. Receiver operating characteristic (ROC) curves were used to analyze the diagnostic efficacy of T2 and ADC values for sacroiliitis. The correlations of T2 and ADC values with the Bath Ankylosing Spondylitis Disease Activity Index (BASDAI) score and the Spondyloarthritis Research Consortium of Canada (SPARCC) score were analyzed.Results
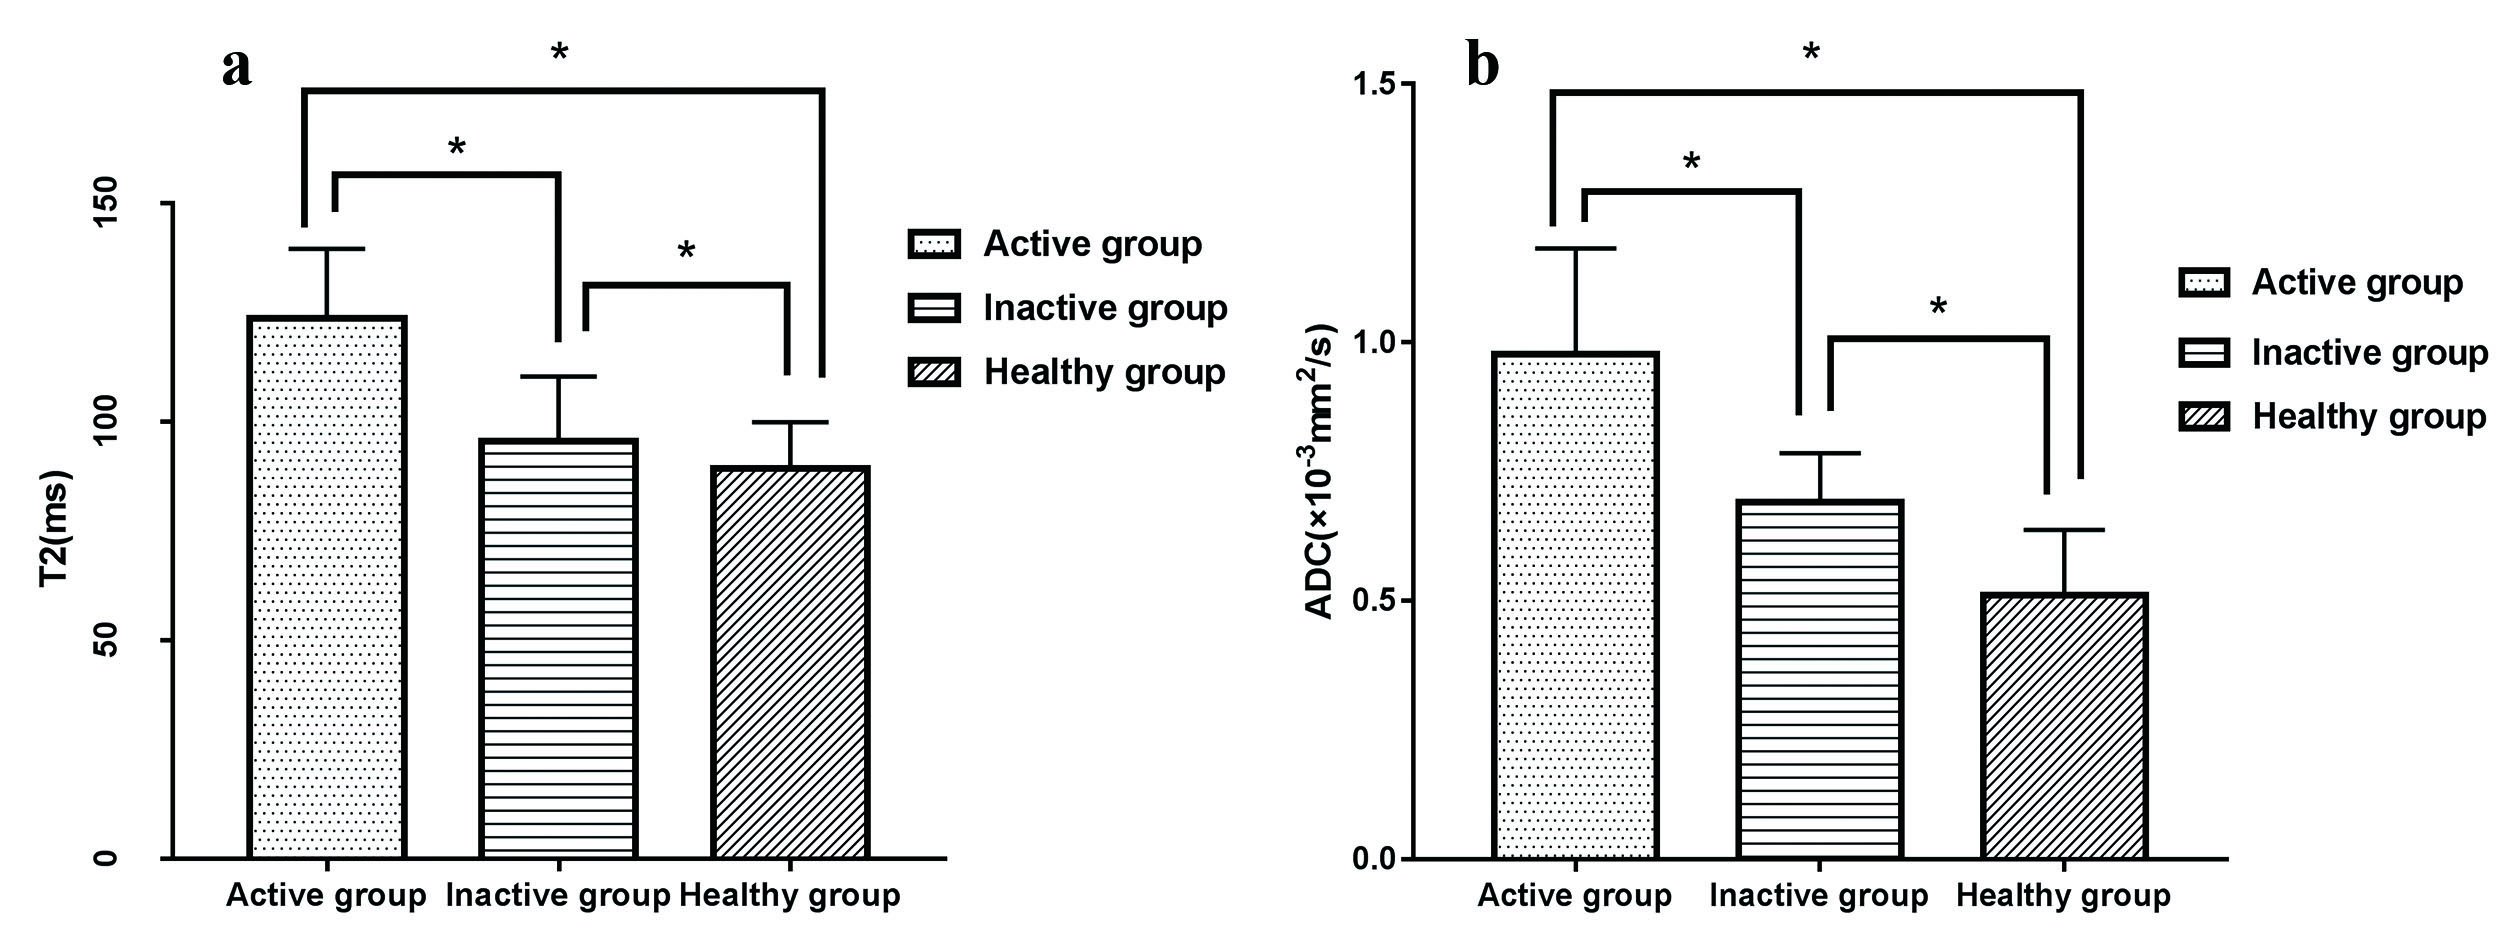
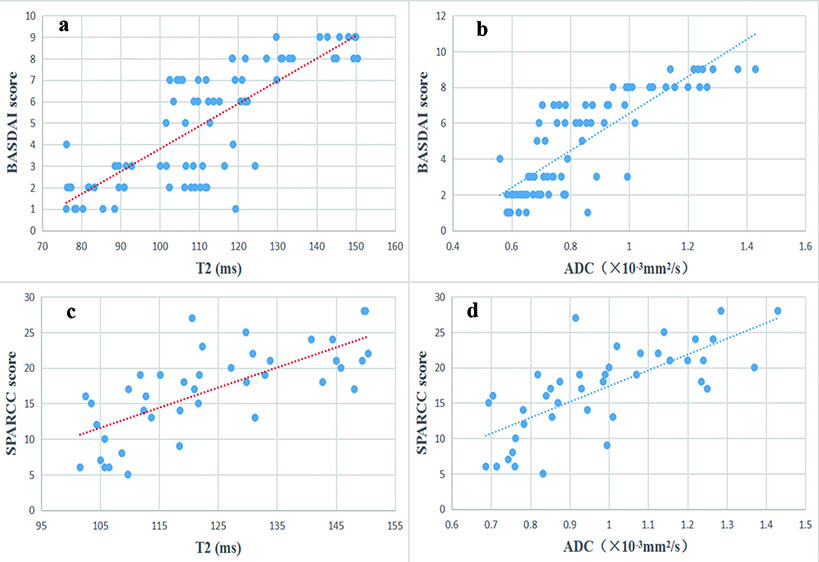
The T2 and ADC values in the active group were higher than those in the inactive group and the healthy control group. The T2 and ADC values in the inactive group were significantly higher than those in the healthy control group (P < 0.05). The T2 and ADC values of the AS patients were positively correlated with BASDAI scores, and the correlation coefficients (r) were 0.786 (P < 0.05) and 0.842 (P < 0.05), respectively. The T2 and ADC values of the AS patients in the active group were positively correlated with SPARCC scores, and the correlation coefficients (r) were 0.757 (P < 0.05) and 0.764 (P < 0.05), respectively.Discussion
The T2 mapping sequence can detect changes in water molecules, the collagen content, and tissue anisotropy and is a sensitive parameter for the evaluation of early articular cartilage degeneration. Studies have shown that subchondral bone marrow edema is associated with cartilage damage at the corresponding site [1]. This study showed that the T2 and ADC values had strong positive correlations with the imaging scores (SPARCC score) and clinical scores (BASDAI) of AS patients, which is consistent with the results of previous studies [2,3].Therefore, T2 mapping and DWI can be used as indicators to assess AS activity,which will benefit AS patients.Conclusion
T2 and ADC values can be used to quantitatively assess the degree of inflammation in AS, and the efficacy of the ADC value in the diagnosis of AS was higher than that of the T2 value.Acknowledgements
This study was supported by the Henan Medical Science and Technology Research Program [grant numbers 2018020357 and 2018020367].References
1.Gong JS, Pedoia V, Facchetti L et al. Bone marrow edema-like lesions (BMELs) are associated with higher T1ρand T2 values of cartilage in anterior cruciate ligament (ACL)-reconstructed knees: a longitudinal study. Quant Imaging Med Surg 2016;6(6): 661-670.
2. Zhang P, Yu K, Guo R et al. Ankylosing spondylitis: correlations between clinical and MRI indices of sacroiliitis activity. Clin Radiol 2015;70(1):62-66.
3.Zhang MC, Zhou L, Huang N et al. Assessment of active and inactive sacroiliitis in patients with ankylosing spondylitis using quantitative dynamic contrast-enhanced MRI. J Magn Reson Imaging 2017;46:71-78.
Figures