2781
Evaluation of Gadolinium Deposition in Cortical Bone Using 3D-UTE-QSM in vitro: Preliminary Study1Department of Radiology, Third Affiliated Hospital of Southern Medical University, Guangzhou, China, 2Department of Radiology,University of California San Diego, San Diego, CA, United States, 3School of Biomedical Engineering, Southern Medical University, Guangzhou, China
Synopsis
After injection of gadolinium-based contrast agents (GBCAs) for enhanced magnetic resonance imaging (MRI), levels of gadolinium (Gd) in the brain are much lower than that measured in bone. The 3D ultrashort echo time Cones Quantitative susceptibility mapping (3D UTE-Cones-QSM) technique has been used to assess calcium in cortical bone. In this study, we investigated the feasibility of evaluating gadolinium deposition in cortical bone in vitro using 3D UTE-Cones-QSM on a 3T clinical scanner. Higher QSM values were observed with higher Gd concentrations, indicating that 3D UTE-Cones-QSM could be a new, non-invasive technique for evaluation of Gd deposition in bone.
Introduction
Every year, millions of people around the world are injected with GBCAs in order to enhance tissue contrast during MRI scans (1). Recently, bone has been shown to be a major storage site for gadolinium (Gd), with up to 23 times higher concentrations than those found in the brain following Gd administration (2). Therefore, an non-invasive technique to measure Gd levels in bone would be a useful tool for monitoring gadolinium deposition. However, such a non-invasive technique for assessing Gd deposition is still lacking. In this work, we aimed to investigate the feasibility of assessing Gd deposition in bovine cortical bone samples soaked with different concentrations of Gd solution using a novel 3D ultrashort echo time Cones quantitative susceptibility mapping (3D UTE-Cones-QSM) technique.Methods
Forty tibial bovine cortical bone specimens harvested from freshly frozen bovine tibial midshafts were cut to 20 mm in length roughly at the midpoint of the tibial shaft using a Delta ShopMaster band saw (Delta Machinery, Tennessee, USA)[3]. Sectioned bone samples were divided into five groups, with eight samples per group, and were soaked in phosphate-buffered saline (PBS) solutions of five different Gd concentrations (Gadobutrol, Bayer Pharma AG, German): 0, 0.4, 0.8, 1.2, and 1.6mmol/L for 48h. All bone samples were then embedded in 1% weight/volume agarose gel in two cylindrical plastic container (10 cm in diameter, 20 samples in one container).3D UTE-Cones data were acquired on a 3T clinical MR system (MR 750, GE Healthcare, Waukesha, WI, USA) using a single channel transmit/receive wrist coil (Mayo Clinic, Rochester, MN, USA) with the following imaging parameters: flip angle=15°; TR=15ms; TE=0.032, 0.2, 0.4, 0.8, 1.2, and 2.2 ms; readout bandwidth=125 kHz, FOV=60x60x50mm3; acquisition matrix=160x160x100; total scan time=54min (9min per scan). All MR images were reconstructed using offline reconstruction code implemented in Matlab 2017b (MathWorks, Natick, MA, USA) based on Nonlinear Fast Fourier Transform (NuFFT) algorithm (4), where both magnitude and phase images were generated for each TE. A total field map was obtained using 3D region growing based phase unwrapping (5). Background field was removed using projection onto dipole field (PDF) algorithm (6, which yielded a local field map. Then, morphology enabled dipole inversion (MEDI) algorithm (7) was applied to obtain the susceptibility values. The regularization parameter was set to 5000 for MEDI algorithm (8). The average QSM was calculated by drawing regions of interest (ROIs) in the middle of each specimen, with three ROIs per specimen. The correlation between QSM and Gd concentration was investigated.
Results
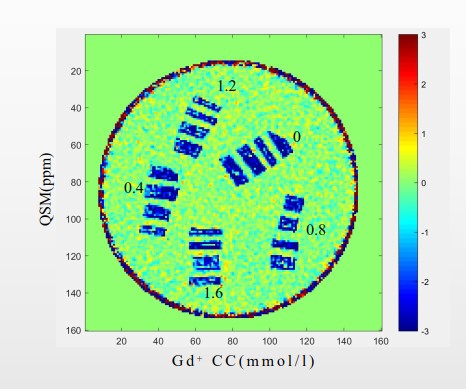
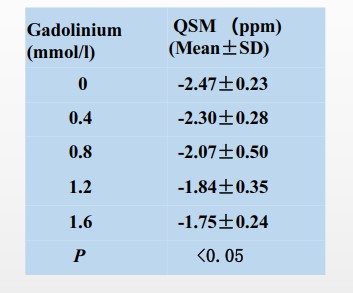
Figure 1 shows a representative QSM map from 3D UTE-Cones-QSM imaging of 20 bovine bone samples soaked in PBS with different Gd concentrations for 48h. Bone samples soaked in PBS with higher Gd concentrations exhibited less negative QSM values.Table 1 summarizes the QSM values of all bone specimens. A negative mean QSM value of -2.47 ± 0.23 ppm was observed for bovine bone soaked in regular PBS, while the mean QSM value increased up to -1.75 ± 0.24 ppm for bone soaked in PBS with the highest Gd concentration of 1.6 mmol/L.
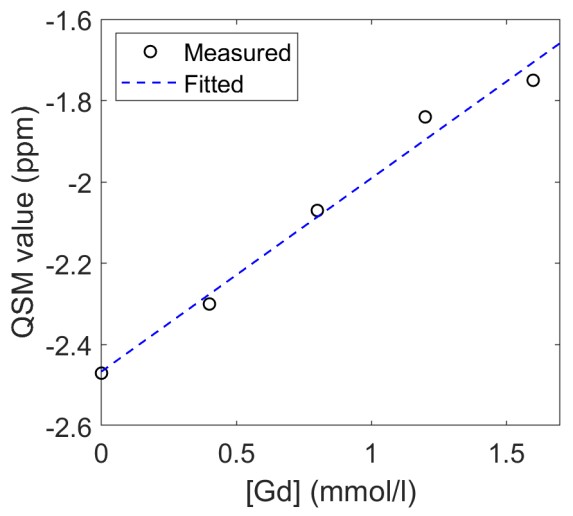
Figure 2 shows linear regression analysis of the average QSM value vs. Gd concentration, and demonstrates a significantly linear correlation with a line equation: QSM = 0.48 [Gd] - 2.47 (ppm) (R2 = 0.9839).
Discussion and Conclusion
Our data show higher QSM values for bovine cortical bone soaked in PBS with higher concentrations of Gd. The results also show a significant linear correlation between gadolinium in cortical bone and GBCA concentration. These preliminary results demonstrate that 3D UTE-Cones-QSM may be a novel non-invasive technology with great potential for assessing gadolinium deposition in cortical bone.Acknowledgements
The authors acknowledge grant support from NIH (1R21AR073496, R01AR068987) and National Natural Science Foundation of China (81801653).References
1. Murata N, Gonzalez-Cuyar LF, Murata K, Fligner C, Dills R, Hippe D, Maravilla KR. Macrocyclic and Other Non-Group 1 Gadolinium Contrast Agents Deposit Low Levels of Gadolinium in Brain and Bone Tissue: Preliminary Results From 9 Patients With Normal Renal Function. Investigative radiology 2016;51(7):447-453.
2. Lord ML, Chettle DR, Grafe JL, Noseworthy MD, McNeill FE. Observed Deposition of Gadolinium in Bone Using a New Noninvasive in Vivo Biomedical Device: Results of a Small Pilot Feasibility Study. Radiology 2018;287(1):96-103.
3. Jerban S, Lu X, Jang H, Ma Y, Namiranian B, Le N, Li Y, Chang EY, Du J.Significant correlations between human cortical bone mineral density and quantitative susceptibility mapping (QSM) obtained with 3D Cones ultrashort echo time magnetic resonance imaging (UTE-MRI). Magnetic Resonance Imaging 62 (2019) 104–110.
4. Fessler JA. On NUFFT-based gridding for non-Cartesian MRI. J. Magn. Reson. 2007;188:191–1955. Cusack R, Papadakis N. New robust 3-D phase unwrapping algorithms: Application to magnetic field mapping and undistorting echoplanar images. Neuroimage 2002;16:754–764.
5. Cusack R, Papadakis N. New robust 3-D phase unwrapping algorithms: Application to magnetic field mapping and undistorting echoplanar images. Neuroimage 2002;16:754–764.
6. Liu T, Khalidov I, de Rochefort L, Spincemaille P, Liu J, Tsiouris AJ, Wang Y. A novel background field removal method for MRI using projection onto dipole fields (PDF). NMR Biomed. 2011;24:1129–1136.
7. Liu J, Liu T, De Rochefort L, et al. Morphology enabled dipole inversion for quantitative susceptibility mapping using structural consistency between the magnitude image and the susceptibility map. Neuroimage 2012;59:2560–25688.
8.Lu X, Jang H, Ma Y, Jerban S, Chang EY, Du J.Ultrashort Echo Time Quantitative Susceptibility Mapping (UTE-QSM) of Highly Concentrated Magnetic Nanoparticles: A Comparison Study about Different Sampling Strategies.Molecules. 2019 Mar 22;24(6).
Figures