2780
3T MRI Textural Analysis of the Proximal Femur in Subjects with Compared to Those without Prior Fragility Fractures1Radiology, NYU Langone Health, New York, NY, United States, 2Osteoporosis Center, NYU Langone Health, New York, NY, United States
Synopsis
In recent years, there is greater emphasis on detecting microstructural information in bones that may lead to improved diagnosis of osteoporosis in patients. Radiomics provides a tool to quantify the textural information of medical images and may serve as a marker of bone microstructure. We aim to analyze if the distribution of the textural features computed in the proximal femur is significantly in subjects with previous fragility fractures compared to those without fracture.
Purpose
In recent years, there is greater emphasis on detecting microstructural information in bones that may lead to improved diagnosis of osteoporosis in patients. Several direct and indirect tools such as bone mineral density (BMD), FRAX score2 and finite element analysis of bone mechanical properties1 have been used to understand bone health. Radiomics3 provides a tool to quantify the textural information of medical images and may serve as a marker of bone microstructure. Textural analysis in medical images have been applied in the setting of osteoporosis in CT lumbar spine5, understanding tumour phenotypes4, and analyzing the vertebral bone marrow6. To understand the microstructure of the proximal femur (PF) we aimed to analyze if the distribution of the textural features computed in the PF is significantly in subjects with previous fragility fractures compared to those without fracture.
Methodology
This study had institutional review board approval, and we obtained written informed consent from all subjects.Subjects: We recruited n =59 female patients with osteoporosis diagnosis based on T-score threshold ( spine or total hip T-score < - 2.5 SD) divided into two groups based on prior fragility fracture history (with fracture n=20 (Fx), age = 57±10, BMI = 21.7 ±2.5 and without fracture n=39 (nFx), age = 61±6, BMI= 21.3±3.3).
Acquisition: On a 3T MRI scanner, we acquired resolution images of bone microarchitecture of the non-dominant proximal femur in a slightly oblique coronal plane parallel to the femoral neck by using a three-dimensional FLASH sequence with following parameters: TR/TE, 37/4.92 ms; Flip angle: 25°; matrix acquisition size: 512 x 512; field of view :120 mm; in-plane voxel resolution of 0.24x0.24 mm with 60 coronal slice of 1.5 mm thickness. Acquisition time was approximately 15 minutes.
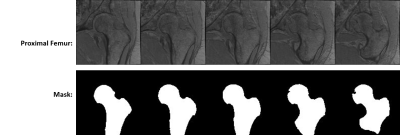
Evaluation: The proximal Femur region was manually segmented from high-resolution 3T MRI images using the software toolbox Firevoxel as shown in figure 1. The textural features were calculated over the segmented Proximal Femur regions of the MRI using a python toolbox pyradiomics7 2.2.0. The first-order textural features (Mean, contrast, variance, median, skewness etc.), Gray Level Co-occurrence Matrix (GLCM) features, Gray level Run length Matrix (GLRLM) features, Gray Level Dependence Matrix (GLDM) features, Gray Level Size Zone Matrix (GLSZM) features and Neighboring Gray Tone Difference Matrix (NGTDM) features are used in this experiment. A comparison was made between Fx and nFx subjects on the textural features and clinical features (age and BMI) using Mann Whitney U test and area under the curve for Receiver Operator Curve (AUC). Spearman rank correlation was performed between all the features to understand the inter-feature relationship.
Result
Table 1 provides the mean values and standard deviations for each parameter within each group. It also shows the results of univariate ROC Analyses. In fracture subjects compared to controls, there was 5.7% lower cluster prominence (GLCM feature), 5.1 % higher normalized size zone non-uniformity (GLSZM feature), 2.8 % higher small area emphasis (GLSZM feature) and 187 % higher Busyness (p-value < 0.05). There were no significant differences in first-order parameters between groups. In ROC analyses, the parameters of normalized size zone non-uniformity (GLSZM feature) and higher small area emphasis (GLSZM feature) were able to discriminate between groups (p-value < 0.05). Table 2 shows the correlation between textural parameters and clinical measures. There was no significant correlation between parameters.Conclusion
The distribution of textural features like cluster prominence, Normalized Size Zone Non-uniformity, Small Area Emphasis and Busyness demonstrated a significant difference in and could discriminate between Fx and nFx subjects. The lack of a correlation between textural parameters and clinical parameters suggests that these textural parameters provide information that is different from clinical parameters. Further evaluation in larger patient studies is needed.Acknowledgements
No acknowledgement found.References
[1] Chang, Gregory et al. (2014). Radiology. 272. 131926. 10.1148/radiol.14131926.
[2] Kanis, J. A. et al. (2008).Osteoporosis international, 19(4), 385–397. doi:10.1007/s00198-007-0543-5
[3] Rizzo, S. et al (2018). European radiology experimental, 2(1), 36. doi:10.1186/s41747-018-0068
[4] Zhao, B. et al. (2016). Scientific reports, 6, p.23428.
[5] Jeong, H. et al. (2013).The British journal of radiology, 86(1021), 20101115. doi:10.1259/bjr.20101115
[6] Burian et al (2019). Osteoporosis international: a journal established as a result of cooperation between the European Foundation for Osteoporosis and the National Osteoporosis Foundation of the USA, 30(6), 1265–1274. doi:10.1007/s00198-019-04924-9
[7] van Griethuysen, J. J. M. et al. (2017). Cancer Research, 77(21), e104–e107.
Figures


