2776
Quantitative MRI Study of Diabetic Bone Marrow Microvascular Disease1Hospital of Stomatology Wuhan University, Wuhan, China, 2MR Research, GE Healthcare, Beijing, China, 3Renmin Hospital of Wuhan University, Wuhan, China
Synopsis
We quantitatively evaluate the microvascular permeability of lumbar marrow changes in alloxan-induced diabetic rabbits using dynamic contrast enhanced magnetic resonance imaging (DCE-MRI) . And to investigate whether texture analysis based on permeability parameter Ktrans map of DCE-MRI can be used to assess the fine alterations of lumbar marrow structures in early-stage diabetic rabbits.
Our results confirm that texture analysis parameters based on DCE-MRI quantitative parameter Ktrans map are feasible to identify the early-stage fine changes of lumbar marrow structure in diabetic rabbits.
Introduction
Previous studies have shown that patients with diabetes are more susceptible to degenerative lumbar disease[1] and have increased risk of fractures and morphometric deformities[2,3].Numerous studies have demonstrated that vertebral body and accessory lesions, including osteoporosis[4], compression fractures of lumbar vertebrae[5],closely related to the permeability of bone marrow. Although the underlying mechanisms are not the same in these conditions, vascular permeability alterations have been observed in all cases. Thus, it is of great importance to detect and even predict early abnormal changes in the vertebrae and adnexa of diabetic patients, monitor the progress of these changes, and evaluate curative effects of treatment. Based on the results of our previous study[6] , it has been confirmed that the perfusion parameters obtained by DCE-MRI can reflect the alterations of bone marrow permeability in early stage of diabetes. Nowadays, texture analysis of medical images such as MR images has already demonstrated great potential in disease diagnosis, lesion detection and characterization, and even in monitoring disease progression and longitudinal evaluation of emerging therapies. However, there are no reports on the diabetic bone marrow texture analysis based on bone permeability maps. The combination of texture analysis and bone permeability maps might offer help in the early detection of diabetes induced abnormal bone alterations.Thus, the purpose of this study was as follows: to quantitatively evaluate the microvascular permeability of lumbar marrow changes in alloxan-induced diabetic rabbits using DCE-MRI. And to investigate whether texture analysis based on permeability parameter Ktrans map of DCE-MRI can be used to assess the fine alterations of lumbar marrow structures in early-stage diabetic rabbits.meterial and methods
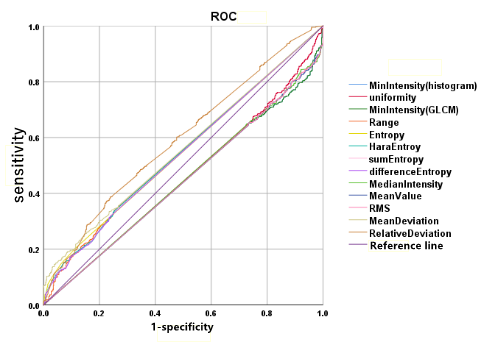
Twenty-four rabbits weighing about 3.0 kg were randomly assigned to the diabetic (n=14) or control (n=10) group. All rabbits underwent sagittal MR imaging of the lumbar regions at fixed time points (0, 4, 8, 12, and 16 weeks after alloxan injection).Repeated measurement ANOVA was used to analyze the changes of lumbar bone marrow Permeability parameter over time in each group . Two-sample t-tests were used to compare the differences of lumbar bone trabecular morphometric parameters and texture parameters between the two groups.Statistically significant texture parameters are subjected to ROC curve analysis in diabetes group after comparing with control group, from which the area under the curve (AUC) was calculated.results and discussion
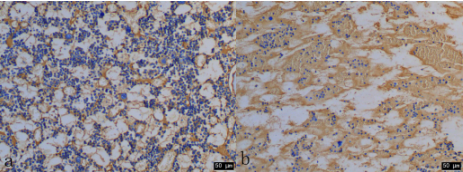
At 16 weeks, there was no statistically significant difference in the parameters of lumbar bone marrow permeability between the diabetic group and the control group.Histogram parameter Range, gray level co-occurrence matrix parameter Entropy, HaraEntroy, sum Entropy and difference Entropy decreased in the 8th week and increased in the 12th and 16th weeks of diabetic group. Mean Deviation and Relative Deviation of histogram parameters were higher in 12th and 16th weeks than those in control group. The area under ROC curve of range, entropy, HaraEntropy, total Entropy, difference Entropy, average deviation and relative deviation are 0.575, 0.576, 0.572, 0.572, 0.586 and 0.620, respectively.The gradation histogram can reflect the distribution of pixel grayscale in the image, which is a first-order statistical method, which can extract the overall feature.Deviation is used to measure the degree of precision, and the precision is the repeatability between repeated measurements. The better the repeatability is, the higher the precision is and the smaller the deviation is. The area under the ROC curve of the relative deviation of histogram parameters in this study is the largest of all texture parameters, indicating that the relative bias is more effective in identifying early microstructural changes in diabetic bone marrow.The gray level co-occurrence matrix (GLCM) reflects the comprehensive information of the image gradation with respect to direction, adjacent interval and variation amplitude, is a second-order statistical method. The larger the entropy value is, the more complex the image texture is. This study found that the GLCM entropy value of the diabetic group was higher than that of the control group, indicating that the texture distribution was more complicated.Although the microscopic scales reflected by texture analysis and histopathology are different, there is a certain relationship between them. In the results of this study, CD34 immunohistochemical pathology showed that the number of bone marrow cells in the lumbar vertebra of the diabetic group was significantly higher than that of the control group, and the distribution range was increased, which could lead to an increase in the local variation of the image texture and an increase in complexity, consistent with the conclusion that the entropy value was increased.
Conclusions
Texture analysis parameters based on DCE-MRI quantitative parameter Ktrans map are feasible to identify the early-stage fine changes of lumbar marrow structure in diabetic rabbits.Acknowledgements
References
[1] Kim W H, Sim W S, Shin B S, et al. Effects of two different doses of epidural steroid on blood glucose levels and pain control in patients with diabetes mellitus.[J]. Pain Physician, 2013,16(6):557-568.
[2] Bonds D E, Larson J C, Schwartz A V, et al. Risk of fracture in women with type 2 diabetes: the Women's Health Initiative Observational Study[J]. J Clin Endocrinol Metab, 2006,91(9):3404-3410.
[3] Yamamoto M, Yamaguchi T, Yamauchi M, et al. Diabetic Patients Have an Increased Risk of Vertebral Fractures Independent of BMD or Diabetic Complications[J]. Journal of Bone & Mineral Research, 2009,24(4):702-709.
[4] Zhu J, Zhang L, Wu X, et al. Reduction of Longitudinal Vertebral Blood Perfusion and Its Likely Causes: A Quantitative Dynamic Contrast-enhanced MR Imaging Study of a Rat Osteoporosis Model[J]. Radiology, 2017,282(2):369.
[5] Biffar A, Sourbron S, Dietrich O, et al. Combined diffusion-weighted and dynamic contrast-enhanced imaging of patients with acute osteoporotic vertebral fractures[J]. European Journal of Radiology, 2010,76(3):298-303.
[6] Hu L, Zha Y F, Wang L, et al. Quantitative Evaluation of Vertebral Microvascular Permeability and Fat Fraction in Alloxan-induced Diabetic Rabbits[J]. Radiology, 2018,287(1):128-136.
Figures
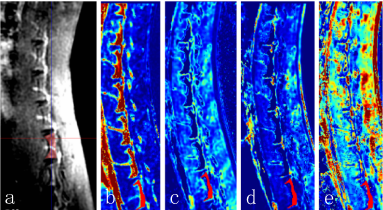
The enhanced T1WI map of the 16th week of rabbits in the control group and the Ktrans(a), Kep(b), Ve (c) and Vp(d) map obtained based on the post-processing of the image. The red area is the manually outlined lumbar vertebra ROI.