2775
Quantitative Magnetization Transfer Imaging of the Lumbar in Primary Osteoporosis at 3T MRI: a Feasibility Study
Fan Qiuju1, Tan Hui1, Yang Zhen1, Yu Nan1, Yu Yong1, Wang Shaoyu2, Xue Yu3, and Li Yue3
1Affiliated Hospital of Shaanxi University of Chinese Medicine, Shaanxi, China, 2MR senior scientific marketing specialist, Shaanxi, China, 3Shaanxi University of Chinese Medicine, Shaanxi, China
1Affiliated Hospital of Shaanxi University of Chinese Medicine, Shaanxi, China, 2MR senior scientific marketing specialist, Shaanxi, China, 3Shaanxi University of Chinese Medicine, Shaanxi, China
Synopsis
This study aimed to assess the association between the magnetization transfer ratio (MTR) value and bone mineral density (BMD) in lumbar vertebral among normal, osteopenia and osteoporosis. The MT technique was used to evaluate 26 healthy volunteers, 26 osteopenia patients and 24 osteoporosis patients. The MTR in the osteoporotic, osteopenic, and normal BMD groups were statistically significant differences. Therefore, MT technique provide quantitative information about the contribution of macromolecules., which can be used as a non-invasive quantitative monitoring MRI tool for osteoporosis progression.
Introduction:
Osteoporosis has become a global public health problem and cutting-edge research problem. Magnetization Transfer (MT) technique can provide quantitative information of macromolecules. However, the role of MT used in osteoporosis remains unclear. The aim of this study was to assess the association between the magnetization transfer ratio (MTR) value and bone mineral density (BMD) in lumbar vertebral among normal, osteopenia and osteoporosis at 3T MRI.Methods
From September 2018 until February 2019, 76 patients, who underwent QCT of the lumbar, were divided into three groups based on T-score, including 26 healthy volunteers (12 male, age= 45.9 ± 10.7 years, T-score = 0.15 ± 0.83), 26 osteopenia patients (11 males, age= 54.2 ± 10.3 years, T-score = -1.84 ± 0.29) and 24 osteoporosis patients (9 males, age= 61.0 ± 9.5 years, T-score = -3.32 ± 0.68 ) were enrolled. Data were collected on a 3T MR scanner (MAGNETOM Skyra, Siemens Healthcare, Erlangen, Germany) with an 18-channel table-mounted spine matrix coil. Besides general protocols, the sagittal flash 2D sequences were scanned for two times, one with the MT preparation ( Ms) and the other one without it ( Mo), the parameters details are: TR = 405 ms, TE = 3.69 ms, Flip Angle (FA) = 70°, Integrated Parallel Acquisition Techniques (iPAT) = 2 and spatial resolution = 1.1 × 1.1 × 3 mm, bandwidth = 250 Hz/pixel, acquisition matrix = 192 × 192, FOV = 280 mm, number of sections = 15. A total of 2:58 min to acquire both Mo and Ms data. The regions of interest (ROIs) was applied in lumbar 2 - 4 (areas 1.0 cm2 ) in sagittal Mo and Ms images. The MT effect is conventionally quantified by the MT ratio (MTR): MTR = (Mo − Ms) / Mo × 100%. One-way ANOVA were performed to evaluate the significance of the MTR between different groups.Results
The MTR in the osteoporotic, osteopenic, and normal BMD groups were (3.67 ± 2.61), (7.50 ± 4.57) and (12.71 ± 7.50), respectively, with statistically significant differences (P < 0.05). We found that there was a statistically significant positive correlation between T-scores and MTR existed ( r = 0.854, P <0.001 ).Conclusion
The MT technique has the ability to provide quantitative information about the contribution of macromolecules to MR signals. The MTR value can be used as a biomarker for the progression of osteoporosis.Acknowledgements
NoneReferences
NoneFigures
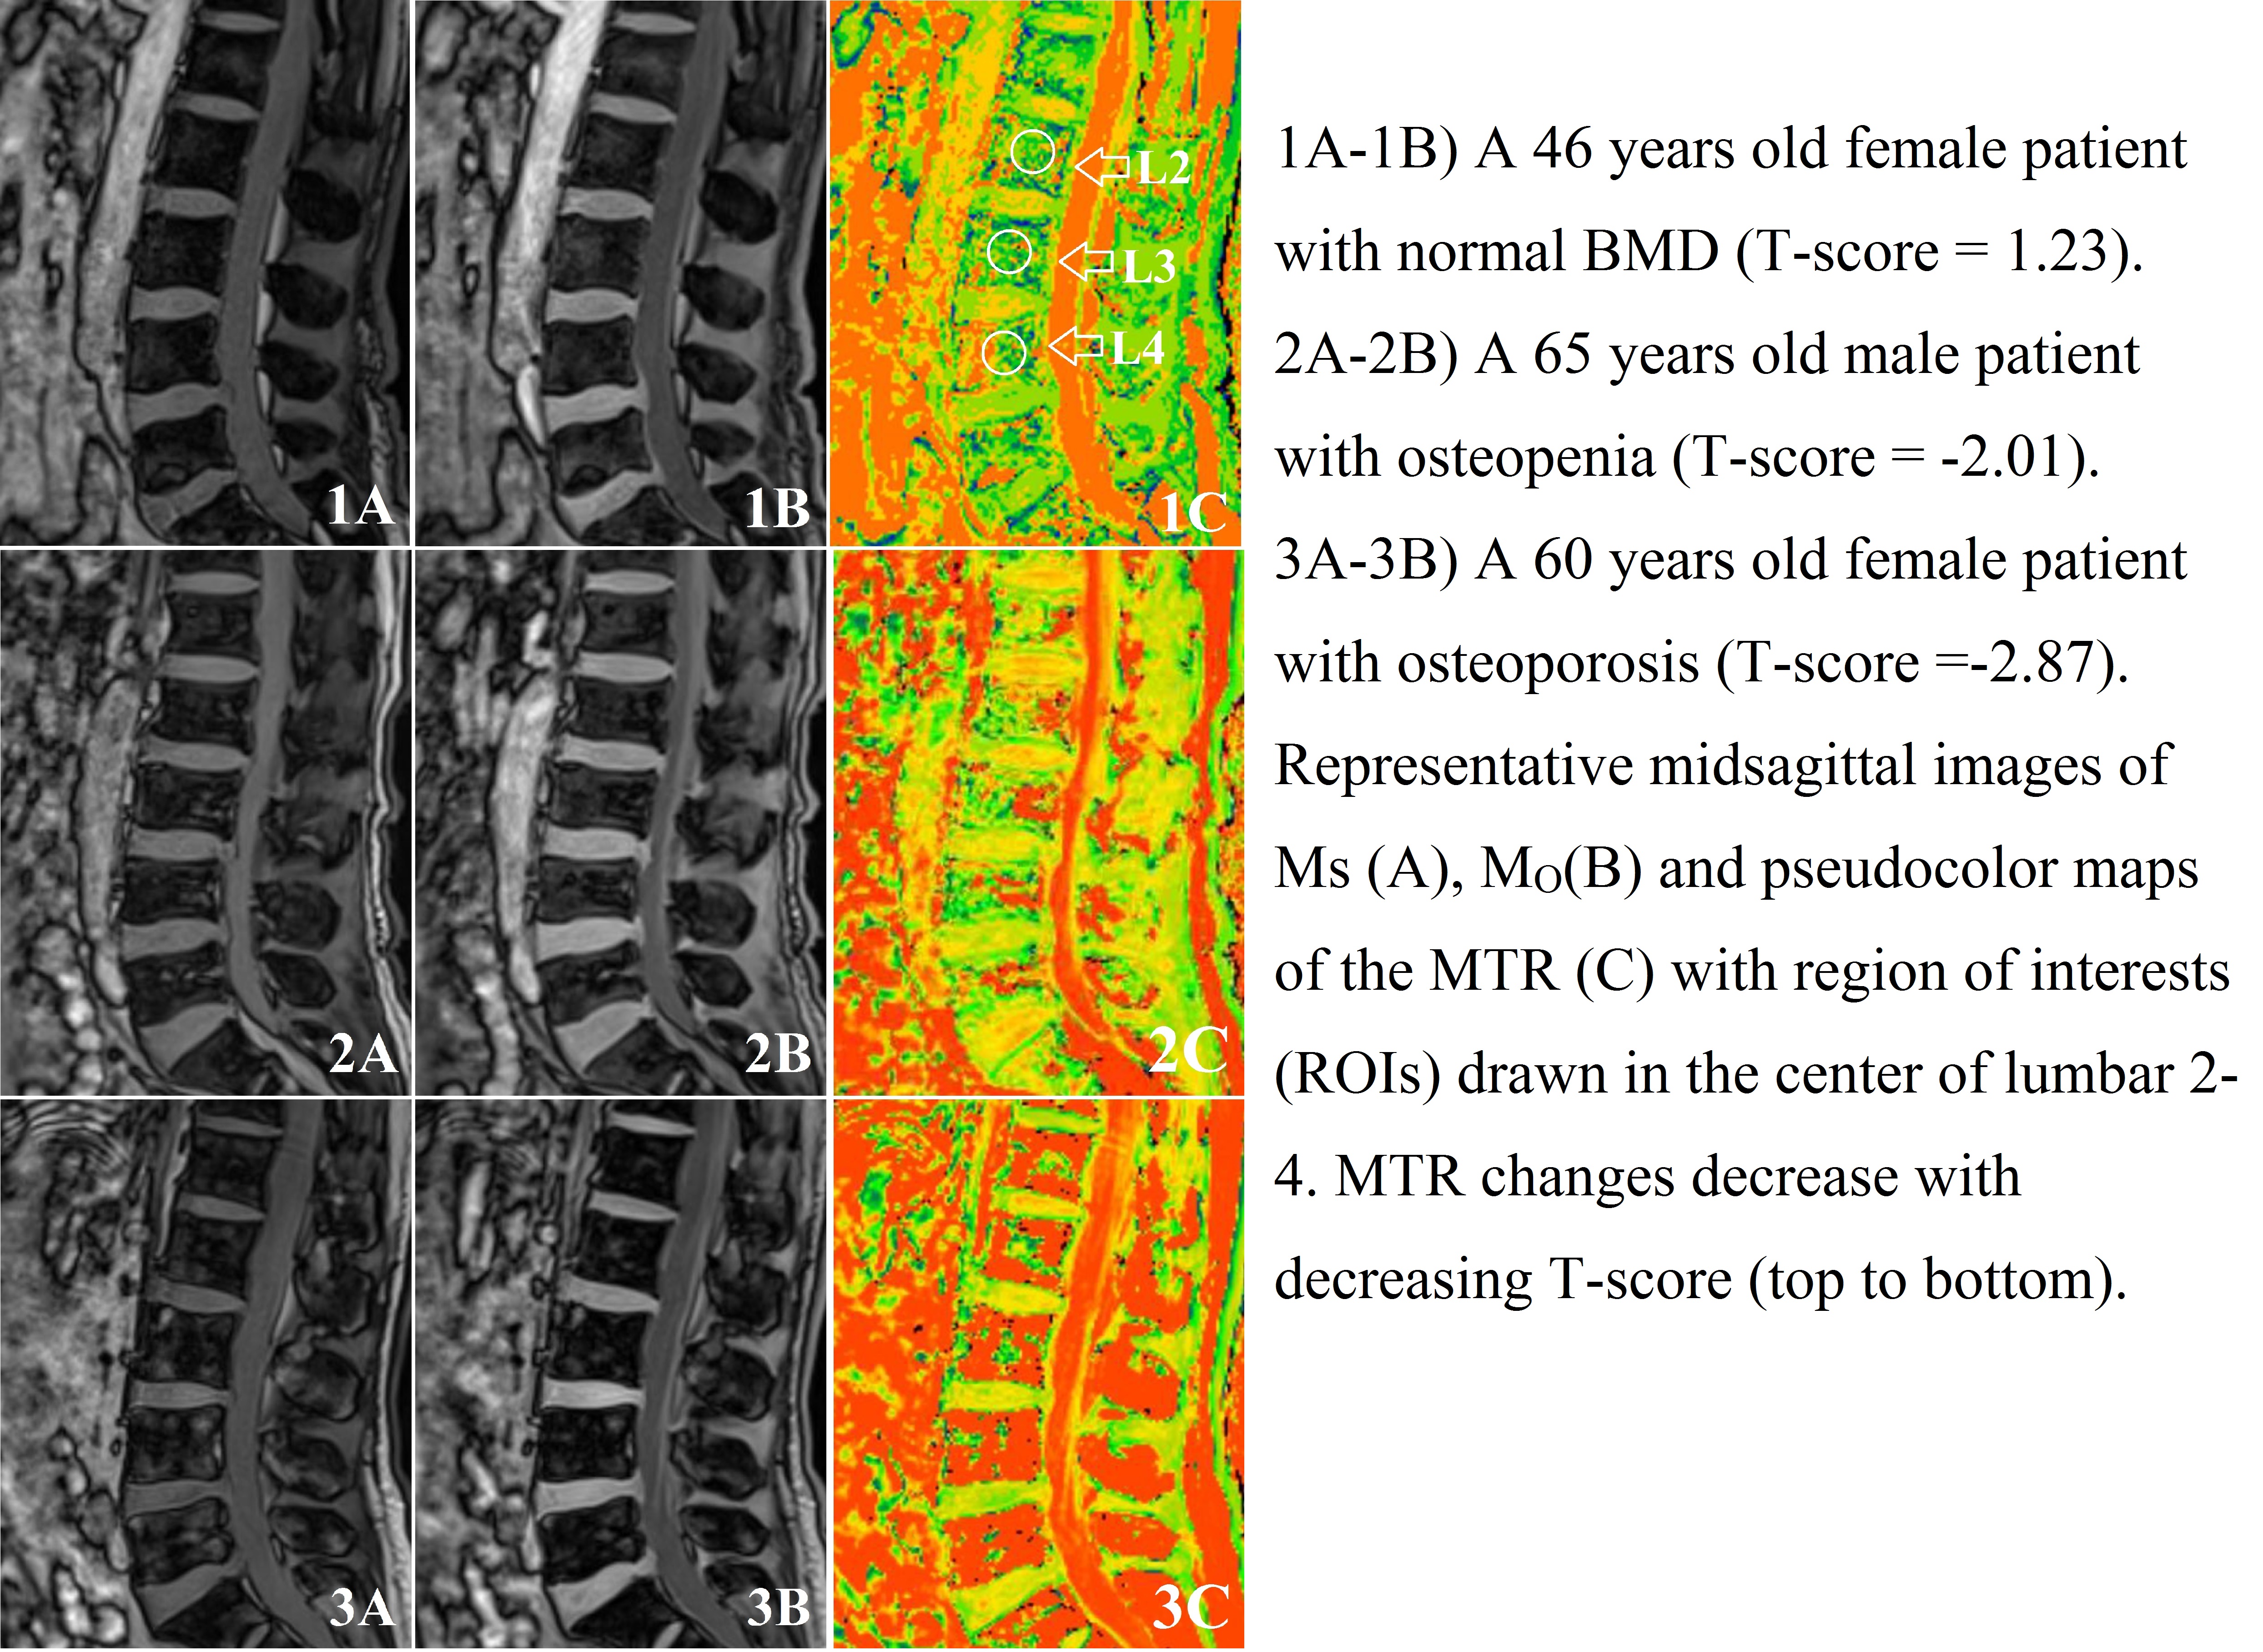
Figure.
The magnetization transfer ratio of lumbar.