2772
MRI assessment of bone microarchitecture in Human Bone samples: The issue of air bubbles artefacts1IUSTI, AixMarseille, Marseille, France, 2ISM, AixMarseille, Marseille, France, 3CRMBM, AixMarseille, Marseille, France
Synopsis
With the aim of assessing bone microarchitecture, several studies have intended to use MRI but the issue of air bubbles artefacts has been very scarcely reported. In the present study, we assessed air bubbles-related artefacts in MR images of human bone samples and intended to design a protocol to eliminate them. The method was validated using TSE MRI at 3T and high-resolution X-ray micro tomography. Morphological parameters computed from MRI recorded with and without the air bubbles artefacts were compared to those obtained from X-ray micro tomography.
Introduction
In the field of osteoporosis, dual X-ray absorptiometry (DXA) which provides a measurement of areal (two dimensional) bone mineral density (BMD) is commonly used as a diagnostic test although a suboptimal specificity has been recognized. Micro computed tomography (µCT) and magnetic resonance imaging (MRI) could also provide BMD measurements [1] and comparative analyses would be of high interest. Unlike X-ray based methods, MRI of human samples is more challenging given that air bubbles generated by the bone decomposition process or introduced during sample preparation can generate large artefacts in images which could bias trabecular bone characterization. Moreover, unfrozen samples produce substantially lower signal-to-noise ratio (SNR) compared to in-vivo imaging leading to low image contrast between bone and background. In addition, common image resolution is lower than trabecular size leading to partial volume effects (fig.1). These issues could account for the great discrepancy between MRI-derived bone microstructure parameters as previously reported [2]. Previous preparation procedures of human bone samples have been reported so far with bone marrow removal using chemical process and air bubbles removal using centrifugation [1,3,4,5]. Centrifugation of large human bone samples is not suitable, and bone marrow removal would bias mechanical tests.Method
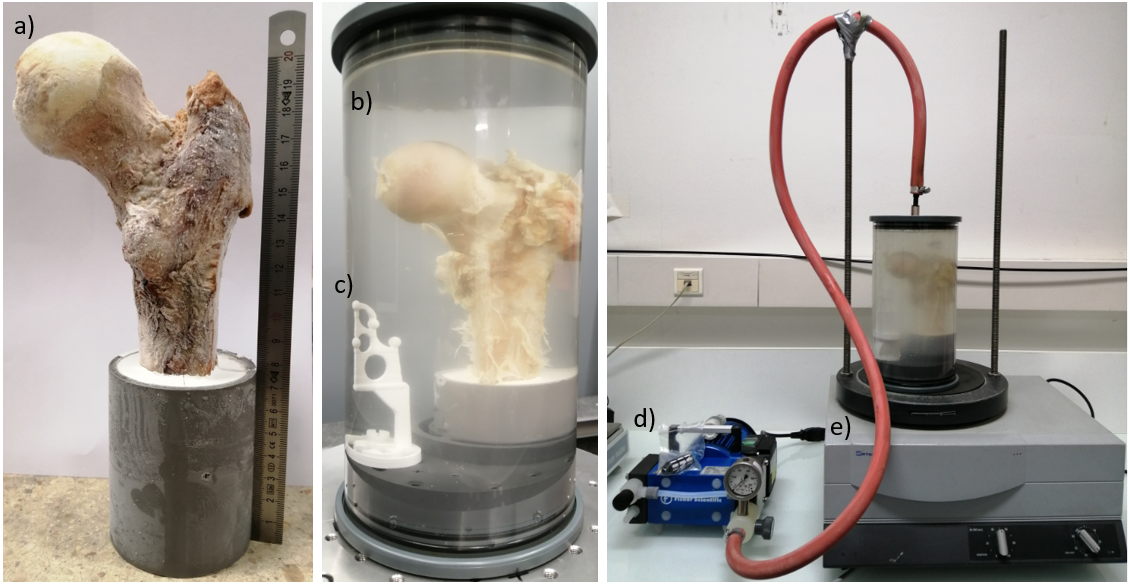
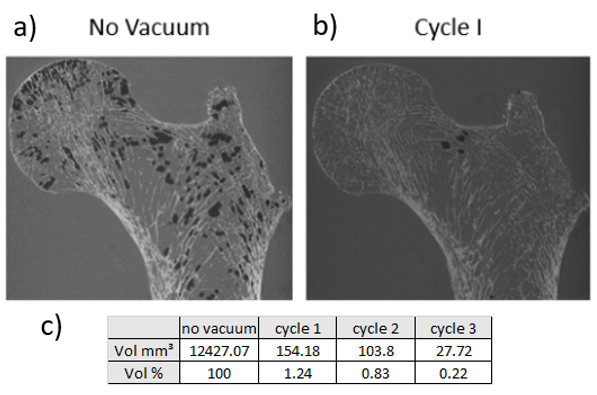
Sample preparation technique:Femur heads have been cut along the axial direction (femur length = 18±5 cm) (fig. 2a), placed in a resin support with an inclination of 15° which is the physiologic anatomic angle [6], put in an 2500ml in-house produced cylindrical plastic container and filled with 1mM Gd-DTPA saline solution. The diameter of the container was chosen so as to reproduce the real distance between the femur head and the skin surface (approximately between 5-7 cm). The container was then placed on a vibrating surface while low pressure cycles were applied for 30 minutes using a vacuum machine directly connected to it (fig. 2d, 2e). Each cycle is composed by 5 minutes of active pumping below 50 mbar and 5 minutes of relaxing time at about 150 mbar. The preparation setup is shown in figure 2. This air removal procedure was assessed using air volume measurements in 3D reconstructed µCT images acquired after each cycle (fig.3).
µCT measurements:
µCt images were acquired using EasyTom XL ULTRA 150 microtomograph which can provide a 60 µm isovolumic resolution. The air bubble removing technique was assessed on a single sample from the reconstructed 3D µCT volume after each vacuum pump cycle. The segmentation of air bubbles is straight forward because bone, bone marrow and air have very different x-ray absorption value. Results are reported in table 1.
MRI measurements:
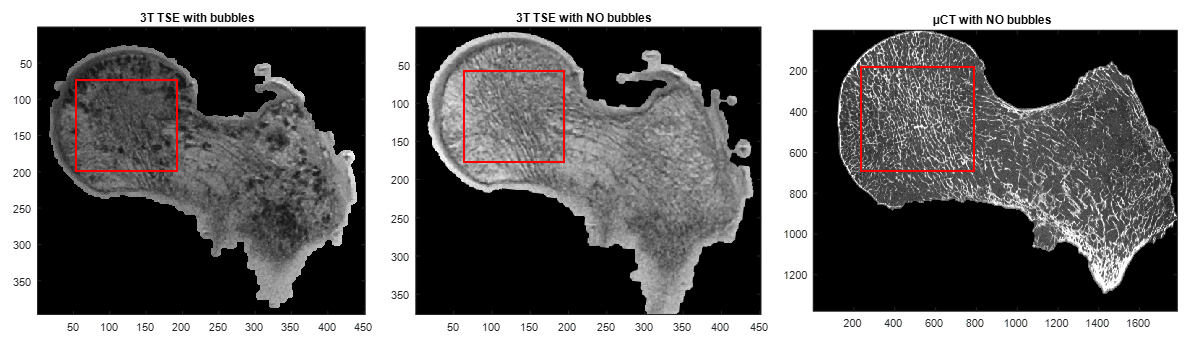
MR images were acquired at 3T (TSE) using a 16Ch Heart coil (TR/TE = 1170ms/12ms, bandwidth = 255 Hz/Px, FOV = 120°, resolution = 210x210x1100 µm, scan time = 16:55 min) before and after the air bubbles removal procedure.
Image analysis:
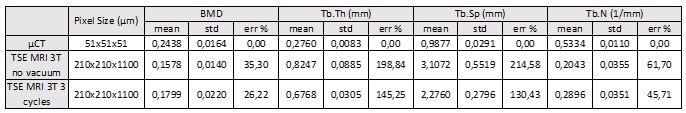
An automatic 2D registration was performed between the MRI and µCT volumes (fig. 4) in the coronal plane while CT slices resolution was reduced to the MRI resolution. A quantitative image analysis was performed by comparing classical histomorphometric parameters obtained from the µCT images at the full resolution, with those obtained by MRI before and after artefacts removing. An automatic local threshold has been applied according to [7] in order to segment the solid part on the MR images. Table 2 summarizes bone volume fraction (BVF), trabecular thickness (Tb.Th), trabecular spacing (Tb.Sp) and trabecular number (Tb.N) [8,9]. The same measurements were performed on the µCT volumes.
Results
As illustrated in figure 3, 98.7% of the air bubbles were removed thanks to the vacuum procedure. The residual bubbles were completely removed after two more cycles (fig. 3c).The bone morphological parameters are summarized in figure 5. We showed the committed errors of MRI-derived parameters considering µCT data as the ground truth. BMD calculated on the MR images recorded with bubbles was 35% higher than the corresponding µCT value. After, the vacuum procedure, the BMD value was reduced but still 26% larger. Similar results were obtained for the other histomorphometric parameters with values closer to the ground truth thanks to the vacuum procedure.
Conclusion
An efficient air removal method has been presented for the imaging assessment of large humans bones samples. The corresponding BMD values were closer to the ground truth but still higher. The issue of partial volume effect would have to be addressed in future studies.Acknowledgements
the authors would like to thank Lorenzo Salvi for the fabrication of the 3D printed registration tool.
This project has received funding from the European Union’s Horizon 2020 research and innovation programme under the Marie Skłodowska-Curie grant agreement No713750. Also, it has been carried out with the financial support of the Regional Council of Provence- Alpes-Côte d’Azur and with the financial support of the A*MIDEX (n° ANR- 11-IDEX-0001-02), funded by the Investissements d'Avenir project funded by the French Government, managed by the French National Research Agency (ANR).)
References
[1] A.C. Seifert at al., “Bone mineral ³¹P and matrix-bound water densities measured by solid-state ³¹P and ¹H MRI”, NMR in Biomed. 2014; 27: 739-748.
[2] C.S. Rajapakse et al., “Accuracy of MRI-based finite element assessment of distal tibia compared to mechanical testing”, Bone, vol. 108, March 2018, pp. 71-78.
[3] X. Sherry Liu et al., “Accuracy of high-resolution in vivo micro magnetic resonance imaging for measurements of microstructural and mechanical properties of human distal tibial bone”, J Bone Miner Res. 2010 September; 25(9): 2039-2050.
[4] C.S. Rajapakse et al., “Implications of noise and resolution on mechanical properties of trabecular bone estimated by image-based finite-element analysis”, Journal of Orthopaedic Research, October 2009
[5] C.S. Rajapakse et al., “Computational biomechanics of distal tibia from high-resolution MR and micro-CT images”, Bone, vol. 47, May 2010, pp. 556-563.
[6] R. Koshi et al., “Cunningham's Manual of Practical Anatomy VOL 1 Upper and Lower limbs”, 16th Edition.
[7] J R.P. Dougherty et al., “Computing local thickness of 3D structures with ImageJ”, Microsc Microanal 13(Suppl 2),2007.
[8] S. Majumdar et al., “Correlation of trabecular bone structure with age, bone mineral density, and osteoporotic status: in vivo studies in the distal radius using high resolution magnetic resonance imaging”, Journal of Bone and Mineral Research, vol. 12, Number 1, 1997.
[9] G. Chang et al., “Finite element analysis applied to 3T MR imaging of proximal femur architecture: lower bone strength in patients with fragility fracture compared with control subjects”, Radiology, vol. 272: Number 2-August 2014.
Figures
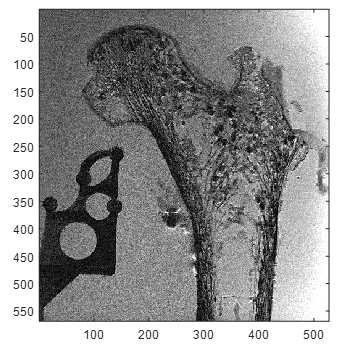
3T TSE MRI coronal plane before air bubbles reduction.