2771
Idiopathic osteonecrosis of the scaphoid (Preiser’s disease): Viability patterns in contrast-enhanced MRI1Institute of Diagnostic and Interventional Radiology, University Hospital Würzburg, Würzburg, Germany, 2Department of Diagnostic and Interventional Radiology, Rhön-Klinikum Campus Bad Neustadt, Bad Neustadt a. d. Saale, Germany
Synopsis
With the ability to non-invasively display different viability patterns in the scaphoid bone, contrast-enhanced MRI is a powerful tool for detection and staging of Preiser’s disease. To our best knowledge, this study includes the largest patient sample undergoing MRI for idiopathic osteonecrosis of the scaphoid to date, thus expanding the knowledge on this rare disease entity. Our results suggest that the size of scaphoid necrosis is considerably overestimated in unenhanced MRI because necrotic bone cannot be reliably differentiated from vascularized repair tissue. Influencing decision on therapy, the extent of osteonecrosis should consequently not be assessed without administration of contrast agent.
Introduction
Idiopathic avascular necrosis of the scaphoid is a rare condition supposedly induced by circulatory disturbances of the nutrient arteries. For diagnosis of Preiser’s disease and proper differentiation from posttraumatic scaphoid nonunion, previous scaphoid fracture must be ruled out. Irrespective of the causative agent (e.g. steroid or chemotherapy, connective tissue disorders), literature agrees that the scaphoid’s retrograde vascularization is the main reason for the development of Preiser’s disease1,2,3. The scaphoid receives its blood supply mainly from branches of the radial artery, all entering through the distal portion of the scaphoid. While palmar branches reach the distal segment and tuberosity, dorsal branches supply the middle and proximal segments. Characteristically, no anastomoses exist between the palmar and dorsal vascular territories and no nutritional vessels enter the scaphoid proximally. Therefore, the proximal pole is a vascular terminal zone and dependent on the integrity of the intraosseous blood flow. If blood flow is impaired by any condition, the proximal scaphoid pole is highly endangered regarding ischemia1,4. The aims of this study were to differentiate stages of Preiser’s disease by means of perfusion patterns and assess the linear extent of osteonecrosis in native and contrast-enhanced MRI (ceMRI).Methods
Between 2002 and 2019, 43 patients (16 men, 27 women, mean age 39.9 ± 13.4 years) were identified to suffer from Preiser’s disease and included in this study. Negative wrist trauma history and absence of pre-existing scaphoid fractures in high-resolution multidetector CT were mandatory for inclusion. Two musculoskeletal radiologists retrospectively analysed two MRI datasets for each patient in consensus reading. One set contained coronal fat-saturated PD-weighted FSE, sagittal fat-saturated T2-weighted FSE and unenhanced T1-weighted FSE sequences, with the latter being acquired in the sagittal-oblique plane parallel to the longitudinal axis of the scaphoid. The other dataset included all the above and additional fat-saturated T1-weighted FSE sequences in coronal and sagittal-oblique direction after intravenous application of gadolinium. Observers were asked to gauge the maximum diameter of scaphoid necrosis for each dataset and state their confidence in the measurement on a three-point scale (3 = high, 2 = moderate, 1 = low).Results
Three different viability patterns could be distinguished in our study population by means of ceMRI. In three patients (7.0%), proximal T1 signal loss before and after gadolinium application was observed with adjacent regular bone signal. The resulting two-layer appearance was deemed characteristic for the presence of inactive or chronic partial necrosis. In 39 patients (90.7%), vascularized repair tissue was visible between necrosis and viable bone. Osteonecrosis and repair zones could not be discerned in plain MRI. By administration of contrast agent, however, the discrimination of proximal avascular necrosis, adjacent hypervascular repair tissue, and distal regular bone marrow was possible resulting in a three-layer signal distribution. This configuration was interpreted to indicate an active partial necrosis. One patient (2.3%) displayed an entirely necrotic scaphoid without any T1 signal increase after use of contrast media due to lack of repair and viable tissue. Without contrast agent, observers surmised the mean extent of osteonecrosis (assessed by maximum diameter) as 10.0 mm (SD 3.3 mm). After intravenous application of gadolinium and subsequent acquisition of contrast-enhanced T1-weighted planes, the identified extent was considerably smaller (p<0.001) with 7.4 mm (SD 2.9 mm). Mean difference in Bland-Altman analysis was 2.9 mm with a standard error of estimation of 1.9 mm. Diagnostic confidence for the measurement of osteonecrosis was considerably higher in ceMRI (p<0.001).Discussion
While earlier studies without application of gadolinium suspected Preiser’s disease to affect the entire scaphoid bone,5 the vast majority of patients in our population displayed imaging characteristics of an active partial osteonecrosis with the necrotic tissue being predominantly located at the proximal pole of the scaphoid. MRI-based differentiation between complete necrosis, active and chronic partial necrosis aids in assessment of the most appropriate therapy. Treatment can be approached conservatively, other options include bone graft incorporation and salvage procedures in more advanced stages.3,6 In our study, the extent of scaphoid necrosis was overrated in native MRI compared to ceMRI. Since confidence in the measurements was simultaneously lower in unenhanced MRI, we assume that the overestimation is due to the lack of differentiability between active repair tissue and necrotic bone without prior gadolinium application.Conclusion
Contrast-enhanced MRI is the method of choice for staging in Preiser’s disease. Without T1-weighted sequences after intravenous gadolinium application, hypervascular repair tissue cannot be discerned from necrotic scaphoid bone, resulting in overestimation of disease.Acknowledgements
Jan-Peter Grunz received a research grant by the Interdisciplinary Center of Clinical Research Wuerzburg, Germany (grant number Z-2/CSP-06).References
- Gelberman RH, Menon J. The vascularity of the scaphoid bone. J Hand Surg Am 1980; 5:508–132.
- Smith M, Bain GI, Turner PC et al. Review of imaging of scaphoid fractures. ANZ J Surg. 2010; 80: 82-903.
- Lauder AJ, Trumble. Idiopathic avascular necrosis of the scaphoid: Preiser’s disease. Hand Clin 2006;22:475–84.4.
- Schmitt R, Fröhner S, van Schoonhoven J et al. Idiopathic osteonecrosis of the scaphoid (Preiser’s disease)—MRI gives new insights into etiology and pathology. Eur J Radiol 2011; 77(02): 228–2345.
- Buttermann GR, Putnam MD, McElfresh EC et al. Idiopathic osteonecrosis of the scaphoid: a series of 3 surgical cases. Am J Orthop (Belle Mead NJ). 2004; 33: 142-1486.
- Karantanas A, Dailiana Z, Malizos K. The role of MR imaging in scaphoid disorders. Eur Radiol 2007; 17: 2860–71.
Figures
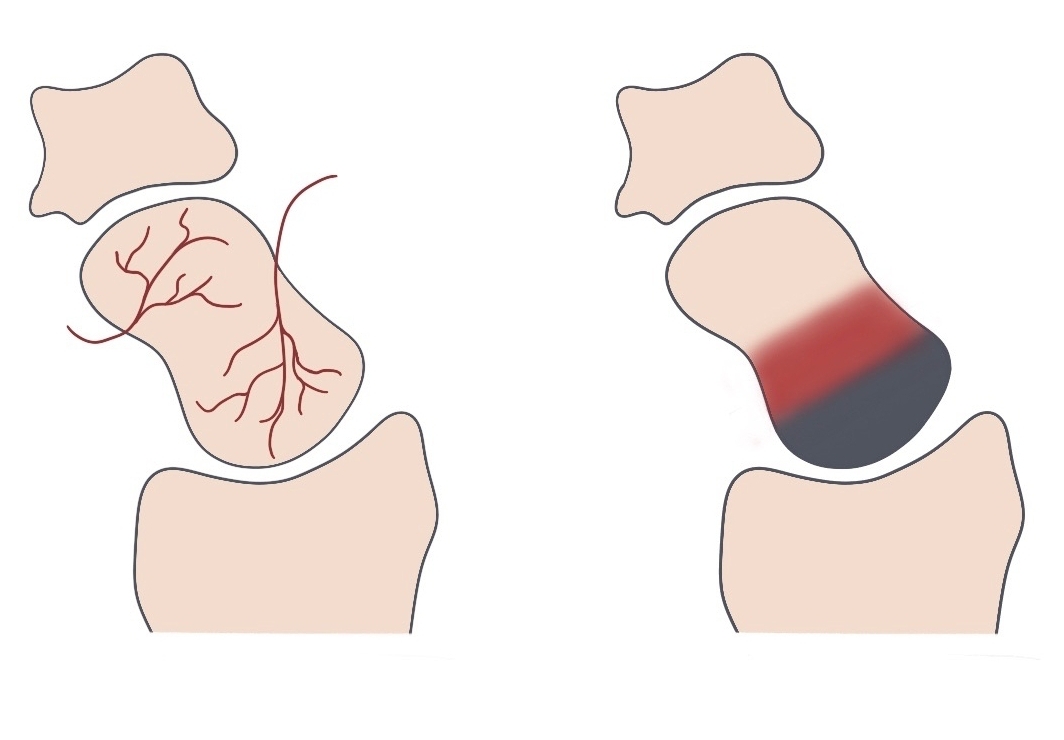
Figure 1 – Vascular supply of the scaphoid and viability zones in Preiser’s disease
Right: The nutrient vessels enter the distal portion of the scaphoid and form a retrograde intraosseous vascular network.
Left: In contrast-enhanced T1, a three-layer appearance is indicating an active partial necrosis: While necrotic bone (gray) is usually located at the proximal pole of the scaphoid, hypervascularized repair tissue (red) and viable bone are observed in the middle and distal parts, respectively.
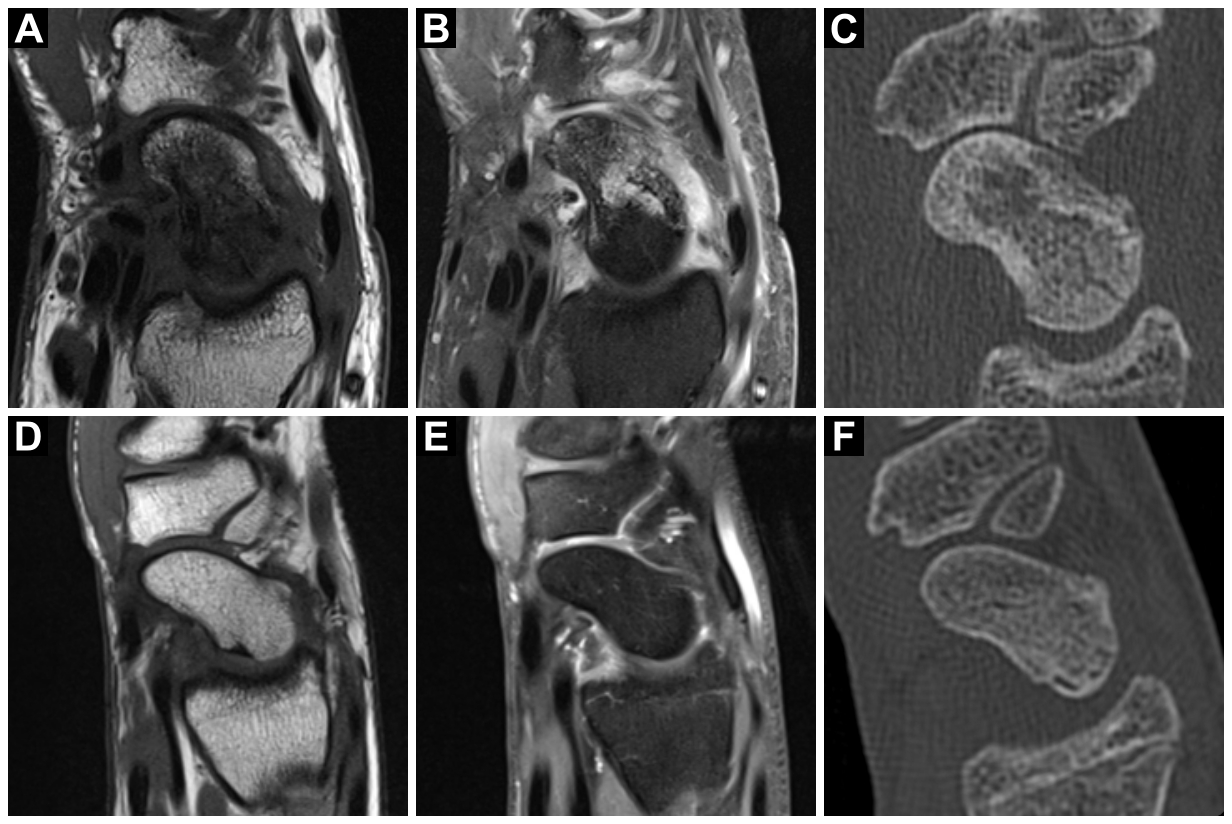
Figure 2 – Active and chronic partial necrosis of the scaphoid bone
Upper row: Active Preiser’s disease is characterized by an extensive signal loss in native T1 (A) and the presence of hyperintense repair tissue between necrotic and viable bone in T1 after administration of gadolinium (B). The necrotic area presents a pathologic fracture in CT (C).
Lower row: In chronic partial osteonecrosis, no hypervascularization is visible in contrast-enhanced T1 (E). Although the actual zone of necrosis is small (D), CT shows substantial proximal osteosclerosis and cystic inclusions (F).
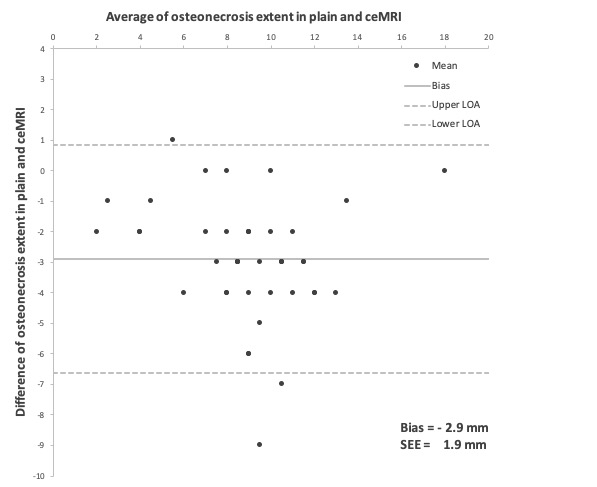
Figure 3 – Bland-Altman plot shows the difference between the estimated extent of osteonecrosis in native and contrast-enhanced MRI
LOA – limits of agreement; SEE – standard error of estimation; ceMRI – contrast-enhanced MRI