2769
3T CSE-MRI of multiple adipose tissue in osteoporosis patient with varying fracture risk1Radiology, NYU Langone Health, New York, NY, United States, 2Osteoporosis Center, NYU Langone Health, New York, NY, United States
Synopsis
Osteoporosis (OP) is a disease of weak bone associated with an increased fracture risk. Recent studies using Chemical Shift Encoded MRI has been previously used to show differences in term of fat amount related to osteoporosis condition in spine and femur.
The aim of our study is to use CSE-MRI in muscle, bone marrow and subcutaneous fat of the pelvic region in osteoporosis patient with varying degree of fracture risk.
Introduction
Osteoporosis (OP) is a disease of weak bone associated with increased fracture risk and represents an important public health problem. Fracture risk is commonly assessed in the clinic using Dual X-Ray Absorptiometry (DXA) and measurement of the Bone Mineral Density (BMD). An important component of bone tissue is bone marrow adipose tissue (BAT), which has been previously associated with higher fracture risk and osteoporosis(1,2). Recent studies using magnetic resonance spectroscopy (MRS) have shown an association between BMD and fat quantity in the spine (3) and femur. Chemical Shift Encoded MRI (CSE-MRI) allows quantitative assessment of adipose tissue with a greater spatial resolution than MRS and has been previously used to show differences in terms of fat quantity related to osteoporosis in the spine (4). The aim of our study was to apply CSE-MRI in muscle, bone marrow, and subcutaneous fat of the pelvic region in osteoporosis patients with varying degrees of fracture risk.Material/Method
Subjects: This prospective HIPAA compliant study was approved by the institutional review board, and we obtained written informed consent from all n=128 recruited female subjects with osteoporosis (Table 1). FRAX scores were computed considering patient race and were then divided into three groups for analysis based upon overall FRAX score: low (LOW, FRAX score for major osteoporotic fracture < 10), moderate (MOD, FRAX score for major osteoporotic fracture >10 and <20) and high (HIGH, FRAX score for major osteoporotic fracture >20). 'MRI acquisition: MR acquisitions were performed on a 3T MRI system (Siemens healthineers, Erlangen, Germany) using a 3D spoiled gradient-echo sequence with 3 or 6 echoes time (2.1/2.8/3.5 or 2.1/2.8/3.5/4.5/5.2/5.9ms); with flyback monopolar readout gradient. TR/FA = 12ms/3° and BW= 1400 Hz/px. 40 sagittal slices were acquired. The magnitude and phase images were reconstructed from raw data, and the IDEAL algorithm (5) was then used for fat and water separation using an eight peaks fat spectrum model, R2* estimation and computation of Proton Density Fat Fraction (PDFF) maps. From the reconstructed phase, image susceptibility mapping was performed using the MEDI approach (6) with projection onto the dipole field and background field removal.
Segmentation: Thigh muscle (MUS), BAT, and subcutaneous adipose tissue (SAT) were then segmented by thresholding the PDFF map.
Statistical analysis: An unpaired one-way ANOVA test was used to assess significant differences between groups with a statistical threshold of p<0.05 for significance.
Results
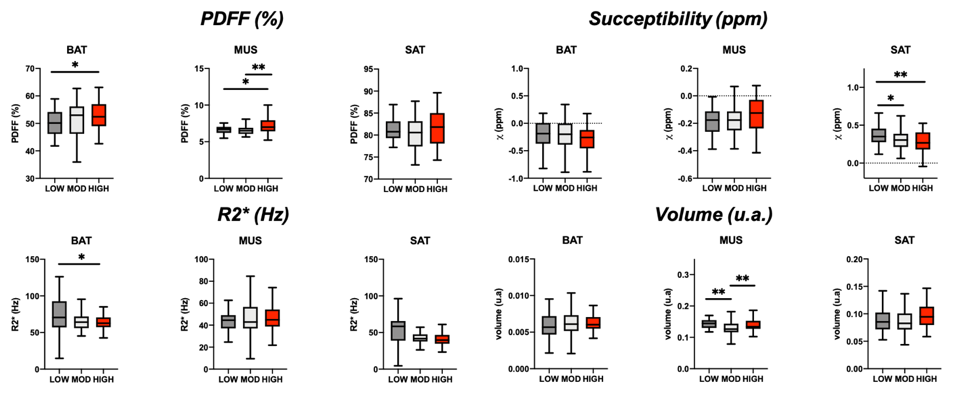
Typically acquired images, parametric maps, and masks is depicted in Figure 1. Differences between the group are shown in Figure 2. Overall, in BAT, we found a higher amount of PDFF in HIGH subjects compared to LOW subjects (+5%, p= 0.032). In muscle, we found a higher amount of PDFF in HIGH compared to both LOW (+8.87%, p =0.008) and MOD subjects (+9.25%, p= 0.006). There were no differences between groups with regards to R2* measured. We found diamagnetic BAT and MUS and paramagnetic SAT.[Office1] Susceptibility of SAT was higher in LOW compared to both HIGH (-31%, p= 0.008) and MOD ( -23%, p= 0.04) subjects. Volume of MUS was lower in MOD compared to LOW (-8%, p=0.009) and HIGH (-9%, p=0.045). [Office1]Not sure if I understand.Discussion/Conclusion
Our result suggests that fracture risk is related to an increased amount of adipose tissue in BAT and thigh muscle. 3T CSE-MRI could be used in the future to study the relationship between adipose tissue and bone health and possibly even provide an additional surrogate marker of fracture risk beyond BMD.Acknowledgements
No acknowledgement found.References
1. Griffith JF, Yeung DK, Ahuja AT, et al. A study of bone marrow and subcutaneous fatty acid composition in subjects of varying bone mineral density. Bone 2009;44(6):1092-1096.
2. Griffith JF, Yeung DKW, Antonio GE, et al. Vertebral Marrow Fat Content and Diffusion and Perfusion Indexes in Women with Varying Bone Density: MR Evaluation. http://dxdoiorg/101148/radiol2413051858 2006.
3. Schwartz AV, Sigurdsson S, Hue TF, et al. Vertebral bone marrow fat associated with lower trabecular BMD and prevalent vertebral fracture in older adults. J Clin Endocrinol Metab 2013;98(6):2294-2300.
4. Zhao Y, Huang M, Ding J, et al. Prediction of Abnormal Bone Density and Osteoporosis From Lumbar Spine MR Using Modified Dixon Quant in 257 Subjects With Quantitative Computed Tomography as Reference. J Magn Reson Imaging 2019;49(2):390-399.
5. Reeder SB, Pineda AR, Wen Z, et al. Iterative decomposition of water and fat with echo asymmetry and least-squares estimation (IDEAL): application with fast spin-echo imaging. Magn Reson Med 2005;54(3):636-644.
6. de Rochefort L, Liu T, Kressler B, et al. Quantitative susceptibility map reconstruction from MR phase data using bayesian regularization: Validation and application to brain imaging. Magnetic Resonance in Medicine 2010;63(1):194-206.
Figures