2768
FRACTURE: FFE Resembling A CT Using Restricted Echo-spacing: A Novel MRI Technique for Bone Evaluation1Philips Healthcare, Gainesville, FL, United States, 2Texas Scottish Rite Hospital for Children, Dallas, TX, United States
Synopsis
Computed tomography (CT) is the current modality of choice for imaging bone yet it suffers from poor soft tissue contrast and utilizes ionizing radiation. Unlike CT, MRI provides excellent soft-tissue contrast, but is limited in its ability to image bone. Here, we describe FRACTURE (FFE Resembling A CT Using Restricted Echo-spacing), a novel 3D gradient-echo approach that offers MRI-based bone contrast to yield clinically relevant information for patient management.
INTRODUCTION
Computed tomography (CT) is the current modality of choice for imaging bone and osseous structures 1. Despite its availability, quick acquisition times, and high spatial resolution, CT suffers from poor soft tissue contrast and utilizes ionizing radiation1. Increases in cancer rates due to CT exposure is also a concern, and alternative imaging strategies, like MRI, can eliminate radiation exposure altogether 2. Moreover, the ability for MRI to provide clinically relevant bone imaging and information has the potential to simplify and reduce the cost of surgical planning in procedures where both an MRI and CT are currently required3. Unlike CT, MRI provides excellent soft-tissue contrast. However, conventional MRI is fundamentally limited in its ability to image bone compared to CT due to the organized structure, low proton density, and very short T2/T2* decay times of bone1,4. The need for MRI to image bone has been a focus for musculoskeletal radiology and proliferated the research into using ultra-short echo time (UTE), zero-echo time (ZTE), and “black bone” techniques to provide diagnostic information on bone and osseous structures5. Although these techniques show promise there is no standardization of the pulse sequences and post-processing and currently they are not commercially available from any major MRI vendor4,6. Other techniques like 3D Fast Large Angle Spin Echo (FLASE), and Sweep Imaging with Fourier Transform (SWIFT) have also been developed for imaging of osseous structures, but require advanced manipulation of the MRI pulse sequence7. Here, we describe FRACTURE (FFE Resembling A CT Using Restricted Echo-spacing), a novel 3D gradient-echo approach that offers MRI-based bone contrast that yields clinically relevant information for patient management.METHODS
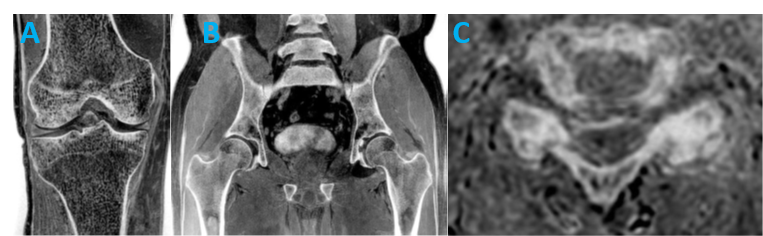
To better visualize osseous structures and defects by MRI we created FRACTURE – a 3D gradient-echo approach that utilizes an additional subtraction post-processing step. FRACTURE is a multi-echo (3 or more) gradient echo pulse sequence, where the echoes are recorded at a precise echo-spacing that corresponds to the in-phase TE times (i.e. 2.3 ms at 3T; and 4.6 ms at 1.5T). Acquiring in-phase TEs provides two benefits to help FRACTURE produce strong bone contrast: 1) in-phase TE allows the water-fat chemical shift to be minimized for better delineation and localization of bone, 2) in-phase TE helps to reduce additional dephasing caused by T2* decay at bone-tissue interfaces. Following acquisition, an automated in-line post processing is performed to create images that resemble a CT-like contrast. The post-processing consists, first, of a summation of all echoes to increase the available signal-to-noise ratio that is inherently lower with high-resolution imaging and for tissue with short T2*. Second, the last echo image is subtracted from the summed images, and the grayscale is inverted to make bone appear hyperintense, similar to CT (Figure 1).RESULTS
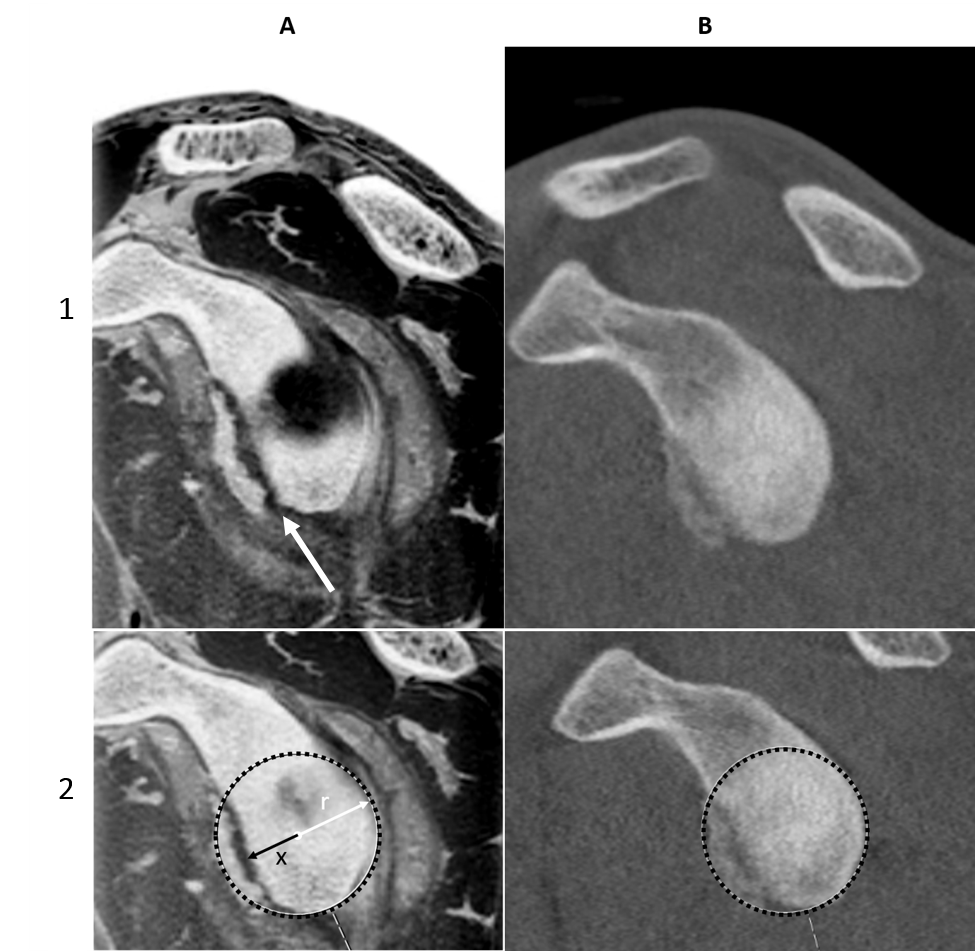
Figure 2 shows FRACTURE images from a 17-year old football player with recurrent left anterior shoulder instability following an untreated, poorly described injury. The arm was scanned in abduction and with external rotation. 3T isotropic 3D FRACTURE imaging was performed with the following imaging parameters: Field of View = 160 mm x 160 mm; resolution = 0.62 x 0.62 x 0.62 mm3; TE= 2.3, 4.6, 6.9, 9.2, 11.5, and 13.8 ms; TR = 50 ms, scan duration 4:56). Oblique sagittal and axial reconstructions were used to assess the bony glenoid. Images were acquired on a Philips 3T Elition (Best, Netherlands) with a dedicated 16-channel receive shoulder coil. A preoperative CT scan was subsequently acquired for quantification of glenoid bone loss using the best-fit circle measurement technique8. Comparison of CT to FRACTURE (Figure 2) demonstrates better visualization of the anterior glenoid fracture on MR, enabling quantification of percent bone loss using the FRACTURE sequence.DISCUSSION
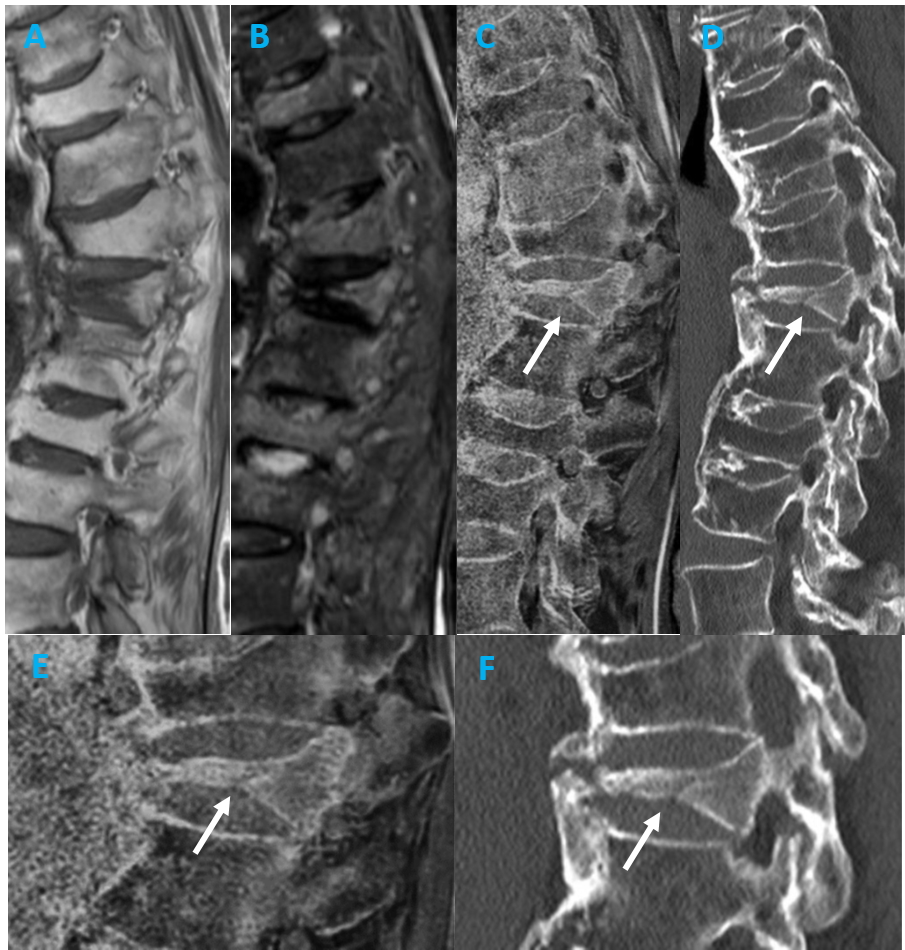
Direct comparison of FRACTURE to CT images shows good agreement, with better visualization of the anterior glenoid fracture on FRACTURE in this case report. FRACTURE was also used to image clinical cases of fractures, spondylolysis, vertebral hernia, bone erosion, loose body, and other musculoskeletal pathologies (e.g. Figure 3). Uses of 3D gradient-echo pulse sequences have shown potential in improving bony contrast with conventional MRI techniques5,6. Similarly, Lansdown et al. used a 3D gradient echo and Dixon fat-water subtraction technique to provide better bone contrast compared to standard T1- and T2-weighted MRI. Use of 3D gradient echo based sequences have shown to provide high bone contrast by providing images with low signal bone contours compared to the surrounding high signal fatty bone marrow and soft tissue4. FRACTURE has potential to be a useful and easily implementable MRI imaging technique for many reasons: 1) it is based on conventional 3D gradient echo sequences available on every commercially available scanner, 2) simple and automated post-processing technique to produce CT-like contrast, 3) 3D acquisition allows for multi-planar reformats, 4) high-resolution scanning with a contrast similar to that of CT, 5) one imaging modality for soft tissue and bone contrast to streamline workflow, and 6) no ionizing radiation.Acknowledgements
No acknowledgement found.References
1. Cho S, Baek H, Ryu K, et al. Clinical Feasibility of Zero TE Skull MRI in Patients with Head Trauma in Comparison with CT: A Single-Center Study. American Journal of Neuroradiology. 2019;40(1):109-115.
2. Dremmen M, Wagner M, Bosemani T, et al. Does the Addition of a “Black Bone” Sequence to a Fast Multisequence Trauma MR Protocol Allow MRI to Replace CT after Traumatic Brain Injury in Children? American Journal of Neuroradiology. 2017;38(11):2187-2192.
3. Lansdown DA, Cvetanovich GL, Verma NN, et al. Automated 3-Dimensional Magnetic Resonance Imaging Allows for Accurate Evaluation of Glenoid Bone Loss Compared With 3-Dimensional Computed Tomography. Arthroscopy: The Journal of Arthroscopic & Related Surgery. 2019;35(3):734-740.
4. Ma Y-j, West J, Nazaran A, et al. Feasibility of using an inversion-recovery ultrashort echo time (UTE) sequence for quantification of glenoid bone loss. Skeletal radiology. 2018;47(7):973-980.
5. Eley K, McIntyre A, Watt-Smith S, Golding S. “Black bone” MRI: a partial flip angle technique for radiation reduction in craniofacial imaging. The British journal of radiology. 2012;85(1011):272-278.
6. Chang G, Boone S, Martel D, et al. MRI assessment of bone structure and microarchitecture. Journal of Magnetic Resonance Imaging. 2017;46(2):323-337.
7. Techawiboonwong A, Song HK, Magland JF, Saha PK, Wehrli FW. Implications of pulse sequence in structural imaging of trabecular bone. Journal of Magnetic Resonance Imaging: An Official Journal of the International Society for Magnetic Resonance in Medicine. 2005;22(5):647-655.
8. Lee RK, Griffith JF, Tong MM, Sharma N, Yung P. Glenoid bone loss: assessment with MR imaging. Radiology. 2013;267(2):496-502.
Figures