2767
Simultaneous imaging of trabecular and cortical bone by analyzing the multi-echo signal decay at UTEs and conventional TEs1Department of Diagnostic and Interventional Radiology, Technical University of Munich, Munich, Germany, 2Division of Infectious Diseases and Tropical Medicine, Munich, Germany
Synopsis
Osteoporosis is characterized by a loss in bone mass and structural decrease of bone tissue which is leading to morbidity and an increased fracture risk. Fractures occur predominantly in areas with trabecular bone and the assessment of the bone volume and microstructural changes in the trabecular bone are therefore highly relevant in fracture prediction. The present study characterizes the decay of trabecularized bone marrow signal in multi-echo imaging sampling both UTEs and conventional TEs. A novel methodology is proposed for simultaneous cortical and trabecular bone imaging in the presence of bone marrow.
Purpose
Trabecular bone imaging is highly relevant in osteoporotic fracture prediction1. Two main MR approaches have been proposed for measuring trabecular bone properties2. The first approach encompasses techniques focusing on bone marrow either by high-resolution imaging of the bone matrix voids within the marrow3,4 or by quantifying magnetic susceptibility effects using the marrow exponential signal decay at later echo times (TEs) (T2*/T2’ mapping)5 or its gaussian decay at short TEs6,7. The second approach encompasses techniques aiming on direct imaging of the bone matrix, using ultra-short TE (UTE) techniques in combination with fat/long T2-species suppression8-9. Techniques measuring bone marrow properties use conventional TEs and cannot image the cortical bone. Techniques measuring directly the bone matrix employ UTEs and image the cortical bone10, but need to suppress the marrow signal for trabecular bone imaging and suffer from lower sensitivity due to the low bone proton density11. This work characterizes the decay of trabecularized bone marrow signal in multi-echo imaging sampling both UTEs and conventional TEs and proposes a novel methodology for simultaneous cortical and trabecular bone imaging.Theory
We assume that a tissue consists of bone mineral matrix and fatty bone marrow. Given the different magnetic susceptibilities χ between bone matrix and marrow and the low-fat diffusion coefficient, the static dephasing regime in magnetically inhomogeneous tissues applies6: the fatty marrow signal shows gaussian decay at short TEs and exponential decay at later TEs. If the MR signal from the bone mineral matrix is neglected across TEs (low proton density and short T2*), the total tissue signal equals the bone marrow signal. The bone marrow signal at later TEs extrapolated at t=0 would be higher compared to the measured bone marrow signal at t=012 and the signal difference would be sensitive to the bone matrix volume fraction (ν).$$ ζ=e^{ν}=\frac{S_{extrapolated}(t=0) - S_{measured}(t=0)}{S_{extrapolated}(t=0) + S_{measured}(t=0)}$$
Methods
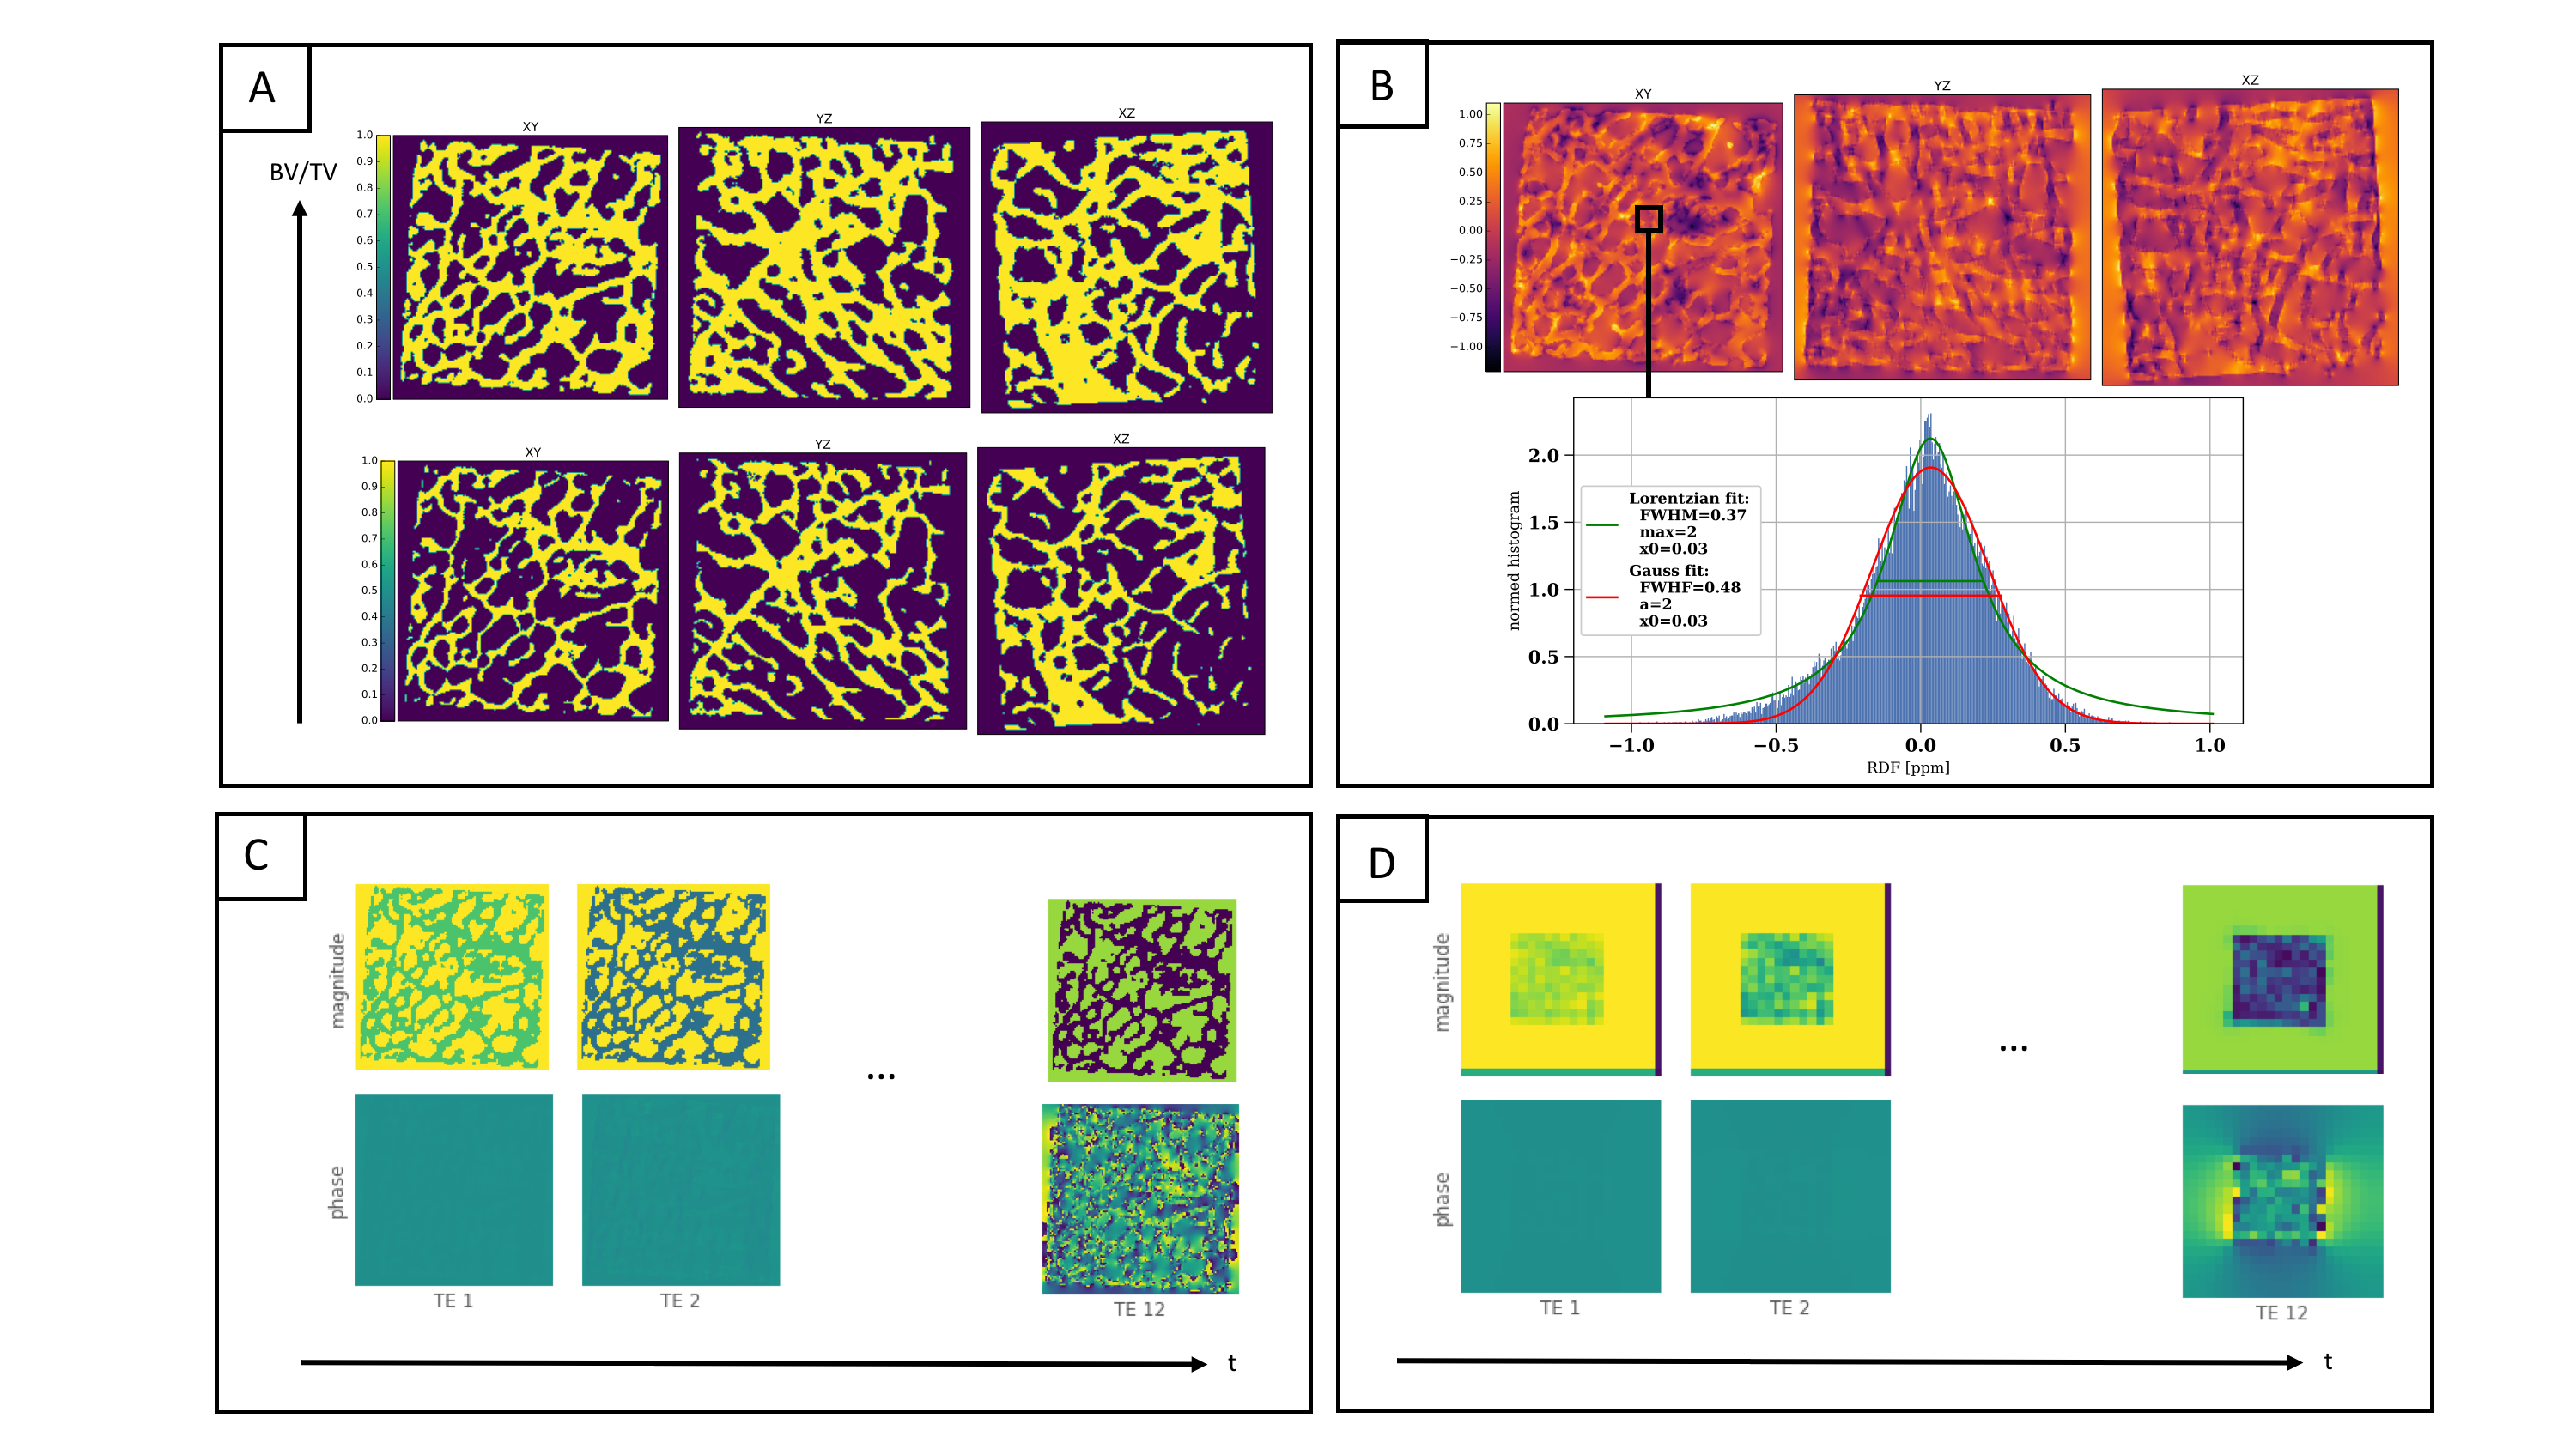
Bone cubes forward simulationBone masks were generated by thresholding human trabecular bone micro CT scans (dx=45.6µm, Figure 2A)13. Microscopic field-maps were forward simulated (Figure 2B) at different BV/TVs, different χ-difference of bone matrix to marrow and different orientations of the main magnetic field B0 (Figure 3A-B). The signal was then downsampled to the ‘macroscopic’ MR-like resolution (dx=1.5mm) and the simulations were repeated for different signal models: a) without bone matrix signal and T2,fat=60ms, b) with bone matrix signal, T2,fat=60ms, T2*bone=0.5ms, ρbone=0.3, c) with/without bone matrix signal and the 9-peak marrow fat spectrum model14 (Figure 3C).
In vivo measurements
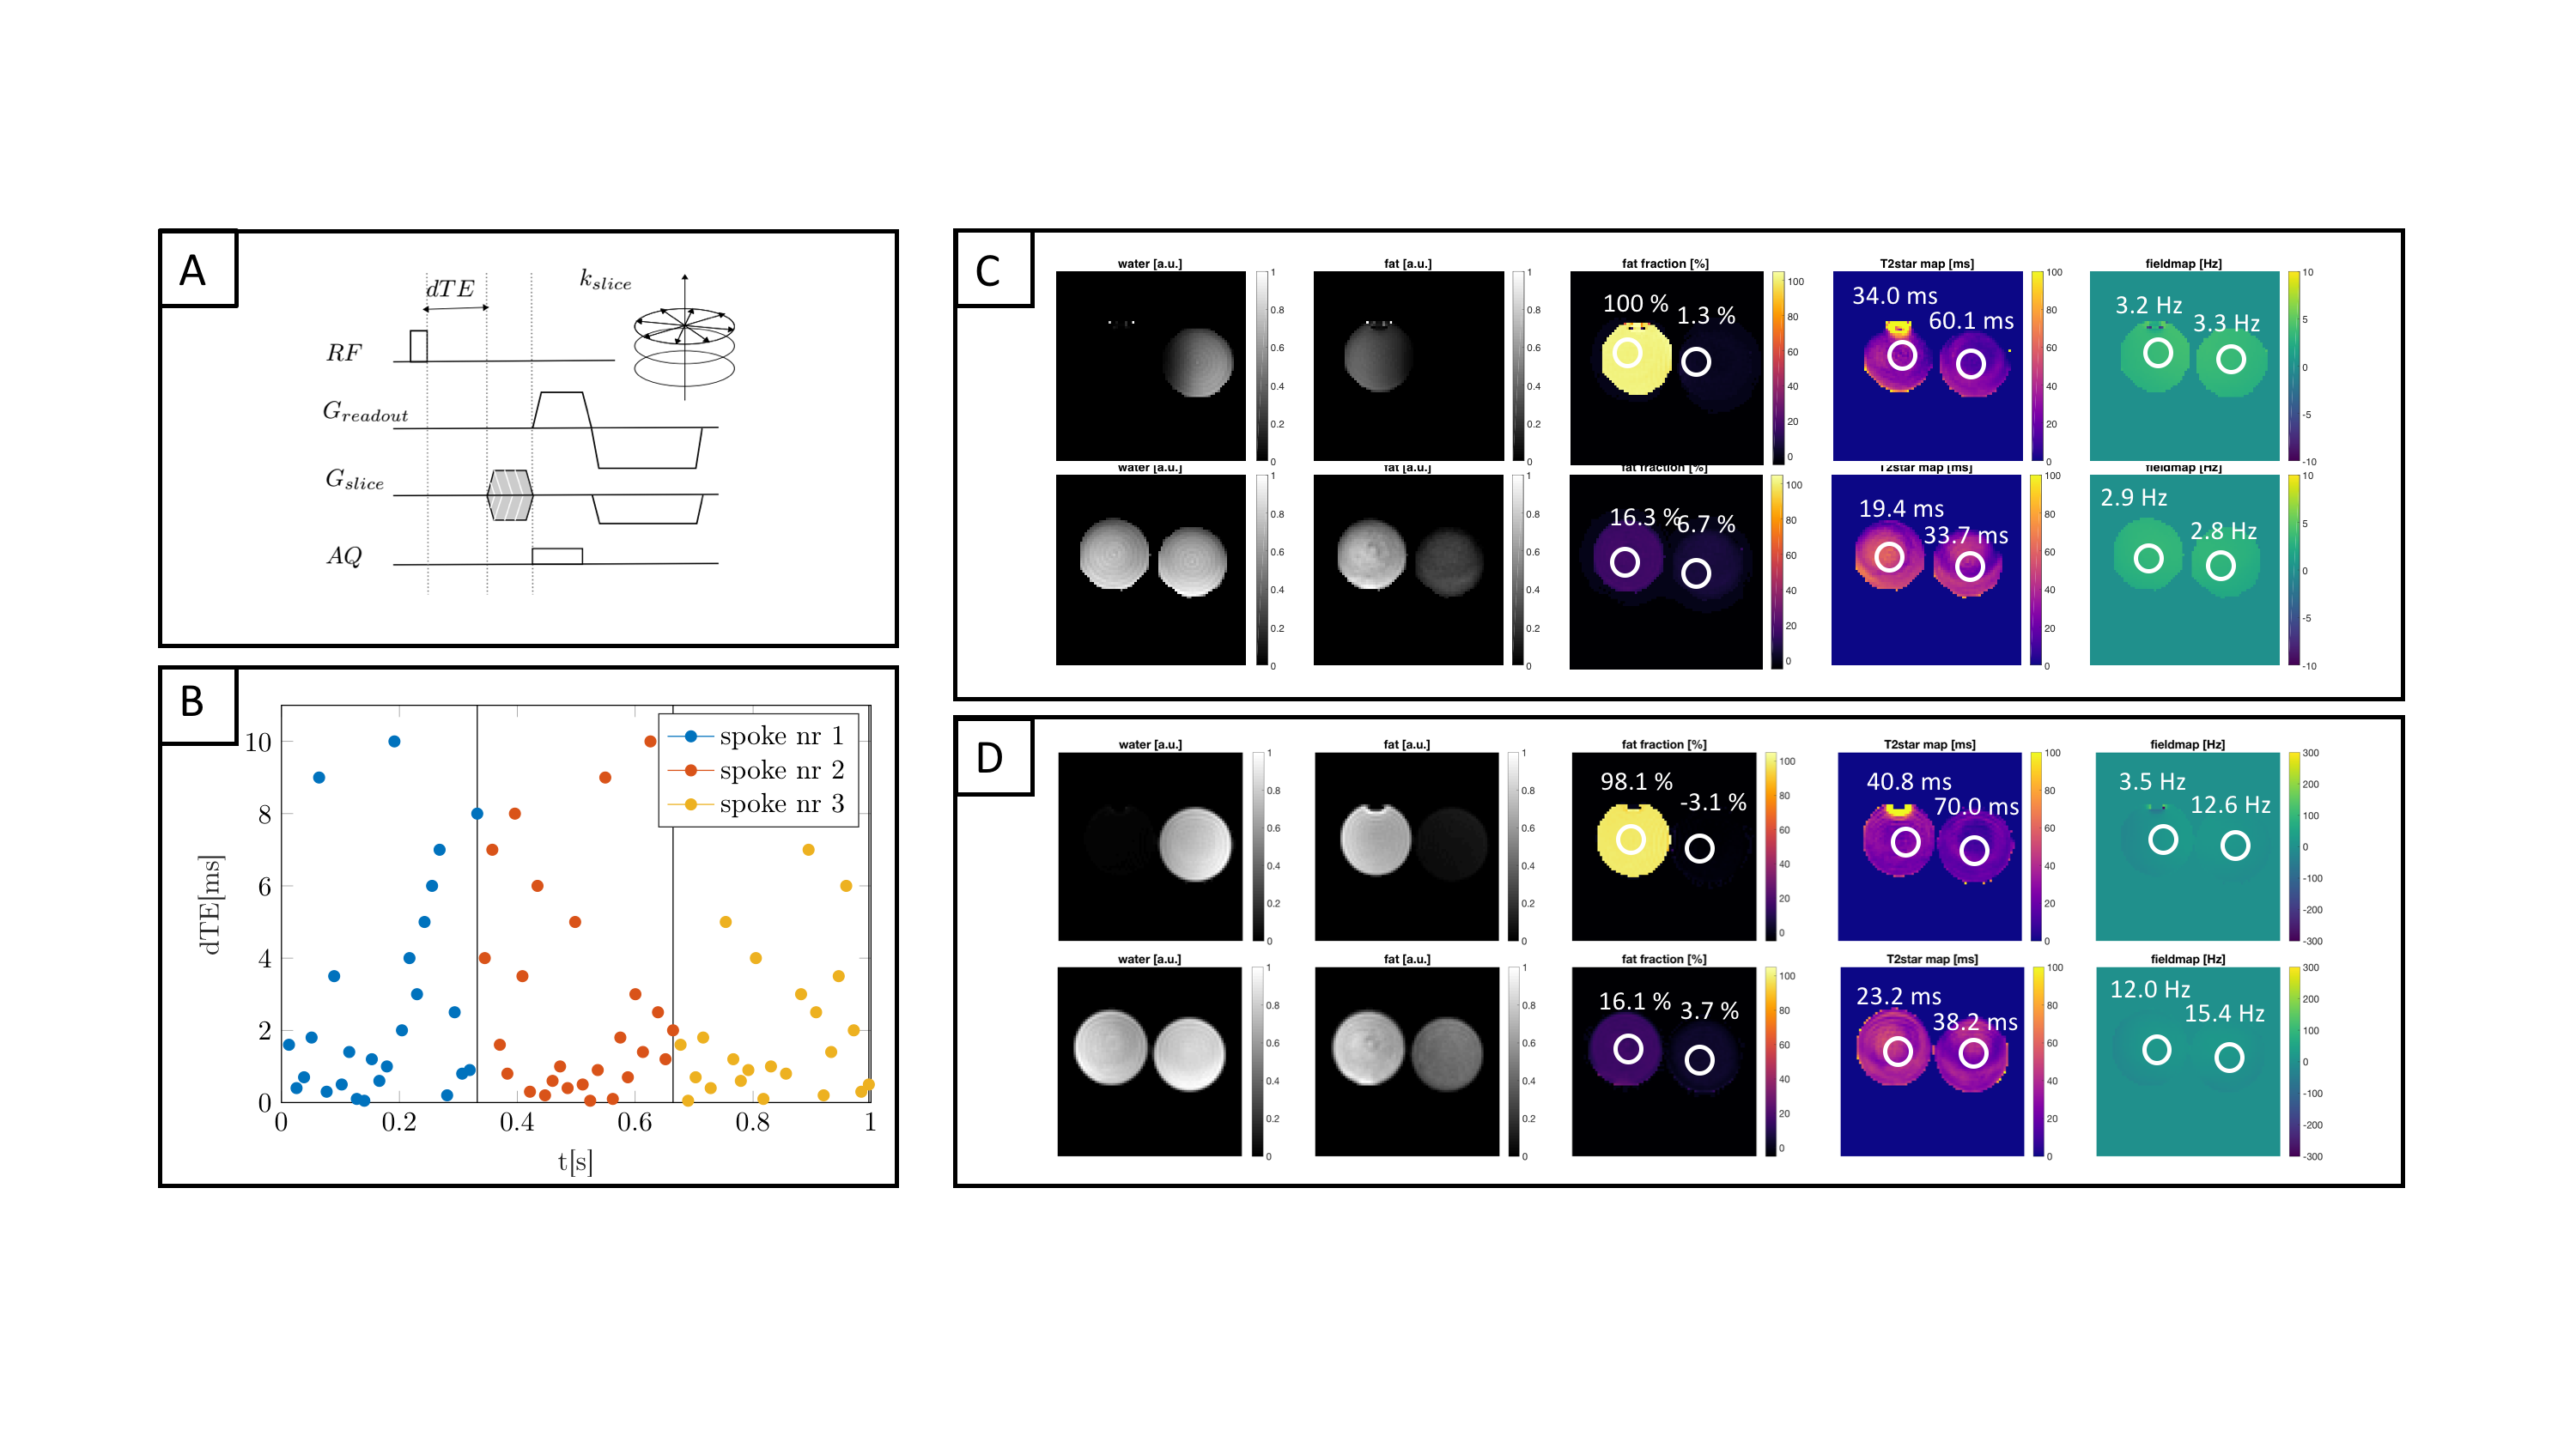
3D-UTE relaxometry measurements were performed with a stack-of-stars center-out radial acquisition and phase-encoding in the third cartesian dimension (Figure 1A, SENSE R=2) on a 3T system (Ingenia Elition, Philips Healthcare, Best, The Netherlands). All TEs of one spoke, with randomized order of the TEs15, were acquired before the spoke was rotated (Figure 1B). A scan with extensive echo sampling was performed with 26 TEs, range=0.19ms-10.14ms, resolution 1.5x1.5x4mm3, scan time 38min, flip-angle 5°, TR 12ms, in fat phantoms (PDFF 0%, 5%, 15%, 100%) and in the knee of two subjects. To simultaneously image cortical and trabecular bone regions using the ζ, 7 TEs were acquired in the knee of two subjects [0.19,1.29,2.39,3.49,4.59,5.69,6.79 ms] with a resolution of 1.5x1.5x2mm3 and a scan time of 15.4min.
Reconstruction and postprocessing
The UTE k-space trajectory was corrected by means of a gradient impulse response function16. A common-R2* water-fat signal model was used17, including echoes with a TE<1.54ms. The difference ζ between the measured signal and the extrapolated fitted curve was estimated at TE=0.19ms.
Results
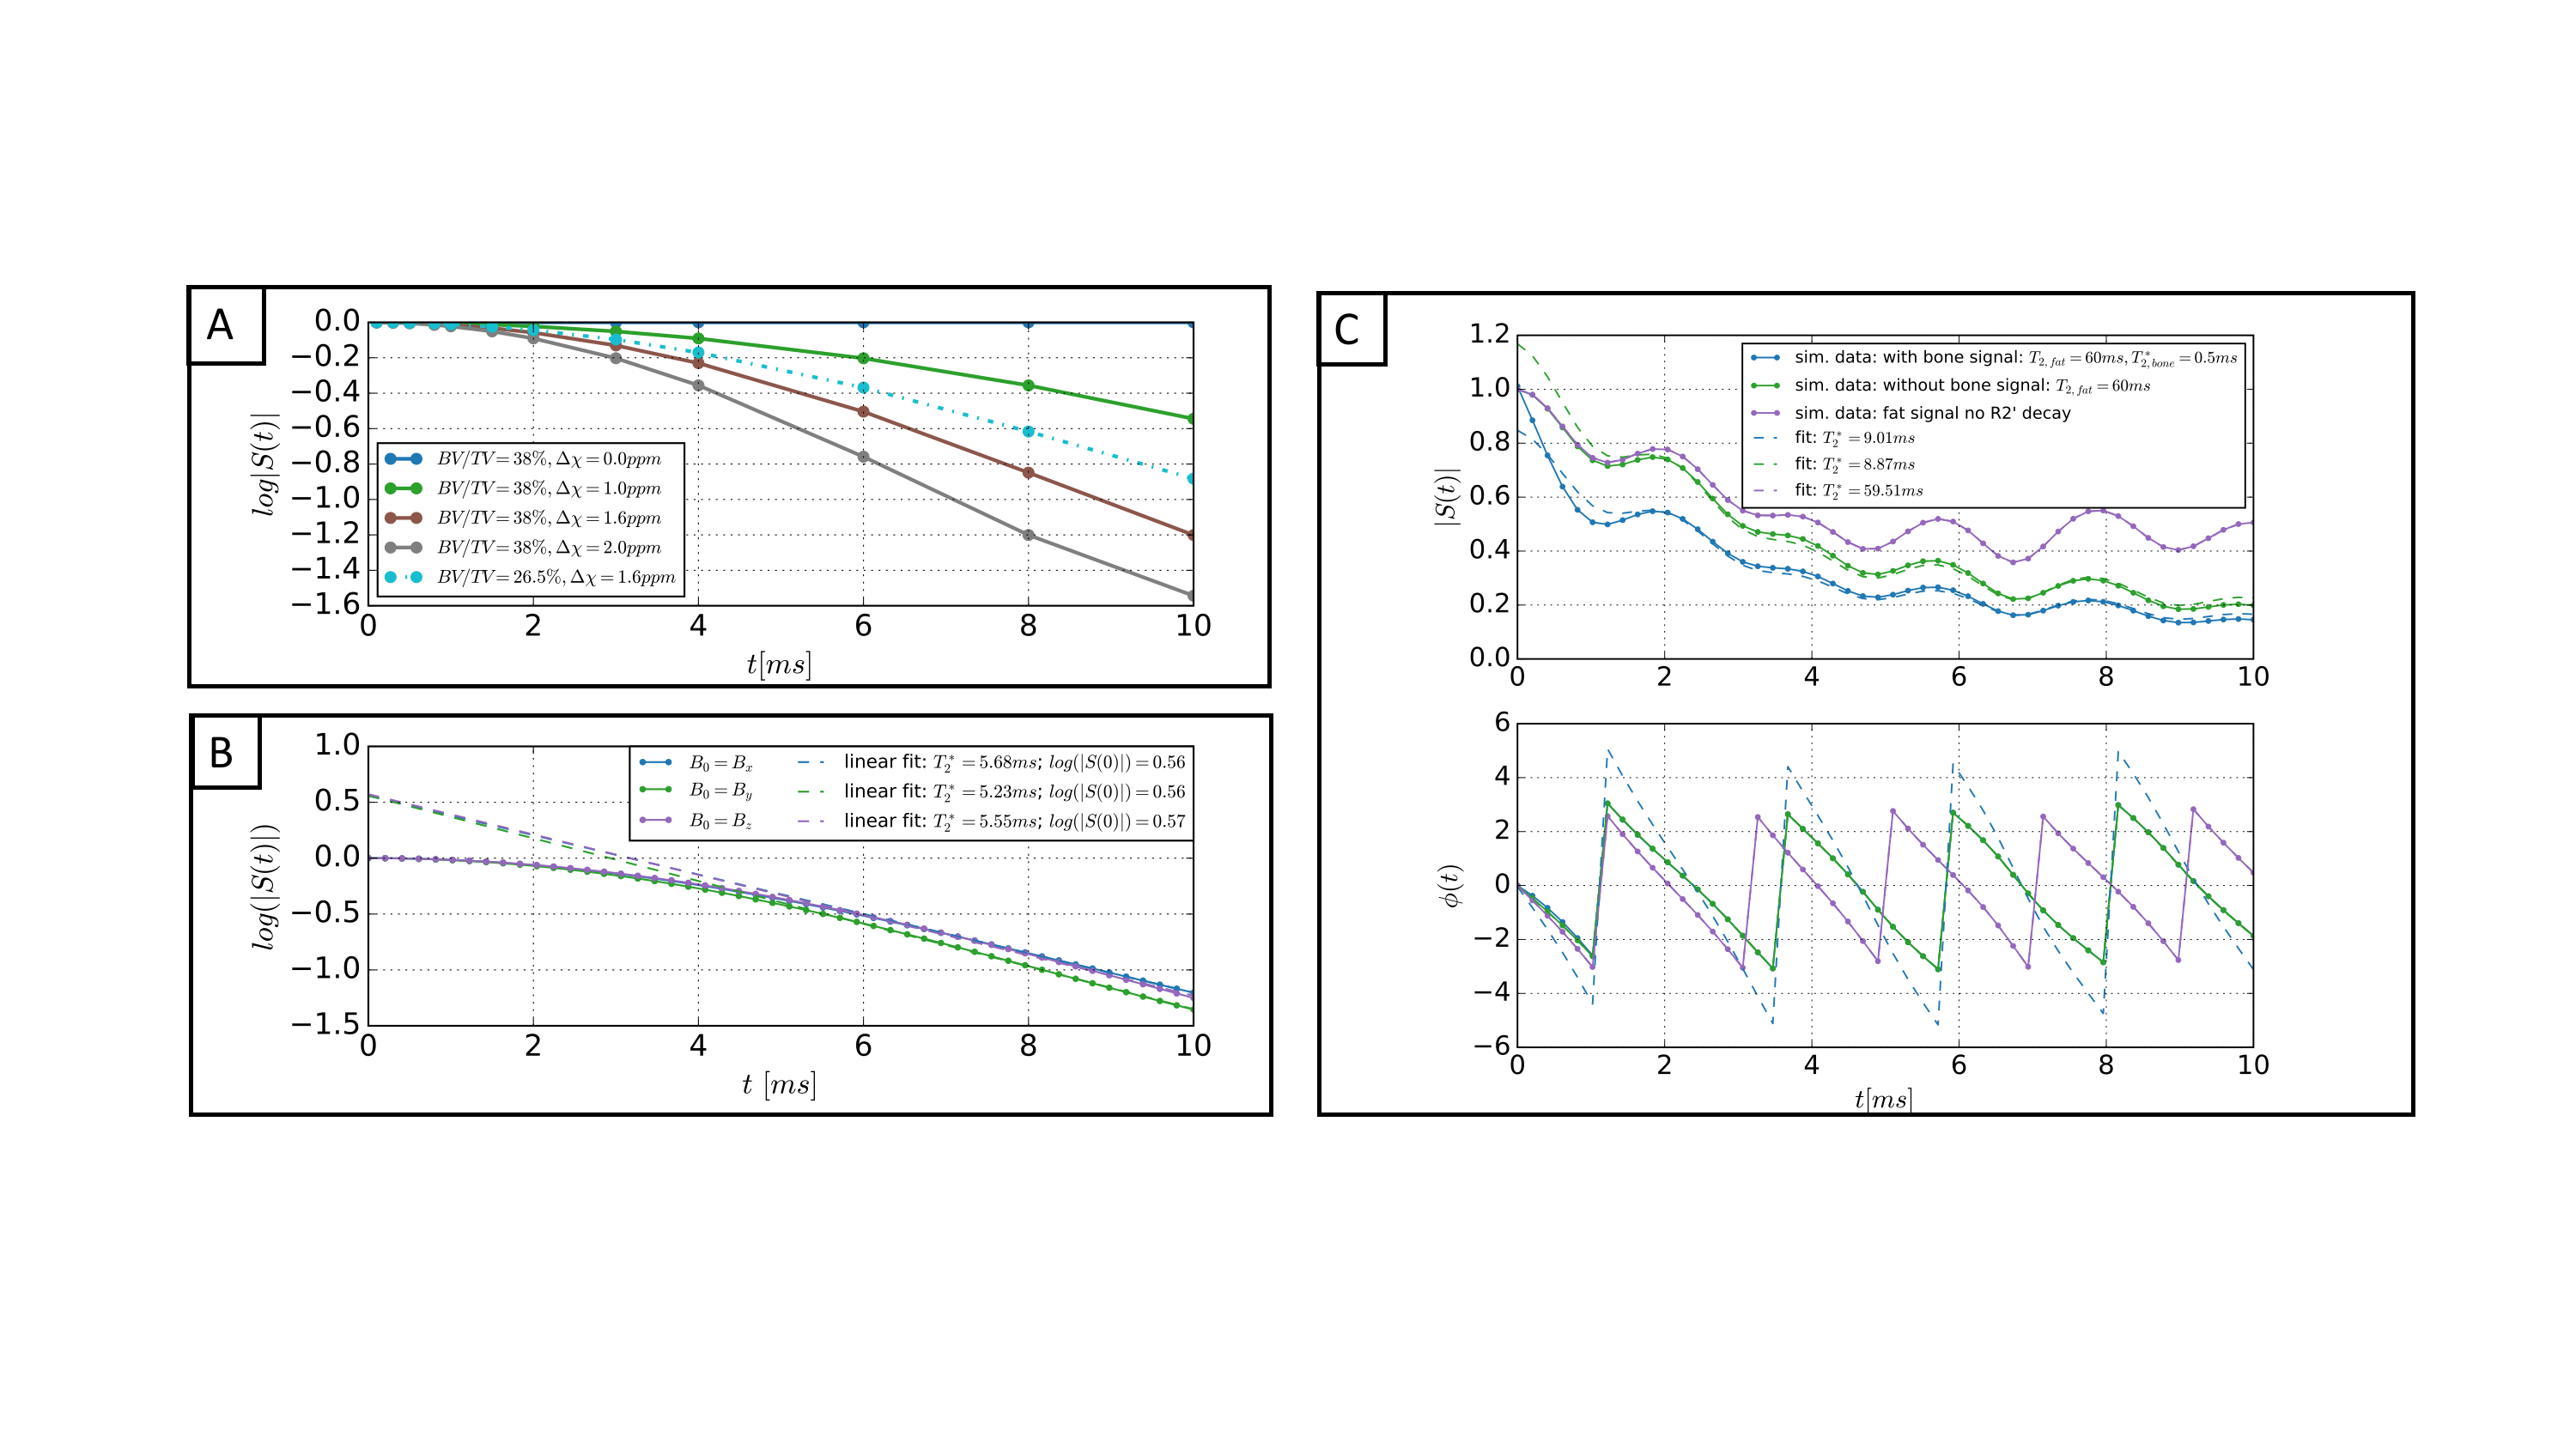
For TEs smaller than a characteristic time tc, the simulated signal decays exponentially with an argument that depends quadratically on TE (Figure 2). An exponential fit for points larger tc yields a T2* decay including a T2’ introduced due to the intra-voxel field inhomogeneities. For different orientations of B0, the T2* varied. S(t=0) of the extrapolated fitted curve was independent of microstructure changes.Figure 2C includes the fat chemical shift effect, showing an overestimation of the signal at t=0. Even after considering a fast decaying signal coming from the bone matrix, a time interval, where the extrapolated signal exceeded the measured signal, was observed.
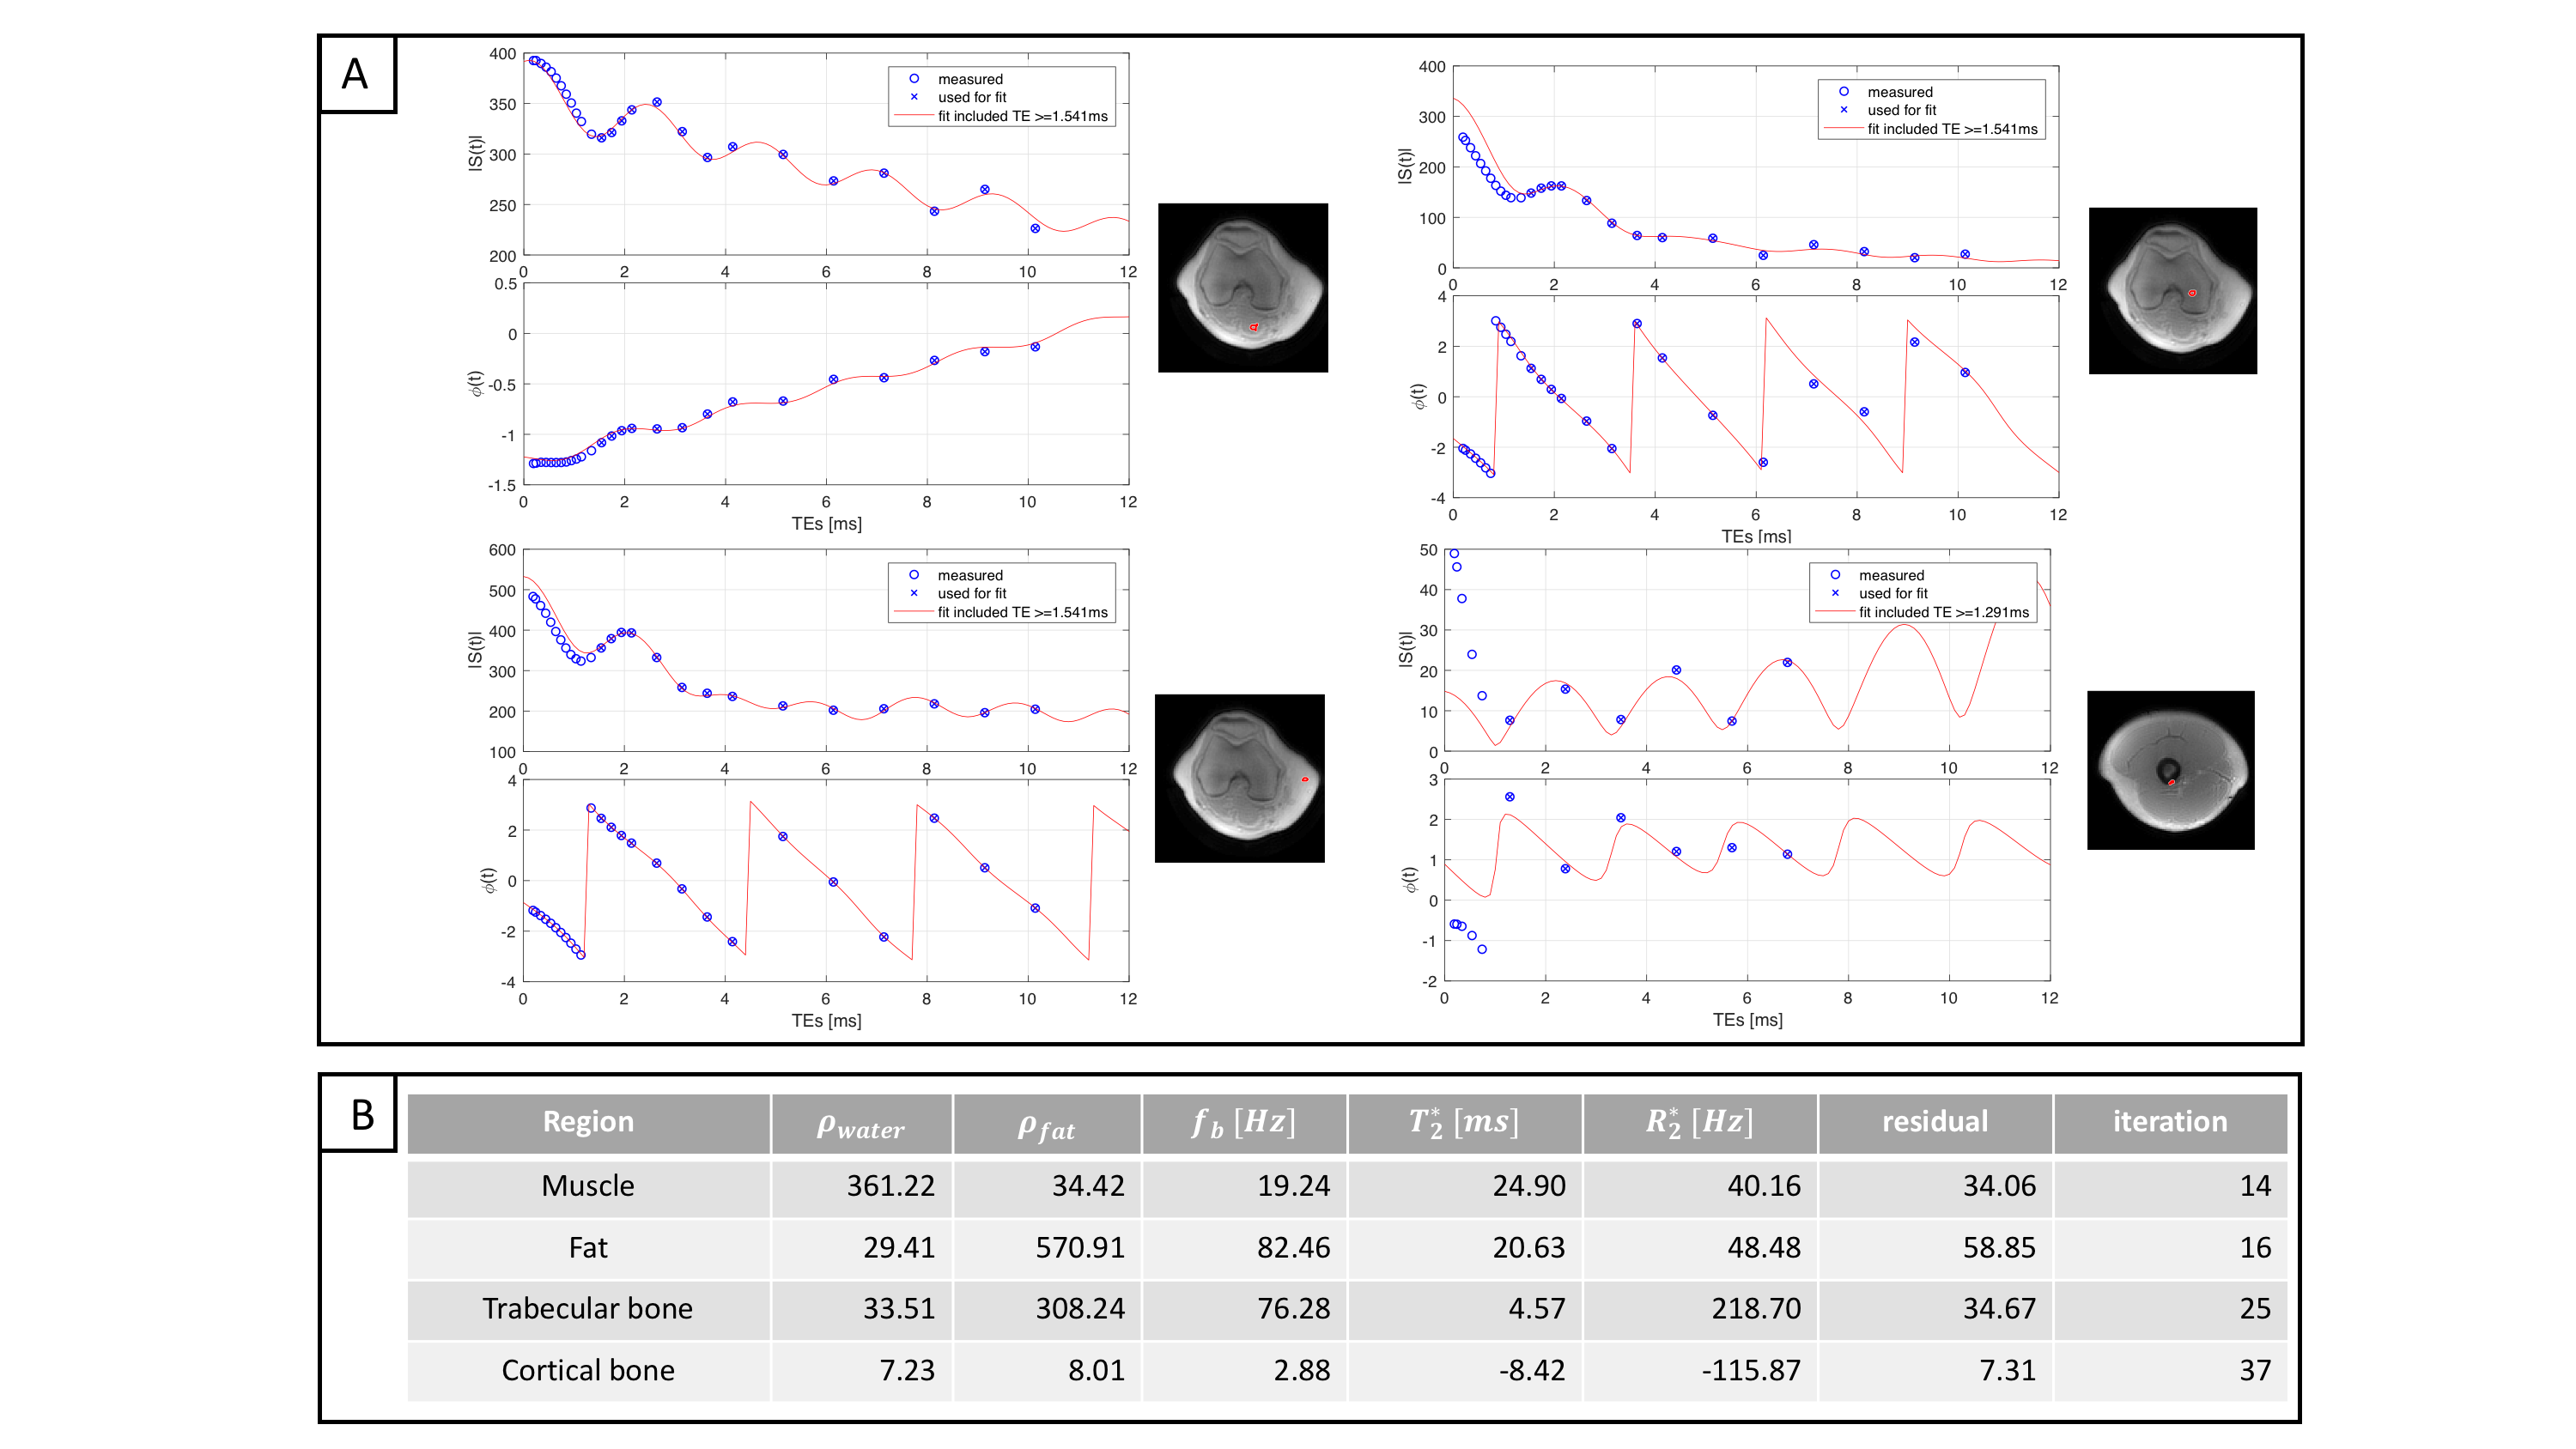
Figure 4 shows the signal decay of the 26-echoes in vivo data-set. The fit with a common-T2* water-fat signal model TEs>1.5ms showed a small residual in all ROIs. The extrapolated signal at TEs<1.5ms matched the measured data in bone and muscle. In cortical bone, the signal was underestimated and in ROIs containing trabecular bone the signal was overestimated using the extrapolation.
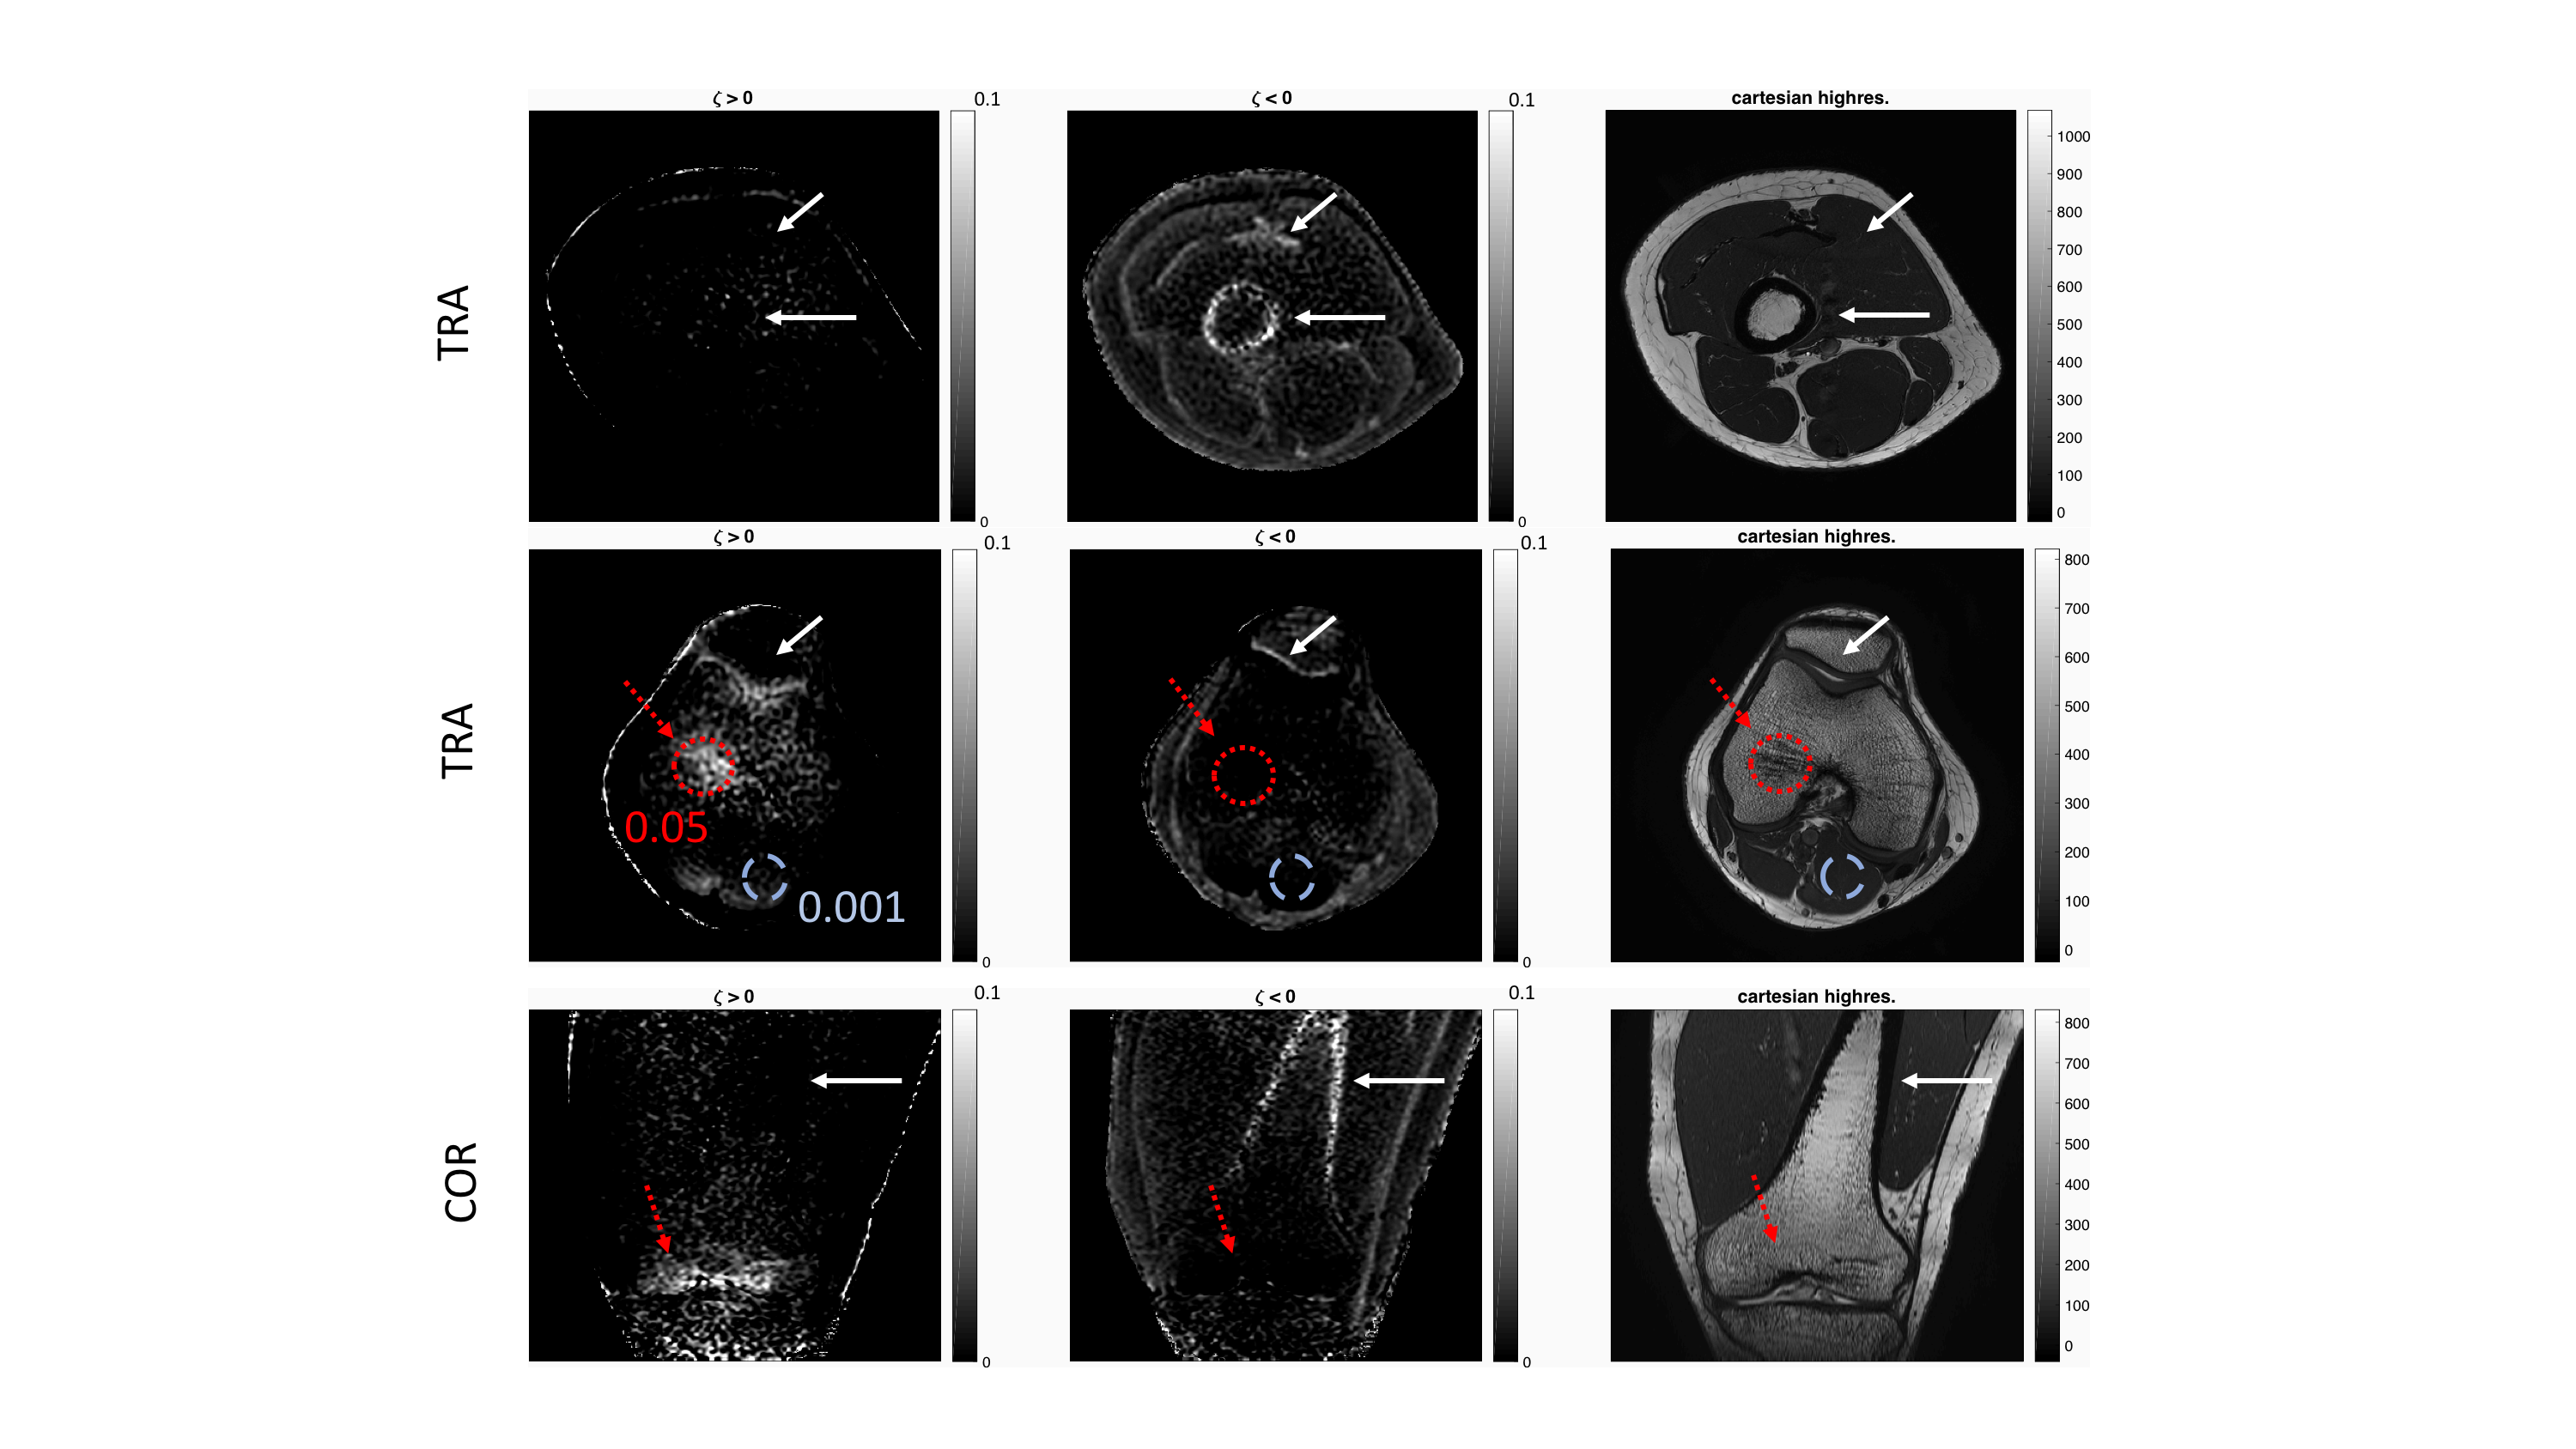
Figure 5 illustrates the difference between the measured and extrapolated signal. For ζ > 0 trabecular bone was visible and areas with a higher BV/TV lighted up (ζtrabbone =0.05 compared to ζmuscle =0.001). For ζ < 0 areas with short T2* components showed higher |ζ| values such as cortical bone and fascia.
Discussion & Conclusion
Numerical simulations showed T2* is sensitive to intra-voxel dephasing whereas ζ, parametrizing the difference of the measured and extrapolated data at t=0, is only dependent on BV/TV. Preliminary in vivo results indicated that ζ scales with BV/TV in trabecularized bone regions. Based on a 7-echo measurement sampling one UTE and 6 conventional TEs, the ζ map allowed the visualization of both trabecularized bone and cortical bone regions.Acknowledgements
Acknowledgement: The present work was supported by the European Research Council (grant agreement No 677661, ProFatMRI). This work reflects only the authors view and the EU is not responsible for any use that may be made of the information it contains. The authors also acknowledge research support from Philips Healthcare.References
[1] Wehrli FW, Song HK, Saha PK, Wright AC. Quantitative MRI for the
assessment of bone structure and
function. NMR Biomed. 2006. doi:10.1002/nbm.1066
[2] Wehrli FW, Song HK, Saha PK, Wright AC. Quantitative MRI for the assessment of bone structure and function. NMR Biomed. 2006. doi:10.1002/nbm.1066
[3] Wehrli FW. Structural and functional assessment of trabecular and cortical bone by micro magnetic resonance imaging. J Magn Reson Imaging. 2007. doi:10.1002/jmri.20807
[4] Wehrli FW. Structural and functional assessment of trabecular and cortical bone by micro magnetic resonance imaging. J Magn Reson Imaging. 2007. doi:10.1002/jmri.20807
[5] Wehrli FW. Structural and functional assessment of trabecular and cortical bone by micro magnetic resonance imaging. J Magn Reson Imaging. 2007. doi:10.1002/jmri.20807
[6] Yablonskiy DA, Haacke EM. Theory of NMR signal behavior in magnetically inhomogeneous tissues: The static dephasing regime. Magn Reson Med. 1994. doi:10.1002/mrm.1910320610
[7] Newitt DC, Majumdar S, Jergas MD, Genant HK. Decay characteristics of bone marrow in the presence of a trabecular bone network: In vitro and in vivo studies showing a departure from monoexponential behavior. Magn Reson Med. 1996. doi:10.1002/mrm.1910350622
[8] Newitt DC, Majumdar S, Jergas MD, Genant HK. Decay characteristics of bone marrow in the presence of a trabecular bone network: In vitro and in vivo studies showing a departure from monoexponential behavior. Magn Reson Med. 1996. doi:10.1002/mrm.1910350622
[9] Ma, Y‐J, Chen, Y, Li, L, et al. Trabecular bone imaging using a 3D adiabatic inversion recovery prepared ultrashort TE Cones sequence at 3T. Magn Reson Med. 2019; 00: 1-12. https://doi.org/10.1002/mrm.28027
[10] Du J, Bydder GM. Qualitative and quantitative ultrashort-TE MRI of cortical bone. NMR Biomed. 2013. doi:10.1002/nbm.2906
[11] Jerban S, Ma Y, Li L, et al. Volumetric mapping of bound and pore water as well as collagen protons in cortical bone using 3D ultrashort echo time cones MR imaging techniques. Bone. 2019. doi:10.1016/j.bone.2019.05.038
[12] Yablonskiy DA. Quantitation of intrinsic magnetic susceptibility-related effects in a tissue matrix. Phantom study. Magn Reson Med. 1998. doi:10.1002/mrm.1910390312
[13] Diefenbach, M.N., Van, A., Meineke, J., Kirschke, J.S., Schwaiger, B., Baum, T., Gersing, A., Karampinos, D.C., On the Sensitivity of Bone Marrow Magnetic Susceptibility and R2* on Trabecular Bone Microstructure, in: Proceedings 26. Annual Meeting International Society for Magnetic Resonance in Medicine. Paris, France, p. 0533. (2018)
[14] Ren J, Dimitrov I, Sherry AD, Malloy CR. Composition of adipose tissue and marrow fat in humans by 1H NMR at 7 Tesla. J Lipid Res. 2008. doi:10.1194/jlr.D800010-JLR200
[15] Boucneau T, Cao P, Tang S, et al. In vivo characterization of brain ultrashort-T 2 components. Magn Reson Med. 2018. doi:10.1002/mrm.27037
[16] Rahmer J, Mazurkewitz P, Börnert P, Nielsen T. Rapid acquisition of the 3D MRI gradient impulse response function using a simple phantom measurement. Magn Reson Med. 2019. doi:10.1002/mrm.27902
[17] Diefenbach, M.N., Ruschke, S., Karampinos, D.C., A generalized formulation for parameter estimation in MR signals of multiple chemical species, in: Proc. of 25th Scientific Meeting of ISMRM. USA, Hawaii, Honolulu, p. 5181. (2017)
Figures