2765
The potential clinical value of a quantitative Dixon sequence in predicting bone marrow fat on the lumbar spine1MRI, The first affiliated hospital of Zhengzhou university, Zhengzhou, China, 2MR Collaboration, Siemens Healthcare Ltd., Beijing, China, 3Siemens Healthcare GmbH, Erlangen, Germany
Synopsis
Osteoporosis is a systemic disease characterized by low bone mass with increased fracture risk. This work investigated and evaluated the role of the quantitative Dixon sequence in predicting the bone marrow fat on the lumbar spine, which might provide quantitative imaging parameters for accurately predicting fracture risk in patients with osteoporosis.
Purpose
Osteoporosis has become an increasingly important health problem, particularly in developed countries[1]. In osteoporotic bone marrow, fat increases as bone mass decreases[2]. The quantification of bone marrow fat has the potential to predict abnormal bone density, osteoporosis, and fracture risk[3]. Chemical shift–based water-fat decomposition MRI allows for the spatially resolved assessment of bone marrow fat fraction (BMFF). This technique can separate MRI signals from protons in water and in fat using a Dixon-like approach[4]. In this study, we aimed to use a prototypic quantitative Dixon (Q-Dixon) sequence to evaluate the BMFF of the lumbar spine and to investigate its feasibility for diagnosing and monitoring osteoporosis.Materials and Methods
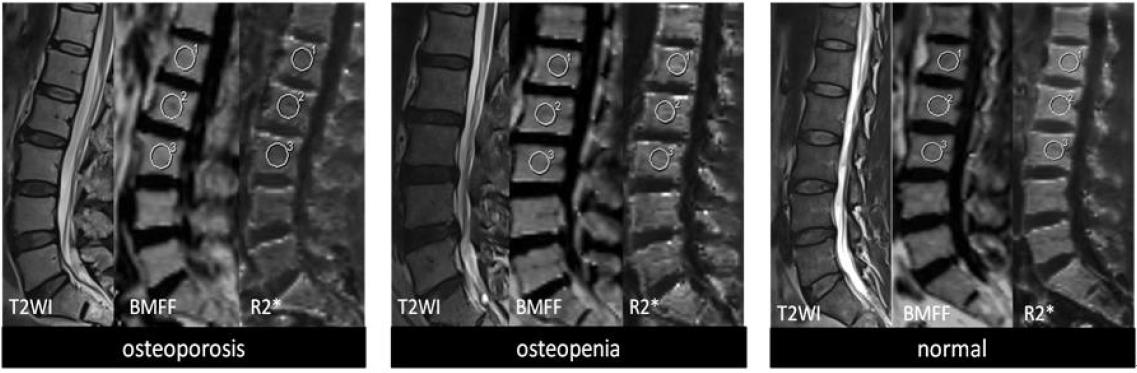
A total of 372 subjects (169 males and 203 females aged 35.1±15.2 years old) with no known history of spinal pathology or surgery or hormone therapy underwent quantitative computed tomography (QCT) and Q-Dixon. QCT was performed on the L1-3 vertebral bodies; bone mineral density (BMD) values were subsequently obtained. Individuals were divided into three groups based on their BMD values (i.e., normal: BMD > 120 mg/cm3; osteopenia: 80 mg/cm3 < BMD < 120 mg/cm3; and osteoporosis: BMD < 80 mg/cm3). The MR examinations were performed on a 3T system (MAGNETOM Prisma, Siemens Healthcare, Erlangen, Germany) with part of a 32-channel spine coil. A multi-echo gradient echo–based prototype Q-Dixon sequence was applied to acquire image data with the following parameters: TR = 9.15 ms; 6TEs = 1.26, 2.60, 3.94, 5.28, 6.62, and 7.96 ms; FOV = 350 × 306 mm2; slice thickness = 3.5 mm; matrix = 160 × 105; FA = 4º; 8 averages; and acquisition time = 57s. R2* maps and BMFF maps with T2* correction were generated inline after data acquisition. Regions of interest (ROIs) were drawn on both maps of the L1-3 vertebral bodies. BMFF, and R2* values were compared between different groups with the Kruskal–Wallis test. Receiver operating characteristic (ROC) analyses were employed to assess the performance of BMFF and R2* values in differentiating different levels of BMD. A Pearson correlation was performed to compare BMFF and R2* values with BMD separately amongst all patients. In all the analyses, a P-value < 0.05 was considered statistically significant.Results
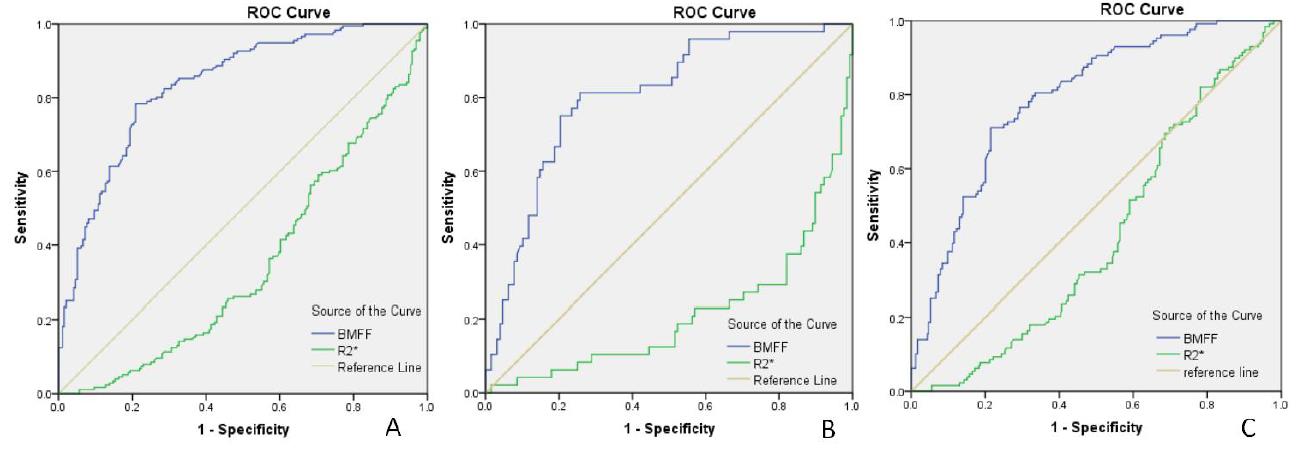
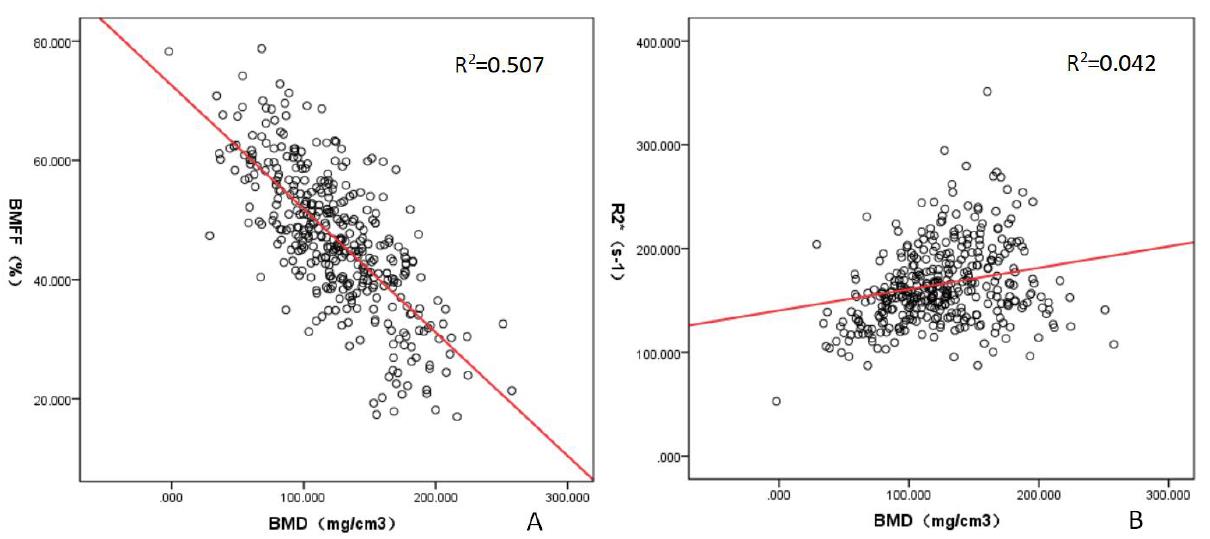
BMFF and R2* values were significantly different between the normal and abnormal groups (both P < 0.05). The areas under the ROC curves (AUC) were 0.835 and 0.352, respectively (Figure 2). The sensitivity and specificity of BMFF were 0.784 and 0.791, respectively, with a cutoff value of 47.0%. The sensitivity and specificity of the R2*values were 0.398 and 0.398, respectively, with cutoff value of 158s-1. The AUCs of BMFF and R2* for distinguishing osteoporosis from osteopenia were 0.803 and 0.212, respectively. The sensitivity and specificity of BMFF were 0.792 and 0.750, respectively, with a threshold of 55.9%. The sensitivity and specificity of the R2* values were 0.271 and 0.297, respectively, with a threshold of 148s-1. The AUCs of BMFF and R2* for distinguishing osteopenia from normal were 0.790 and 0.418, respectively. The sensitivity and specificity of BMFF were 0.734 and 0.721, respectively; the threshold value was 46.0%. The sensitivity and specificity of the R2*values were 0.453 and 0.436, respectively; the threshold value was 160 s-1. Notably, the diagnostic value of BMFF was significantly higher than that of R2*. The BMFF of the bone had a significant and strongly negative correlation with BMD (Pearson correlation coefficient of -0.713, P-value < 0.001), whereas the R2* values of the bone had a significant and weakly positive correlation with the BMD (Pearson correlation coefficient of 0.204, P-value < 0.001) (Figure 3).Discussion and Conclusion
In this study, a Q-Dixon sequence was performed to quantify the bone marrow content, with QCT-derived BMD values as a reference. Fat content is not a direct indicator of BMD [5]. In our study, the BMFF of the vertebral bodies was strongly correlated with BMD, i.e., the decrease in bone density within the vertebrae was associated with a corresponding fat increase in osteoporotic bone marrow. The negative correlation between the fat content and BMD could be attributed to the observation that the lost bone mass in the vertebral space is filled with fatty bone marrow.In conclusion, Q-Dixon is a fast, simple, noninvasive, and nonionizing method to quantify vertebral BMFF and has the potential to predict abnormal bone density.Acknowledgements
No acknowledgement found.References
[1].Yihao Guo,Yanjun Chen, Xintao Zhang, et al. Magnetic Susceptibility and Fat Content inthe Lumbar Spine of Postmenopausal Women With Varying Bone Mineral Density[J]. J Magn Reson Imaging. 2019,49(4):1020-1028.
[2].Yanjun Chen,Yihao Guo,Xintao Zhang, et al.Bone susceptibility mapping with MRI is an alternative and reliable biomarker of osteoporosis in postmenopausal women[J]. Eur Radiol. 2018,28(12):5027-5034.
[3].Yinxia Zhao, Mingqian Huang,Jie Ding, et al. Prediction of Abnormal Bone Density and Osteoporosis From Lumbar Spine MR Using Modified Dixon Quant in 257 Subjects With Quantitative Computed Tomography as ReferenceJ Magn Reson Imaging. 2019 ,49(2):390-399.
[4].Huimin Lin, Caixia Fu, Stephan Kannengiesser,et al.Quantitative Analysis of Hepatic Iron in Patients Suspected of Coexisting Iron Overload and Steatosis Using Multi-echo Single-Voxel Magnetic Resonance Spectroscopy: Comparison With Fat-Saturated Multi-echo Gradient Echo Sequence[J].J Magn Reson Imaging. 2018,48(1):205-213.
[5]. L. Huo, K. Li2, W. Deng,et al. Optimal cut-points of visceral adipose tissue areas for cardiometabolic risk factors in a Chinese population: a cross-sectional study[J]. Diabet Med. 2019,[Epub ahead of print].
Figures